A search for pre-substellar cores and proto-brown dwarf candidates in Taurus: multiwavelength analysis in the B213-L1495 clouds
Abstract
In an attempt to study whether the formation of brown dwarfs (BDs) takes place as a scaled-down version of low-mass stars, we conducted IRAM 30 m/MAMBO-II observations at 1.2 mm in a sample of 12 proto-BD candidates selected from Spitzer/IRAC data in the B213-L1495 clouds in Taurus. Subsequent observations with the CSO at 350 m, VLA at 3.6 and 6 cm, and IRAM 30 m/EMIR in the 12CO (1–0), 13CO (1–0), and N2H+ (1–0) transitions were carried out toward the two most promising Spitzer/IRAC source(s), J042118 and J041757. J042118 is associated with a compact ( arcsec or AU) and faint source at 350 m, while J041757 is associated with a partially resolved ( arcsec or AU) and stronger source emitting at centimetre wavelengths with a flat spectral index. The corresponding masses of the dust condensations are and for J042118 and J041757, respectively. In addition, about 40 arcsec to the northeast of J041757 we detect a strong and extended submillimetre source, J041757-NE, which is not associated with NIR/FIR emission down to our detection limits, but is clearly detected in 13CO and N2H+ at km s-1, and for which we estimated a total mass of , close to the mass required to be gravitationally bound. In summary, our observational strategy has allowed us to find in B213-L1495 two proto-BD candidates and one pre-substellar core candidate, whose properties seem to be consistent with a scaled-down version of low-mass stars.
keywords:
Stars: brown dwarfs – Stars: formation – Stars: individual objects: SSTB213 J041757, SSTB213 J042118 – ISM: molecules – ISM: dust – ISM: clouds1 Introduction
The formation mechanism of brown dwarfs (BDs) is currently a matter of vigorous debate. Since the typical thermal Jeans mass in molecular cloud cores is around 1 , a cloud should not fragment in cores of substellar masses and the formation of brown dwarfs cannot be directly explained as a scaled-down version of low-mass star formation. A possible scenario is that BDs form from fragmentation of turbulent cores. In this scenario, turbulence produces particular density enhancements, decreasing the Jeans mass and allowing the formation of cloud cores of very low masses (Padoan & Nordlund 2004). Another possible scenario is the formation of BDs through fragmentation of massive discs and subsequent ejection (Rice et al. 2003; Stamatellos & Whitworth 2009), or ejection could also take place in the very first stages of formation of a multiple system (e. g., Reipurth & Clarke 2001; Umbreit et al. 2005; Basu & Vorobyov 2012), depriving the ejected objects from gaining further mass. Other scenarios propose that an initially typical core is photoerosioned due to the nearby presence of a massive star (Whitworth & Zinnecker 2004).
An observational way to distinguish among these different scenarios is the search and characterization of BDs in their very first evolutionary stages, what we call here the proto-BD stage (following the nomenclature of Pound & Blitz 1993; 1995, and equivalent to Class 0/I stages of low-mass star formation). If BDs form in a similar way as their low-mass stellar counterparts, one would expect to find proto-BDs surrounded by substantial discs and envelopes, with the envelopes similar to the ones observed in the first stages of low-mass protostars (e. g., Andre, Ward-Thompson, & Barsony 1993), which are strongly emitting in the millimetre/submillimetre range. In addition, proto-BDs should be found associated with outflow and ejection phenomena, whose parameters should be a scaled-down version of low-mass stars, and perhaps should even form planetary systems. As a matter of fact, a significant number of BDs with ages of a few Myr have been shown to have discs (e. g., Luhman et al. 1997; White et al. 1999; Fernández & Comerón 2001; Barrado y Navascués & Martín 2003; Pascucci et al. 2003; Barrado y Navascués et al. 2004, 2007; Natta et al. 2004; Apai et al. 2005; Mohanty et al. 2005; Jayawardhana et al. 2006a,b; Luhman et al. 2005, 2007, 2008, 2010; Harvey et al. 2010; Monin et al. 2010; Joergens et al. 2012; Riaz et al. 2012b), but most of these discs were inferred from optical or near/mid-infrared data, being thus T-Tauri analogs or Class II sources.
Different research groups have searched for proto-BDs in the millimetre/submillimetre range. One of the pioneering works was that of Pound & Blitz (1993; 1995), who find no clear-cut evidences of proto-BDs. These works were followed up by Greaves et al. (2003), who survey an area of the Ophiucus star-forming region with the JCMT at 850 m, and find a dozen of possible planetary-mass isolated objects. However, their submillimetre sources could be tracing either truly proto-BDs or transient objects, and these objects remain to be confirmed through molecular line observations. Other candidates to be BDs in the Class 0/I phase are the so-called Very Low Luminosity Objects (VeLLOs), objects embedded in dense cores with internal luminosities (Di Francesco et al. 2007; Dunham et al. 2008), such as L1014-IRS and L1148-IRS, which are associated with dusty and dense envelopes, centimetre emission (L1014: Shirley et al. 2007), and CO (1–0) and CO (2–1) outflows (Bourke et al. 2005; Kauffmann et al. 2011), all properties suggestive of accretion/ejection of matter. However, for L1014-IRS and the other few VeLLOs studied in detail (e. g., André, Motte, & Bacmann 1999; Young et al. 2004; Kauffmann et al. 2005, 2008, 2011; Lee et al. 2009; Dunham et al. 2010) their true substellar nature is not clear (eg., Lee 2007), nor from the bolometric luminosity ( ) neither from the mass of the envelope, which could increase the present mass well above the substellar limit once accreted on to the object (Kauffmann et al. 2011). On the other hand, the studies of Klein et al. (2003), and Scholz et al. (2006), who carry out surveys with the JCMT and/or the IRAM 30 m Telescope, were addressed towards samples of relatively old brown dwarfs ( Myr), selected from optical/infrared surveys, while the most embedded objects are expected at ages Myr. Finally, individual proto-BD candidates studied in detail in the millimetre/submillimetre range either are more evolved than Class I sources (e. g., Phan-Bao et al. 2008; Harvey et al. 2012; Riaz et al. 2012a), or do not have the mass well constrained and could still be stellar (e. g., Scholz et al. 2008).
In this paper we show the results of a millimetre/submillimetre study of a sample of 12 proto-BD candidates selected in the B213-L1495 dark clouds of the Taurus-Auriga complex using Spitzer data. We show the results of the observations at 1.2 mm toward this sample, as well as submillimetre data for the two most promising candidates found at 1.2 mm. One of the candidates was not previously reported, while the other candidate was already reported in Barrado et al. (2009), and here we present subsequent observations aimed at further constraining its nature, which additionally reveal a nearby starless core of substellar mass, i. e., a possible pre-substellar core.
 |
2 Selection strategy and observations
2.1 Selection strategy
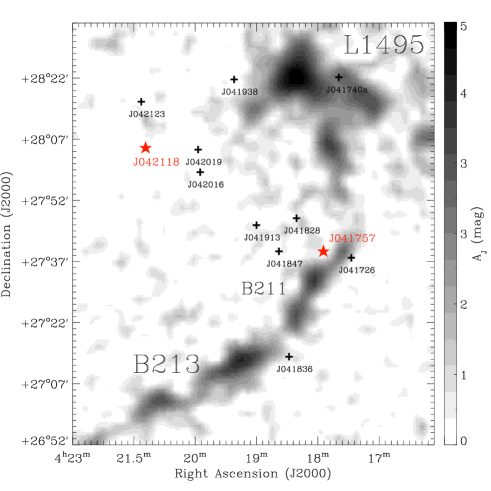
We used IRAC and MIPS (Spitzer) data toward one of the youngest regions in Taurus, the B213-L1495 region. This region was selected from Froebrich (2005) list of Class 0 sources, because it was one of the nearby ( pc) regions with a higher ratio of Class 0/I to Class II IRAC sources (see Fig. 1 in Barrado et al. 2009). For B213-L1495, we downloaded the Spitzer archive data and selected 12 IRAC sources which were classified as Class 0/I according to IRAC color-color diagrams (Allen et al. 2004), and substellar (with a magnitude below the 0.075 cut in the color-magnitude diagram, after comparing with evolutionary models, Barrado et al. 2009). In addition, we rejected those objects classified as extragalactic candidates following the criteria of Harvey et al. (2006), Joergensen et al. (2006), and Bouy et al. (2009). Fig. 1 shows the final sample overlaid on an extinction map of the region, elaborated for this work using the star count method on 2MASS data.
2.2 IRAM 30 m ON-OFF at 1.2 mm and APEX at 870 m for the sample of 12 proto-BD candidates
We observed with the IRAM 30 m111The IRAM 30m Telescope is operated by the Institut de Radioastronomie Millimetrique, which is supported by INSU/CNRS (France), MPG (Germany), and IGN (Spain). single-dish Telescope (Pico Veleta, Spain) the 1.2 mm continuum emission of the 12 selected BD candidates using the 117-channel MAMBO-II bolometer array. The Half Power Beam Width (HPBW) of the telescope at 1.2 mm is 11 arcsec. Observations were carried out in 2007 May, October, November, and 2008 November 14, and the opacities ranged between 0.30 and 0.40. Each source was centred in the most sensitive pixel of the array (pixel 20). Typical pointing corrections were arcsec, providing a positional accuracy of arcsec. The background subtraction was performed by using the ON-OFF observing mode, with a wobbler throw of 32 arcsec. Every source was observed for at least one scan of 20 minutes with an integration time per subscan of 60 s. The data were reduced using the MOPSIC pipeline provided by IRAM. In order to test the consistency of the data we measured for each source the flux density for each scan separately, and obtained values that were consistent within the uncertainties. In Table 1 we summarize the observations presented in this work, and in Table 2 we give the list of the 12 selected Spitzer/IRAC sources222Throughout this paper, we will refer to each source of Table 2 designated by ‘SSTB213 J04mmss.ss+ddmmss.s’ as ‘J04mmss’., total integration time, opacity at 250 GHz, and the measured flux density at 1.2 mm. The final rms noise at 1.2 mm was typically 0.7–1.5 m, depending on the integration time. None of the 12 Spitzer/IRAC sources was detected above the level, corresponding to envelope/disk masses (for a dust temperature of 15 K and a dust opacity at 1.2 mm of 0.009 cm2 g-1, Ossenkopf & Henning 1994, Table 2). However, for two of the observed Spitzer/IRAC sources we measured fluxes above 2, namely J041757 and J042118, which were subsequently observed with the CSO.
In addition, we used public archived data from LABOCA for the Atacama Pathfinder Experiment (APEX) antenna333APEX is a collaboration between the Max-Planck-Institut fuer Radioastronomie, the European Southern Observatory, and the Onsala Space Observatory.. Observations at 870 m were carried out in 2009 July under the project E-083.C-0453A.2009 (P.I. M. Tafalla). The region mapped corresponds to Taurus B213 and B211 filaments, and was observed during a total time of 14 hours, under good weather conditions (precipitable water vapor (pwv) ranged between 0.25 and 1.8 mm). Data reduction was performed using BoA and miniCRUSH software packages following standard procedures. The LABOCA image covers 5 of the 12 Spitzer/IRAC sources of our sample, and none of the 5 sources were detected (see Table 2 for upper limits).
| Wavelength | Observing | Sources | Date | HPBWa | P. A.a | |
|---|---|---|---|---|---|---|
| Telescope/Instrument | (m) | mode | observed | (yy/mm/dd) | (arcsec) | (°) |
| CFHT/MegaPrime-MegaCam | 0.75,0.90 | photometry | J041757 | 04/12/05b | ||
| APO/SDSS | 0.89 | photometry | J042118 | |||
| CAHA/Omega2000 | 1.25,1.65,2.17 | photometry | J041757 | 07/11/04b | ||
| UKIDSS/WFCAM | 1.25,1.63,2.20 | photometry | J042118 | 07/09/28 | ||
| Spitzer/IRAC | 3.6,4.5,5.8,8.0 | photometry | Table 2 | 05/02/21b | 1.4–1.9 | |
| WISE/SC | 12,22 | photometry | J041757,J042118 | 2010 | 6.5–12 | |
| Spitzer/MIPS | 24,70 | photometry | Table 2 | 05/02/28b | 6–18 | |
| CSO/SHARC-II | 350 | cont. imaging | J041757,J042118 | 08/01/28 | 10 | |
| APEX/LABOCA | 870 | cont. imaging | 5 sources Table 2 | 09/07 | 18 | |
| IRAM 30m/MAMBO-II | 1200 | ON-OFF | Table 2 | 07/05,07/11 | 11 | |
| IRAM 30m/EMIR | 2700,13CO(1–0) | line imaging | J041757 | 09/10/28 | 22 | |
| IRAM 30m/EMIR | 2600,12CO(1–0) | line imaging | J041757 | 09/10/28 | 22 | |
| IRAM 30m/EMIR | 3200,N2H+(1–0) | freq. switch. | J041757 | 10/08/13 | 27 | |
| VLA | 36000 | cont. imag.,Dc | J041757 | 08/09/04 | ° | |
| VLA | 36000 | cont. imag.,Bc | J041757 | 09/02/25 | ° | |
| VLA | 60000 | cont. imag.,Dc | J041757 | 08/09/04 | ° | |
| VLA | 60000 | cont. imag.,Bc | J041757 | 09/02/25 | ° |
-
a
Half Power Beam Width (HPBW) and Position Angle (P. A.) of the beam.
-
b
Some data already published in Barrado et al. (2009).
-
c
‘B’ or ‘D’ stands for the array configuration.
| Position | Int. timea | b | c | d | ||
|---|---|---|---|---|---|---|
| Source | (min) | (mJy) | () | (mJy) | ||
| SSTB213 J041726.38+273920.0 | 04 17 26.38 | +27 39 20.0 | 40 | |||
| SSTB213 J041740.32+282415.5 | 04 17 40.32 | +28 24 15.5 | 40 | e | ||
| SSTB213 J041757.77+274105.0 | 04 17 57.77 | +27 41 05.0 | 100 | b | ||
| SSTB213 J041828.08+274910.9 | 04 18 28.08 | +27 49 10.9 | 20 | |||
| SSTB213 J041836.33+271442.2 | 04 18 36.33 | +27 14 42.2 | 20 | |||
| SSTB213 J041847.84+274055.3 | 04 18 47.84 | +27 40 55.3 | 20 | |||
| SSTB213 J041913.10+274726.0 | 04 19 13.10 | +27 47 26.0 | 20 | |||
| SSTB213 J041938.77+282340.7 | 04 19 38.77 | +28 23 40.7 | 20 | |||
| SSTB213 J042016.70+280033.7 | 04 20 16.70 | +28 00 33.7 | 20 | |||
| SSTB213 J042019.20+280610.3 | 04 20 19.20 | +28 06 10.3 | 20 | |||
| SSTB213 J042118.43+280640.8 | 04 21 18.43 | +28 06 40.8 | 40 | b | ||
| SSTB213 J042123.70+281800.6 | 04 21 23.70 | +28 18 00.6 | 20 | |||
-
a
Total integration time for IRAM 30m/MAMBO-II ON-OFF observations.
-
b
Upper limits correspond to . For the case of J041757 and J042118, the weighted mean of the different subscans was and mJy respectively, both above , while for the other sources the weighted mean was well below .
-
c
Masses of disc/envelope estimated from the 1.2 mm continuum emission, assuming the emission is optically thin, a dust temperature of 15 K, and a dust opacity at 1.2 mm of 0.009 cm2 g-1 (Ossenkopf & Henning 1994).
-
d
Upper limits correspond to , and are measured in the Archive APEX/LABOCA image of the B213/B211 filament (see § 2.2).
-
e
No reliable flux due to the presence of a submillimetre source (J0417426+282442, detected by AKARI with a flux of 3.6 Jy at 140 m) within the wobbler throw. We estimated that up to 6 mJy could have been subtracted to this source. This is the only source of our sample with an AKARI submillimetre source within the wobbler throw of the IRAM 30m/MAMBO observations.
2.3 CSO at 350 m for J042118 and J041757
The Caltech Submillimetre Observatory (CSO) observations toward J042118 and J041757 were carried out on 2008 January 28, using the SHARC-II bolometer array at 350 m. The HPBW of the CSO at this wavelength is 8.6 arcsec, which was convolved to a final beam of 10.4 arcsec. Typical opacities at 225 GHz were around 0.04. The observations were carried out in imaging mode using a lissajous pattern of 20 arcsec of amplitude and 14.142 seconds of period, resulting in a final image size of arcmin2. In this observing mode, the telescope modulates the X and Y position with a different sine wave for each axis (starting from the centre of the map). As a consequence, the rms is lower in the centre of the image than in the edges. Each scan was integrated for 10 minutes, and the total observing time per source was around 1–1.5 hours. The absolute flux uncertainty was estimated from a measurement of the flux of HL Tau, and was %. The uncertainty in position was arcsec. The reduction of the SHARC-II data was carried out with the CRUSH software (Kovács 2008), version 1.62-4. For both sources we assumed that the emission is compact ( arcsec) and faint ( Jy)444In Barrado et al. (2009) we show the CSO emission for J041757 assuming that the source is extended, i.e., allowing to recover emission from structures arcsec. For this case the source associated with J041757 is arcsec, and has a small extension to the north-east. However, the ‘compact’ option used in this work, although yielding more negative features, recovers a structure which is more consistent with independent observations of the region (as shown in this paper). For the J042118 region, the assumption of ‘extended’ emission (forcing the software to recover structures arcsec to avoid sky gradients) yields very similar results to the assumption of ‘compact’ emission.. The rms noises achieved at the map centres are 9 mJy for J042118 and 6 mJy for J041757.
2.4 VLA observations at 6 and 3.6 cm for J041757
We obtained radio continuum data at 6 cm (4.86 GHz) and 3.6 cm (8.44 GHz) towards the source J041757 using the Very Large Array (VLA) of the National Radio Astronomy Observatory (NRAO)555The National Radio Astronomy Observatory is a facility of the National Science Foundation operated under cooperative agreement by Associated Universities, Inc.. Observations were performed on 2008 September 4 (project AP566), and on 2009 February 25 (project AD593), with the array in D and B configuration respectively. We used the standard VLA continuum mode (4IF, 50 MHz per IF), and both right and left polarizations were processed. The phase centre of the observations was R.A.(J2000.0)=04h17m57.8s, Dec(J2000.0)=27o41′05.0′′ in both epochs. For the first set of data (D configuration of the array) and for each frequency, we used 40 minutes on source, and for the second set (B configuration) we integrated 1.5 hour on source at each frequency. See Table 3 for further details on the observations.
Both sets of data were obtained during the Extended Very Large Array (EVLA) transition mode. Calibration and data reduction were performed using the Astronomical Image processing System (AIPS, developed by NRAO), and following NRAO official recommendations for the EVLA transition mode666During the transition to the EVLA, the 50 MHz continuum mode was affected by high closure errors on EVLA-VLA baselines (affecting strongly the 3.6 cm receiver; for this reason, Barrado et al. (2009) report only the flux density at 6 cm). This problem is caused by non-matched bandpass shapes of different type of antennas. In this work, we tried to fix this problem by observing a strong source with known structure and determining baseline-based closure corrections using the AIPS task BLCAL.. As a result, data in D configuration at both 6 and 3.6 cm were successfully calibrated. As for the second dataset (B configuration), anomalous data affecting the flux calibrator were flagged at 6 cm777For the B configuration data, anomalous jumps in the amplitudes and phases for certain EVLA antennas, specially during the end of the target and flux calibrator observation, prevented us from a reliable flux calibration. These anomalous data were flagged only for the 6 cm case, because the 3.6 cm observations were too short. However, flagging these data with anomalous jumps improved the signal-to-noise, while the morphology of the object was found unaffected, giving us confidence on the morphology of the source seen in the B configuration data at both 6 and 3.6 cm.. Thus, we used data in B configuration just to illustrate the morphology of the emission at higher angular resolution, and for flux measurement purposes we used only the first dataset (D configuration). For the D configuration data, we produced radio continuum maps with natural weighting to optimize the sensitivity of the images, achieving rms noises of 0.025 and 0.055 m at 6 cm and 3.6 cm, respectively. For the B configuration data, we produced maps with natural weighting and using a taper in the -data of 150 k at 6 cm and 120 k at 3.6 cm. For the B configuration data we refrain from giving the rms noises because of anomalous data for the flux calibrator.
| Flux | Flux | Phase | Flux a | ||
|---|---|---|---|---|---|
| Config. | (cm) | calib. | (Jy) | calib. | (Jy) |
| D | 6 | 3C147 | 7.9 | J0431+206 | |
| D | 3.6 | 3C147 | 4.7 | J0431+206 | |
| B | 6 | 3C138 | 3.6 | J0431+206 | |
| B | 3.6 | 3C138 | 2.4 | J0431+206 |
-
a
Bootstrapped flux.
2.5 IRAM 30m CO, 13CO and N2H emission for J041757
J041757 was observed in the CO (1–0) (115.271204 GHz), and 13CO(1–0) (110.201370 GHz) transitions with the IRAM 30 m Telescope using the EMIR (Carter et al. 2012) heterodyne receivers. The observations were carried out on 2009 October 28 and 29, with system temperatures of 200–400 K (–0.35). We conducted on-the-fly maps in position-switching mode, scanning the region in R. A., and with steps of 4 arcsec in Dec., covering a size of arcmin2 centred on J041757. For each of the CO (1–0), and 13CO(1–0) transitions we used two units of the VESPA (VErsatile SPectrometer Array) backend, one in each polarization, of 40 kHz (0.11 km s-1) of spectral resolution and a bandwidth of 40 MHz ( km s-1). Simultaneously to the VESPA backend, we also used the WILMA (WIdeband Line Multiple Autocorrelator) backend, providing a bandwidth of 9000 km s-1 with km s-1 of spectral resolution at the frequency of the CO (1–0) transition. The OFF position used, at () arcsec from the map centre, was selected as free of CO from a survey in Taurus (Goldsmith et al. 2008), and was proved to be free of emission. Calibration following the standard procedures was carried out during observing time and using the MIRA package, and typical calibration errors are within 15–20%. To make the final map, spectra were averaged every 8 arcsec in both RA and DEC. Typical rms noise of spectra of each point of the final map were around 0.24, and 0.12 K, for CO (1–0), and 13CO (1–0), respectively, in main beam brightness temperature scale. The main beam efficiency at the CO (1–0) line frequency is 0.82 (94.01%, 77.53%) and at the 13CO(1–0) frequency is 0.83 (94.18%, =78.13%).
Subsequent observations of the dense gas tracer N2H+(1–0) (at 93.173764 GHz) were carried out on 2010 August 13 under reasonable summer weather conditions (pwv mm; system temperature K; opacity ), in frequency switching mode, and using VESPA with 40 MHz of bandwidth and 0.02 MHz of spectral resolution. We integrated at different positions in and around J041757, separated arcsec and covering offsets with respect to J041757 from (40,40) arcsec to () arcsec, reaching rms noises in each individual spectra of K (main beam brightness temperature). The main beam efficiency at the N2H+(1–0) frequency is 0.85 (94.76%, 80.15%). All data reduction was done using the GILDAS software package supported at IRAM.
3 Results
3.1 J042118
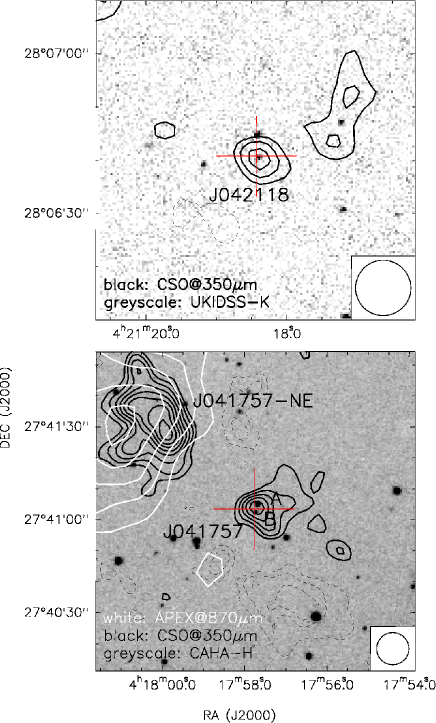
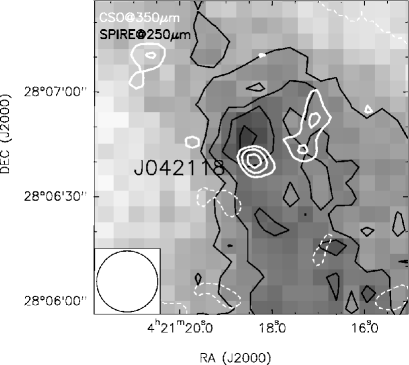
Although the 1.2 mm emission for J042118 was very marginal (2.2, Table 2), the CSO observations at 350 m reveal one clear source with a flux level of mJy (Fig. 2-top). The position of the submillimetre source, which is unresolved, is coincident with the position of the Spitzer/IRAC and UKIDSS source, and there is marginal extended and faint emission at 350 m about 10 arcsec to the west. In Table 4 we give the position, size, flux density and estimated mass of the submillimetre source detected in J042118. The mass of the disc/envelope obtained for J042118 is in the range 0.3–3 , assuming a distance of 140 pc, a dust temperature in the range 10–20 K, and a dust opacity law at 350 m of 0.101 cm2g-1 (Ossenkopf & Henning 1994). Such a mass is at least 3 orders of magnitude larger than the disc masses estimated from Herschel observations for a small sample of young BDs (Harvey et al. 2012).
 |
| rmsa | Positionb | Deconvolved | Deconvolved | Deconvolved | c | Massd | |||
|---|---|---|---|---|---|---|---|---|---|
| Source | (mJy) | ang.size (arcsec) | P. A. (°) | size (AU) | (m) | (mJy) | () | ||
| J042118 | 8.9 | 04:21:18.38 | 28:06:40.1 | 58.8 | 46 | 0.3–3 | |||
| J041757 | 6.1 | 04:17:57.67 | 27:41:05.8 | 165 | 1–10 | ||||
| J041757-NE | 8.6 | 04:18:00.30 | 27:41:36.3 | 29.7 | 356 | 2–21 | |||
-
a
Rms noise at the position of the source. Total integration time was around 1h 30min for J041757 and around 1h for J042118.
-
b
Positions corresponding to the intensity peak.
-
c
Peak intensity and flux density derived by computing statistics within the aperture corresponding to the 3 level of the source.
-
d
Masses derived assuming a dust temperature of 10–20 K, and a dust mass opacity coefficient from Ossenkopf & Henning (1994, see main text). The uncertainty in the masses due to the opacity law is estimated to be a factor of 2.
3.2 J041757
3.2.1 CSO 350 m and APEX 870 m continuum emission
J041757, with a 2.6 flux at 1.2 mm (Table 2), is well detected at 350 m, and presents a complex emission, with one partially resolved source ( arcsec of size) associated with the selected IRAC source J041757, at the centre of the field of view, and one stronger and more extended source ( arcsec) to the north-east (hereafter, J041757-NE), which is elongated in the southwest-northeast direction (Fig. 2-bottom and Table 4). The flux density of J041757 at 350 m is 165 mJy, yielding a mass of the envelope of 1–10 , (for a dust temperature of 10–20 K). Assuming a mean molecular weight (of H2 molecule) of 2.8 mH, and a size (diameter) of 2200 AU, we obtain a density of cm-3, a H2 column density of cm-2, and mag (following Frerking et al. 1982). Similarly, for J041757-NE we estimate a mass of 2–20 , a density of cm-3, a H2 column density of cm-2, and mag. These values are in perfect agreement with the values derived by Schmalzl et al. (2010) for this region. It is interesting to note that J041757-NE is also recovered in the archived APEX/LABOCA 870 m image (see Fig. 2-bottom), for which we measured a peak intensity of 100 m, and a flux density (within the 2 contour) of 420 mJy. This corresponds to a mass of 75–160 (assuming a dust temperature of 10–15 K, and a dust opacity law at 870 m of 0.018 cm2g-1, Ossenkopf & Henning 1994). The mass of the J041757-NE source as estimated from the APEX/LABOCA image is about a factor of 8 higher than the mass estimated from the CSO because structures arcsec were filtered out during the reduction process of the CSO data (§ 2.3). Thus, the total mass of J041757-NE is , from which are found in a compact structure.
3.2.2 VLA 3.6 and 6 cm continuum emission
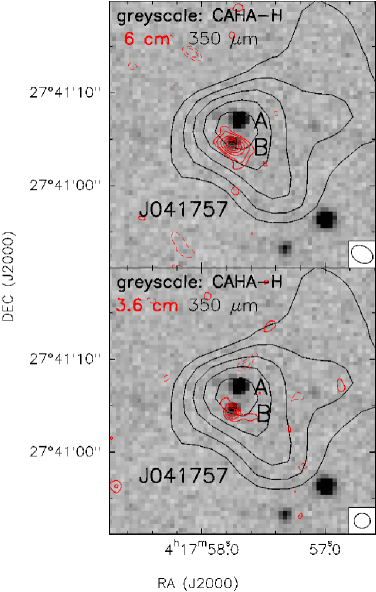
The VLA centimetre emission around J041757 reveals one single source at both 3.6 and 6 cm wavelengths at the position of J041757, with no significant emission at the position of J041757-NE. Using D-configuration only, the emission is unresolved at both frequencies, and it is detected at 7 at 6 cm, and marginally detected at 4 at 3.6 cm, with a flux density at both wavelengths of mJy (Table 5). The spectral index in the range of 6 to 3.6 cm is =0.00.5 (1 error; where ), which is indicative of optically thin free-free emission (typically arising in shocks for the case of low-mass young stellar objects and VeLLOs, see § 5.2.3). To extract the morphological information of the centimetre emission, we imaged the B-configuration data only, and the resulting images are presented in Figure 3. The figure shows first that the centimetre source is clearly associated with the NIR source ‘B’ detected by Barrado et al. (2009), while source ‘A’ shows no centimetre emission. Furthermore, the figure reveals at both 6 and 3.6 cm a faint extension in the southwest-northeast direction. A Gaussian fit to the source yields, at both wavelengths, a deconvolved size of approximately arcsec2, oriented at PA ° (Table 5).
 |
| Positiona | Size, P.A.a | ||||
|---|---|---|---|---|---|
| (cm) | (mJy) | (arcsec2, °) | |||
| 6 | 04:17:57.74 | 27:41:04.2 | 0.200.05 | ||
| 3.6 | 04:17:57.75 | 27:41:04.4 | 0.190.11 | ||
-
a
Results based on observations in B configuration of the VLA (see § 2.4), and derived from Gaussian fits. Uncertainties in sizes are around arcsec and in position angles (P. A.) are around 10°. Sizes and P. A. are deconvolved.
-
b
Results based on observations in D configuration of the VLA. Uncertainties are 2.
3.2.3 IRAM 30m molecular emission
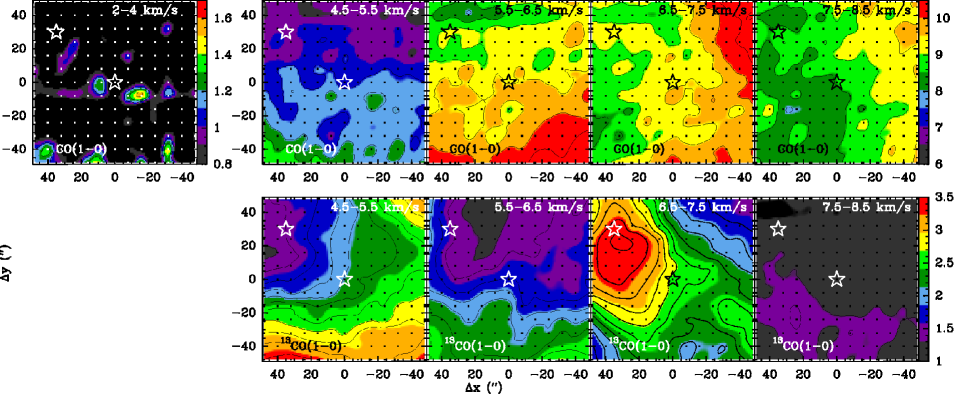
The CO (1–0) spectra averaged over a region of 40 arcsec of diameter around J041757 (left) and J041757-NE (right) are shown in Fig. 4-top. The spectra reveal the three well-known velocity components associated with the Taurus molecular cloud, at around 5, 7 and 8 km s-1 (e. g., Heyer et al. 1987; Mizuno et al. 1995). Among the three main velocity components seen in Taurus, the velocity maps of Fig. 6 of Mizuno et al. (1995) show that at the position of J041757 there are two intersecting filamentary structures with different velocities: one in the 4.5–6.0 km s-1 range, and the other in the 6.0–7.5 km s-1 range. We made line area maps by integrating the CO emission in ranges of 1 km s-1 wide, from 4.5 to 8.5 km s-1, and found that for this velocity range CO traces the large-scale structure of the B211 filament (located to the south-west of J041757, see Fig. 1), with strong intensity gradients and no clear features associated with J041757 (Fig. 5-top). This was expected because CO is optically thick and spread out over all the Taurus region (e. g., Goldsmith et al. 2008; Narayanan et al. 2008). However, we fitted with gaussians the three velocity components seen in the CO spectrum and found, for the emission line at 5 km s-1, an excess in the blueshifted emission with respect to the gaussian fit888An excess with respect to a Gaussian fit was also found with the Kitt Peak Telescope in 12CO(1–0) between 2 and 4 km s-1 (O. Morata, priv. commun.), with the integrated emission also concentrated on J041757.. The line area map integrated in the range 2–4 km s-1, where the blueshifted excess is seen, indicates that this emission is strongest around J041757, suggesting a possible relationship (Fig. 5-top).
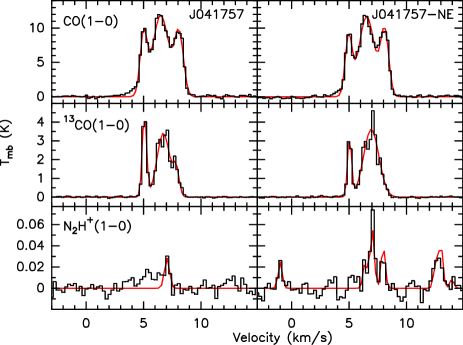 |
Concerning 13CO(1–0), well suited to trace the gas column density in the region because is optically thinner than 12CO(1–0), the averaged spectra also reveal at least 3 velocity components for both J041757 and J041757-NE. In Fig. 5-bottom, we show the line area maps of the 13CO emission integrated between 4.5 and 8.5 km s-1 in steps of 1 km s-1. Among the four mapped velocity intervals, the emission integrated between 6.5 and 7.5 km s-1 is more prominent at the position of J041757-NE, and has an extension to the south and another extension or stream to the southwest, passing through J041757. This could be a hint of the molecular gas associated with J041757-NE and J041757 coming from the same physical region.
Finally, the N2H+(1–0) averaged spectra for J041757 and J041757-NE reveal emission associated with J041757-NE (see Fig 4-bottom). We fitted the hyperfine structure of the N2H+(1–0) transition for J041757-NE using the package CLASS of the GILDAS software, and obtained the output parameter K999In the CLASS package of the GILDAS software, the first output parameter of a fit to the hyperfine structure of a given transition is , where is the filling factor, assumed to be 1, , with being the Boltzmann constant, T the temperature and the frequency; is the excitation temperature, the background temperature, and is the opacity of the main hyperfine component, –23–12 for the case of N2H+(1–0)., km s-1, km s-1, and an opacity of the –23–12 transition of , which corresponds to an excitation temperature of 3.4 K and a N2H+ column density of cm-2. This corresponds to a total H2 column density of cm-2 (assuming a N2H+ abundance of (2–5), Pirogov et al. 2003, Tafalla et al. 2004), and a mass of (for a size of arcsec in diameter), similar to the lower limit of the mass derived from the submillimetre continuum emission (Table 4). Towards J041757, the strongest hyperfine component of the N2H+(1–0) transition is detected (at 5), and a gaussian fit yields km s-1, very similar to the velocity of the J041757-NE source. This suggests that both objects are associated with dense material (as the critical density of N2H+(1–0) is cm-3) possibly coming from the same region of Taurus, as indicated also by the morphology of the 13CO emission integrated between 6.5 and 7.5 km s-1 (Fig. 5-bottom).
 |
4 Spectral Energy Distributions (SEDs)
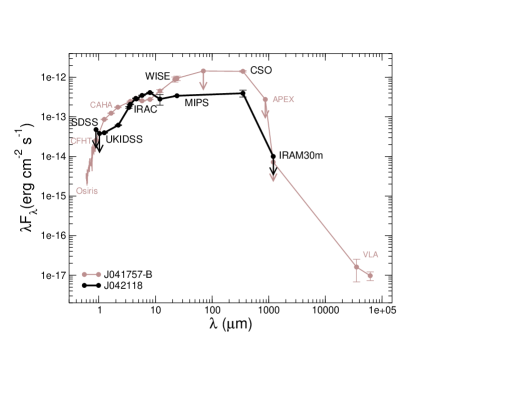
Both J042118 and J041757 are Spitzer/IRAC sources emitting at 350 m. In order to further constrain its nature, we checked the NASA Extragalactic Database (NED), the National VLA Sky Survey (NVSS) at 21 cm, and JCMT/SCUBA catalog at 450 and 850 m (di Francesco et al. 2008), and found no data for SCUBA, no significant emission in NVSS above 1 m, and no registered object in NED. To look for further archival data we used the new capabilities of the Virtual Observatory SED Analizer (VOSA, Bayo et al. 2008; Bayo et al. 2012 in prep.). The tool queries virtual observatory compliant catalogs in the ultraviolet (GALEX, IUE HPDP photometry), optical (Tycho-2, CMC-14, Hauck et al. 1997, Mermilliod & Mermilliod 1994, Sloan DSS release 7, and IPHAS), near, mid and far-infrared regimes (2MASS, IRAS, MSX6C, AKARI IRC and FIS, GLIMPSE, UKIDSS DR7, WISE preliminary release), and allows to fit several grids of models with extinction as a free parameter. Appart from the data already presented in this work and in Barrado et al. (2009), we find UKIDSS counterparts for both sources but with unreliable photometry in the H band, and WISE counterparts at less than 1 arcsec from the Omega2000 position of J041757 (NIR component B) and the Spitzer/IRAC position of J042118. Since Sloan DSS did not detect any source at the position of J041757 and J042118, we give only upper limits at the corresponding frequencies. In the Appendix we list the flux density measurements and upper limits (Table 6 and 7), and in Fig. 6 we present the SEDs for both J042118 and J041757.
5 Discussion
5.1 On the nature of J042118
J042118 is undetected in Sloan DSS (data release 8) but detected in UKIDSS (data release 7, Fig. 2), WISE, Spitzer/IRAC+MIPS and the CSO (see Table 6). In order to test if the J042118 SED (§ 4) is easily reproducible by a very extincted photospheric model (as expected if it was a background object seen through the molecular cloud), we used VOSA tool (§ 4) and found that even allowing extinction values up to mag, it is not possible to get a reasonable fit (reduced values of the order of hundreds) neither with Kurucz (Castelli et al 1997) nor with Lyon models (Allard et al 1997; Baraffe et al 1997, 1998; Hauschildt et al 1999; Chabrier et al. 2000; Allard et al 2001; Allard et al 2003, 2007, 2009), suggesting that the object belongs to Taurus.
 |
With the aim of shedding light on the nature of J042118, we compared the CSO emission to the Herschel Archive images at 250 and 160 m101010 Herschel Archive data from the ‘Herschel Gould Belt survey’ Key Program (see André et al. 2010) were downloaded (observing identification numbers 1342202090 and 1342202254). The Herschel/PACS(SPIRE) data at 160(250) m were processed with HIPE(madMap) version 8 and Scanamorphos version 14 (Roussel 2012). The Herschel data towards B211/L1495 will be published in a forthcoming paper by Palmeirim et al. (in prep.) as part of the ‘Herschel Gould Belt survey’ project. , which are the wavelengths for which the Herschel beam (17 arcsec and 11 arcsec) is more similar to the CSO beam (10 arcsec). While at 160 m there is no significant emission towards J042118, the Herschel/SPIRE 250 m emission shows an extended large-scale structure elongated in the southwest-northeast direction (see Fig. 7), with a subcondensation matching well the position of J042118, within the telescope positional uncertainties. The location of J042118 at the tip of the elongated structure, which seems to be part of the extended structures of the Taurus complex, favors its membership to Taurus. In this case, the submillimetre source detected with the CSO would be tracing a disc and/or small ( arcsec or 700 AU of radius) envelope with a mass of (Table 4). The luminosity (upper limit) for J042118 estimated from the SED (Table 6) would be , and the SED shape is reminiscent of Class I(/II) young stellar objects, with a flat slope between the NIR and the submillimetre range. This can be quantified by estimating the bolometric temperature, of K111111This number must be regarded with caution because the SED for this source is better sampled in the IR than in the submillimetre and radio range, and because we treated all flux densities which are upper limits as detections (c.f. Kauffmann et al. 2008)., typical of Class I young stellar objects (e. g., Chen et al. 1995). The fact that the submillimetre emission, as recovered by the CSO, is unresolved could be indicative of most of the envelope being accreted/dispersed, with the submillimetre emission arising only from a compact disc.
 |
5.2 On the nature of J041757
The nature of J041757 is discussed in Barrado et al. (2009), who present series of color-color and color-magnitude diagrams from Spitzer and NIR data to conclude that the most likely scenario for J041757 (for either component A and/or B) is that the object is galactic. Subsequent infrared spectroscopic observations by Luhman & Mamajek (2010) indicate that component A is most likely a M2 background star, while no conclusion could be drawn for component B because no spectrum was shown for this component in that work. This, together with the fact that source B has a raising slope in the NIR SED matching well the FIR and submillimetre emission from Spitzer/MIPS and CSO (Barrado et al. 2009), indicates that the most likely counterpart of the submillimetre source in J041757 is the NIR source B, which in turn is associated with centimetre emission (§ 3.2.2). Hereafter we will refer to source B (identified in the NIR and in the centimetre range) as J041757-B.
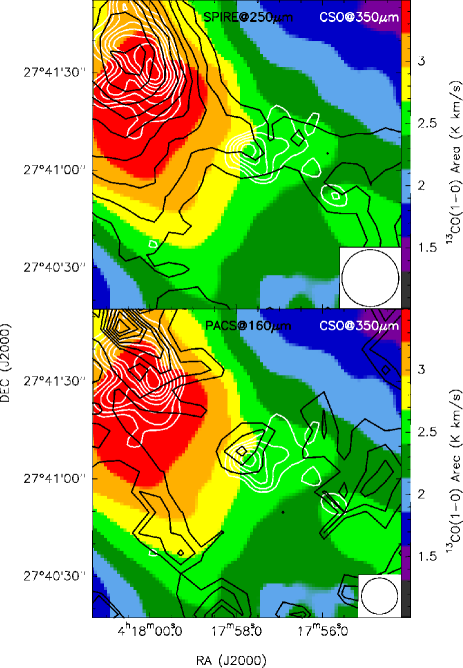
Similarly to the case of J042118, we compared the CSO emission of J041757 to the Herschel Archive images at 250 and 160 m. See Fig. 8 to visualize such a comparison. The Herschel/SPIRE emission at 250 m (black contours in Fig. 8-top) is strongest at the position of J041757-NE, matching well the 350 m emission observed with the CSO (white contours). From J041757-NE, there are two streams of emission, extending for about arcmin, one towards the south and the other towards the southwest and passing through J041757-B. The 250 m emission towards the southwestern side of the map is part of the B211 filament (Fig. 1). We note the remarkable similarity between the emission at 250 m and the 13CO(1–0) emission integrated between 6.5 and 7.5 km s-1 (colorscale in Fig. 8-top). Compared to Herschel data, the CSO is recovering the most compact (as we used the ‘compact’ option in the reduction process, see § 2.3) and fainter emission (1 noise of Herschel/SPIRE at 250 m: m; 1 noise of CSO at 350 m: m). Regarding the emission seen with Herschel/PACS at 160 m, this is again strongest at J041757-NE, and the northeast-southwestern stream splits up into one slightly resolved source coinciding, within the position uncertainties of the telescopes, with the 350 m source at the position of J041757-B. This suggests that J041757-B is associated with the hottest dust of the stream linking the J041757-NE source and the B211 filament. Flux densities measured by Herschel at 160 and 250 m are consistent with the flux densities given here as measured with the CSO, but we refrain from presenting a detailed study of the Herschel data in this work as this will be the subject of a forthcoming paper.
 |
5.2.1 J041757-B: an extragalactic object?
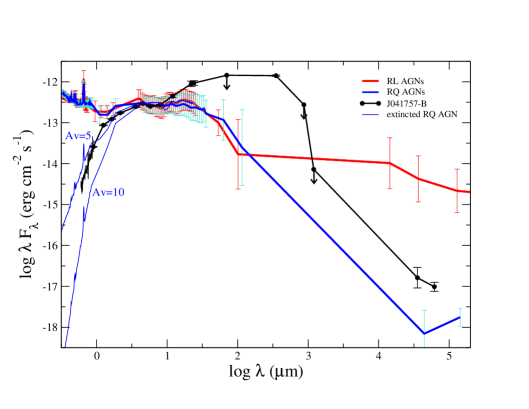 |
We consider first the possibility that J041757-B is an extragalactic object, which would be aligned by chance with the submillimetre stream linking the J041757-NE source and the B211 filament. In Fig. 9 we show a comparison of the SED for J041757-B to the recent compilation of average SEDs of radio-loud and radio-quiet AGNs of Shang et al. (2011, which are in good agreement with the classical SEDs of Elvis et al. 1994). The SEDs are normalized at 12 m (a good intrinsic indicator for AGNs, e. g., Gandhi et al. 2009) to the flux of J041757-B, and the error bars are the standard deviation of the fluxes for Shang et al. sample, being representative of the scatter in the AGN fluxes at each wavelength. From the figure, it is seen that J041757-B SED is not compatible with the radio-loud AGN SEDs, mainly because of its important drop from MIR to radio wavelengths121212We note however that if we estimate the radio-loudness from the classical definition, (following Kellermann et al. 1989), we obtain , which would classify J041757-B as a radio-loud. As explained in the text, this would be still compatible with a radio-quiet AGN if the extinction for J041757-B is important.. In the visible range, J041757-B SED is much more obscured than AGN SEDs. In order to simulate an AGN extincted SED we reddened the AGN average SED for radio-quiet using the extinction law by Fitzpatrick (1999; improved by Indebetouw et al (2005) in the infrared, and ), and with ranging from 1 to 10 (see figure, thin blue lines). The result is that the J041757 SED would be compatible with an AGN SED extincted by in the visible-IR range. However, the J041757-B SED is not fully consistent with radio-quiet AGNs either, because of its important contribution of submillimetre (and radio) emission compared to MIR. This could be indicating that there is an excess of submillimetre emission in the direction of the galaxy, which could be explained by the Taurus stream joining the J041757-NE source and the B211 filament. Nevertheless, there would be an excess of submillimetre emission from the galaxy candidate itself, as revealed by the image of Herschel/PACS at 160 m, which shows that in the stream there is only emission at 160 m at the position of J041757-B (similar case for the CSO 350 m emission, Fig. 8). In addition, flat spectral indices in the centimetre range in AGNs are not usual, as centimetre emission from AGNs is typically produced by synchrotron emission from relativistic electrons accelerated in jets (e. g., Giroletti & Panessa 2009; Ibar et al. 2009; Shang et al. 2011; Randall et al. 2012). Furthermore, a preliminar spectrum of J041757-B in the visible range taken with Osiris on the GTC (Huélamo et al., in preparation) shows no broad emission lines, while the extincted SED in Fig. 9 indicates that even with still strong and broad lines are expected for an AGN. If J041757-B was a galaxy it should be detected in forbidden emission lines in the MIR range ([OIV], [NeV]: e. g., Goulding et al. 2009) and in hardest X-rays ( keV)131313In X-rays, we could only set an upper limit for J041757-B, which is not detected in the ROSAT All-Sky Survey (RASS, Voges et al. 1999, covering the range 0.1–2.4 keV with a typical limiting sensitivity of erg cm-2 s-1, Anderson et al. 2003)., which could be the final observational tests to definitively discard the nature of J041757-B as a background galaxy.
5.2.2 J041757-B: a background object behind Taurus?
Similarly to J041757-A (Barrado et al. 2009, Luhman & Mamajek 2010), J041757-B could be a background object behind the Taurus complex. However, if J041757-A is a background star, the IR source mainly contributing to the FIR and submillimetre emission must be J041757-B. Therefore, whatever the true nature of J041757-B is, the object is embedded in considerable amounts of dust, and hence should be associated with molecular gas as well. This molecular gas, if J041757-B does not belong to Taurus, should appear as a velocity component in the line of sight different from Taurus velocities, while in a 9000 km/s band we did not detect any other line apart from those of Taurus. If the object is associated with dust and gas, it should be a young stellar object (most likely in the Class II/III phase) or an evolved star. However, the centimetre emission for Class II/III objects is typically due to non-thermal gyrosynchrotron emission, which is not resolved (e. g., André et al. 1992, Forbrich et al. 2007) and is polarized, while J041757-B has a flat (thermal) spectral index, is slightly elongated in the southwest-northeast direction, and shows no polarized emission (we checked this in the dataset of 2008 observations and had no detection of polarized emission). In addition, the lack of X-ray emission (no ROSAT detection) is also uncommon for Class II/III objects (e. g., Güdel et al. 2007).
The possibility that J041757 is an evolved stellar object, either a carbon star or a giant, is also considered. Luminous carbon stars are evolved stars with more carbon than oxygen in their atmosphere, characterized by red near-infrared colors and spectra with no H2O (Liebert et al. 2000). The JHK colors for J041757-B match well within the JHK color-color diagrams for these stars (e. g., Quanz et al. 2010). However, we used the magnitude of J041757-B (Barrado et al. 2009) and Table 8 from Quanz et al. (2010) to estimate the distance and find kpc, larger than the currently known extent of our Galaxy. Since the emission in J041757 is resolved in the submillimetre range, such a large distance would imply an unrealistic large size for the envelope of a carbon star of pc. In addition, the carbon star SEDs have the peak at around 12 m, and longwards the flux decreases strongly (e. g., Liebert et al. 2000), which is clearly not the case of J041757-B. Thus, the properties of J041757-B are not fully consistent with being either a Class II/III young stellar object, or an evolved star. In fact, by making use of the data compiled to build the SED (§ 4), and using the VOSA tool as outlined in § 5.1, we found that the J041757-B SED cannot be reproduced with a very extincted photospheric model, providing further support against the galactic background object scenario for J041757-B.
5.2.3 J041757-B: a proto-brown dwarf candidate in Taurus?
Finally, J041757-B could be an embedded object belonging to Taurus. This is strongly suggested by the discovery of a narrow ( arcsec width) stream joining the J041757-NE source and the B211 filament and passing exactly through the position of J041757-B. Since both J041757-NE and the stream are detected at around 7 km s-1 (in N2H+ and/or 13CO), both structures belong to Taurus.
If J041757-B belongs to Taurus, its low luminosity, of (using the values in Table 7), would imply a proto-BD nature (Barrado et al. 2009). This would naturally explain the centimetre emission with a flat spectral index, since flat/positive spectral indices, indicative of thermal free-free emission, are typically observed in young stellar objects due to shocks in the jet (e. g., Anglada et al. 1998; Beltrán et al. 2001; Avila, Rodríguez, & Curiel 2001; Pech et al. 2010; Scaife et al. 2011; Ward-Thompson et al. 2011), and have also been found for Very Low Luminosity Objects (e. g., Shirley et al. 2007, Scaife et al. 2011). In these cases, the gas is ionized in shocks produced by the jet driven by the nascent star, and the centimetre emission is usually elongated along the outflow axis. This would also easily explain the elongation seen at both 6 and 3.6 cm for J041757-B. And interestingly, the 12CO(1–0) excess detected between 2 and 4 km s-1 is reminiscent of wings observed in outflows driven by low-mass young stellar objects. In addition, if J041757-B is a proto-BD, its bolometric luminosity and centimetre luminosity match well the relation found for young stellar objects driving radiojets, proposed first by Anglada (1995). Following the recent correlations of Shirley et al. (2007) and Scaife et al. (2011) for the low-mass case, the expected centimetre luminosity, given the bolometric luminosity of J041757-B, is 0.0002–0.007 mJy kpc2, consistent with the measured centimetre luminosity of mJy kpc2. Last, if J041757-B belongs to Taurus, the properties of the extended envelope where the NIR source is embedded, of about AU of radius and about , coincide with the extrapolation of the trend presented by Kauffmann et al. (2008) in a radius versus mass diagram for small c2d Spitzer cores (see Fig. 4a of Kauffmann et al. 2008), and more recently by Sadavoy et al. (2010) and Schmalzl et al. (2010) for the Taurus region.
Thus, if J041757-B belongs to Taurus, its properties can naturally be explained simply as a scaled-down version of low-mass young stellar objects.
5.3 On the nature of J041757-NE: a pre-substellar core?
J041757-NE is the strongest submillimetre source detected in the field of J041757 with the CSO, and has been confirmed by APEX, IRAM 30m, and Herschel images. This source is clearly associated with Taurus, as shown by the N2H+ and 13CO emission detected at 7 km s-1 (Figs. 4 and 5). Since we estimated a total mass (compact+extended emission) for J041757-NE of (§ 3.2), and no point IR source (up to 24 m) has been found associated with the submillimetre peak, J041757-NE could be harboring a true pre-substellar core, i.e., a starless core which will form a BD in the future. A first requisite for this to happen is that the submillimetre source should be gravitationally bound. Given the linewidth measured from the N2H+(1–0) hyperfine fit (§ 3.2.3), and an average radius of 10 arcsec (Table 4), we estimate a gravitational mass of 140 (following equation 4 of Pound & Blitz 1993), similar to the total mass measured for J041757-NE, suggesting that J041757-NE might be indeed a pre-substellar core. Interestingly, its total mass and radius follow the correlation found between mass and radius for protostellar/pre-stellar cores (e. g., Kauffmann et al. 2008, Sadavoy et al. 2010; Schmalzl et al. 2010). Also, the fact that this pre-substellar core candidate is found in B211, the portion of L1495 with smaller number of young stellar objects (e. g., Schmalzl et al. 2010) supports the idea suggested by Schmalzl et al. (2010) that this region is at the very beginning of the star (or BD) formation process.
The number of pre-substellar core candidates in the literature is very scarce.
A pioneer study searching for pre-substellar cores and proto-BDs was carried out by Pound & Blitz (1993, 1995), who
found about 4 cores with substellar masses in the Taurus and Ophiucus clouds. However, the cores were at the detection limit and all but one were not gravitationally bound. In addition, the authors indicate that the candidate objects should be re-observed deeply to rule out the possibility that the cores extend considerably, making them massive enough to overcome the substellar domain.
More recent studies in Gould Belt clouds report samples of starless and pre-stellar cores, with some of them being substellar, but lack the kinematical information required to assess if they are gravitationally bound (e. g., Ward-Thompson et al. 2007; Davis et al. 2010; Sadavoy et al. 2010).
Thus, J041757-NE is an excellent pre-substellar core candidate, and high angular resolution millimetre observations would be extremely useful to study possible infall motions within the core, which would definitely indicate that the object is on the way to form a BD.
6 Conclusions
We present the results of a multiwavelength search for pre-substellar cores and proto-BD candidates in the B213-L1495 clouds of Taurus. The studied sample of 12 candidates, selected from Spitzer/IRAC photometry of the region (Barrado et al. 2009), was observed at 1.2 mm with the IRAM 30m/MAMBO-II bolometer. The two most promising objects, J042118 and J041757, were subsequently observed at 350 m with the CSO. Additional observations were performed toward J041757, to further constrain its nature. Our main conclusions can be summarized as follows:
-
(i)
None of the 12 Spitzer/IRAC selected sources observed with IRAM 30m/MAMBO-II were detected at a level , and two sources, J042118 and J041757 had fluxes at the level. We set upper limits to the envelope masses of .
-
(ii)
CSO 350 m observations towards J042118 reveal one compact submillimetre source associated with the selected Spitzer/IRAC source, with a size of arcsec AU (at the Taurus distance), and a mass of . A preliminar analysis of the Spectral Energy Distribution indicates a luminosity of about 0.002 , and a bolometric temperature around 140 K, typical of Class I/II young stellar objects.
-
(iii)
CSO 350 m observations towards J041757 reveal one extended source associated with the selected Spitzer/IRAC source, of about arcsec or AU of size, and a mass of . Additionally, we detect one sligthly resolved source at 3.6 and 6 cm exactly at the position of the infrared counterpart ‘B’ of J041757, called J041757-B, with a flat spectral index. J041757-B is found at the centre of a stream of dust and gas, extending from the B211 main filament to the northeast, mainly detected with 13CO(1–0) at a velocity of km s-1. N2H+(1–0) emission is detected at the same velocity at 5 towards J041757-B. All this seems to indicate that J041757-B is probably a proto-BD in the Class 0/I stage associated with a radiojet and an extended envelope, whose properties seem to be a scaled-down version of low-mass protostars.
-
(iv)
We discovered a partially extended submillimetre source about 40 arcsec to the northeast of J041757-B, of 20 arcsec AU of size and total mass of , called J041757-NE, and with no centimetre emission neither optical/infrared (up to 24 m) emission associated. This indicates that J041757-NE seems to be starless. J041757-NE is well detected in 13CO and N2H+, and is found also at km s-1. With the measured linewidth of N2H+, and its measured size and mass, we conclude that J041757-NE is likely gravitationally bound and thus is a good pre-substellar core candidate.
Overall, this work shows the power of submillimetre instruments to trace extremely low masses and thus to reveal substellar objects. We found evidence of two proto-BD candidates and one pre-substellar core candidate which have scaled-down properties of low-mass young stellar objects and which are embedded in large-scale structures, all this favoring the in-situ scenario for BD formation in this portion of the Taurus complex.
Acknowledgments
We thank the referee, Thomas Henning, for key comments and suggestions. A.P. is grateful to Attila Kovacs, Stephane Leon, Robert Zylka, and Jean-François Lestrade for useful suggestions and help regarding the reduction of the CSO and IRAM 30 m data, and to Álvaro Hacar, Mario Tafalla, Benjamín Montesinos, Rosario López, María Rosa Zapatero-Osorio, Almudena Alonso, Giovanni Miniutti, Tommy Wiklind, and Violeta González for insightful discussions. A.P. and N.H. are grateful to Catarina Alves de Oliveira, Florian Rodler, Markus Schmalzl, and Darren Dowel for kindly providing data for comparison, and D.B. is grateful to Manuel Güdel for checking that the targets of this work have not been observed with Chandra and XMM. We thank Calar Alto Observatory and IRAM 30 m Telescope for allocation of director’s discretionary time to this programme. A.P. and I.dG-M are supported by the Spanish MICINN grant AYA2008-06189-C03 (co-funded with FEDER funds) and A.P. is also supported by a JAE-Doc CSIC fellowship co-funded with the European Social Fund under the program ”Junta para la Ampliación de Estudios”. This research has been partially funded by Spanish MICINN under the Consolider-CSD2006-00070, AYA2010-21161-C02-02, and PRICIT-S2009/ESP-1496 grants, and by the Marie Curie Actions of the European Commission (FP7-COFUND). This publication makes use of VOSA, developed under the Spanish Virtual Observatory project supported from the Spanish MICINN through grant AyA2008-02156; of the SIMBAD database, operated at CDS, Strasbourg, France; of data products from the Wide-field Infrared Survey Explorer, which is a joint project of the University of California, Los Angeles, and the Jet Propulsion Laboratory/California Institute of Technology, funded by the National Aeronautics and Space Administration. Some of the data reported in this paper were obtained as part of the United Kingdom Infrared Telescope (UKIRT) Service Programme. The UKIRT is operated by the Joint Astronomy Centre on behalf of the Science and Technology Facilities Council of the U.K. Social Fund.
References
- [\citeauthoryearAllard2009] Allard F., 2009, A&A, 500, 93
- [\citeauthoryearAllard et al.1997] Allard F., Hauschildt P. H., Alexander D. R., Starrfield S., 1997, ARA&A, 35, 137
- [\citeauthoryearAllard et al.2003] Allard F., Guillot T., Ludwig H.-G., Hauschildt P. H., Schweitzer A., Alexander D. R., Ferguson J. W., 2003, IAUS, 211, 325
- [\citeauthoryearAllard et al.2007] Allard F., Allard N. F., Homeier D., Kielkopf J., McCaughrean M. J., Spiegelman F., 2007, A&A, 474, L21
- [\citeauthoryearAllen et al.2004] Allen L. E., et al., 2004, ApJS, 154, 363
- [\citeauthoryearAnderson et al.2003] Anderson S. F., et al., 2003, AJ, 126, 2209
- [\citeauthoryearAndre et al.1992] André P., Deeney B. D., Phillips R. B., Lestrade J.-F., 1992, ApJ, 401, 667
- [\citeauthoryearAndre, Ward-Thompson, & Barsony1993] André P., Ward-Thompson D., Barsony M., 1993, ApJ, 406, 122
- [\citeauthoryearAndré, Motte, & Bacmann1999] André P., Motte F., Bacmann A., 1999, ApJ, 513, L57
- [\citeauthoryearAndré et al.2010] André P. et al., 2010, A&A, 518, L102
- [\citeauthoryearAnglada1995] Anglada G., 1995, RMxAC, 1, 67
- [\citeauthoryearAnglada et al.1998] Anglada G., Villuendas E., Estalella R., Beltrán M. T., Rodríguez L. F., Torrelles J. M., Curiel S., 1998, AJ, 116, 2953
- [\citeauthoryearApai et al.2005] Apai D., Tóth L. V., Henning T., Vavrek R., Kovács Z., Lemke D., 2005, A&A, 433, L33
- [\citeauthoryearAvila, Rodríguez, & Curiel2001] Avila R., Rodríguez L. F., Curiel S., 2001, RMxAA, 37, 201
- [Baraffe et al.(1997)] Baraffe, I., Chabrier, G., Allard, F., Hauschildt, P. H. 1997, A&A, 327, 1054
- [Baraffe et al.(1998)] Baraffe, I., Chabrier, G., Allard, F., Hauschildt, P. 1998, VizieR Online Data Catalog, 333, 70403
- [Barrado y Navascués Martín(2003)] Barrado y Navascués, D., & Martín, E. L. 2003, AJ, 126, 2997
- [\citeauthoryearBarrado y Navascués, Mohanty, Jayawardhana2004] Barrado y Navascués D., Mohanty S., Jayawardhana R., 2004, ApJ, 604, 284
- [\citeauthoryearBarrado y Navascués et al.2007] Barrado y Navascués D., et al., 2007, ApJ, 664, 481
- [\citeauthoryearBarrado et al.2009] Barrado D., et al., 2009, A&A, 508, 859
- [] Basu, S., Vorobyov, E. I. 2012, preprint (astroph/1203.0274)
- [] Bayo, A., Rodrigo, C., Barrado y Navascués, D., Solano, E., Gutiérrez, R., Morales-Calderón, M., Allard, F. 2008, A&A, 492, 277
- [] Beltrán, M. T., Estalella, R., Anglada, G., Rodríguez, L. F., Torrelles, J. M. 2001, AJ, 121, 1556
- [] Bourke, T. L., et al. 2005, ApJ, 633, L129
- [\citeauthoryearBouy et al.2009] Bouy H., et al., 2009, A&A, 504, 199
- [] Cambresy, L., Epchtein, N., Copet, E., de Batz, B., Kimeswenger, S., Le Bertre, T., Rouan, D., Tiphene, D. 1997, A&A, 324, 5
- [\citeauthoryearCarter et al.2012] Carter M., et al., 2012, A&A, 538, A89
- [Castelli et al.(1997)] Castelli, F., Gratton, R. G., Kurucz, R. L. 1997, A&A, 318, 841
- [Chabrier et al.(2000)] Chabrier, G., Baraffe, I., Allard, F., Hauschildt, P. 2000, ApJ, 542, 464
- [] Chen, H., Myers, P. C., Ladd, E. F., Wood, D. O. S. 1995, ApJ, 445, 377
- [Davis et al.(2010)] Davis, C. J., Chrysostomou, A., Hatchell, J., et al. 2010, MNRAS, 405, 759
- [\citeauthoryeardi Francesco et al.2007] di Francesco J., Evans N. J., II, Caselli P., Myers P. C., Shirley Y., Aikawa Y., Tafalla M., 2007, in Reipurth B., Jewitt D., Keil K., eds., Protostarls & Planets V. Univ. Arizona Press, Tucson, p. 17
- [] di Francesco, J., Johnstone, D., Kirk, H. M., MacKenzie, T. & Ledwosinska, E. 2008, ApJS, 175, 277
- [Dunham et al.(2008)] Dunham, M. M., Crapsi, A., Evans, N. J., II, et al. 2008, ApJS, 179, 249
- [Dunham et al.(2010)] Dunham, M. M., Evans, N. J., Bourke, T. L., et al. 2010, ApJ, 721, 995
- [\citeauthoryearElvis et al.1994] Elvis M., et al., 1994, ApJS, 95, 1
- [\citeauthoryearFernández Comerón2001] Fernández M., Comerón F., 2001, A&A, 380, 264
- [\citeauthoryearFitzpatrick1999] Fitzpatrick E. L., 1999, PASP, 111, 63
- [] Forbrich, J., Massi, M., Ros, E., Brunthaler, A., Menten, K. M. 2007, A&A, 469, 985
- [] Frerking, Langer, Wilson 1982, ApJ, 262, 590
- [Froebrich(2005)] Froebrich, D. 2005, ApJS, 156, 169
- [\citeauthoryearGandhi et al.2009] Gandhi P., Horst H., Smette A., Hönig S., Comastri A., Gilli R., Vignali C., Duschl W., 2009, A&A, 502, 457
- [Giroletti Panessa(2009)] Giroletti, M., Panessa, F. 2009, ApJ, 706, L260
- [Goldsmith et al.(2008)] Goldsmith, P. F., Heyer, M., Narayanan, G., et al. 2008, ApJ, 680, 428
- [\citeauthoryearGoulding Alexander2009] Goulding A. D., Alexander D. M., 2009, MNRAS, 398, 1165
- [] Greaves, J. S., Holland, W. S., Pound, M. W. 2003, MNRAS, 346, 441
- [] Güdel, M., Briggs, K. R., Arzner, K., Audard, M., Bouvier, J., et al. 2007, A&A, 468, 353
- [Harvey et al.(2006)] Harvey, P. M., Chapman, N., Lai, S.-P., et al. 2006, ApJ, 644, 307
- [\citeauthoryearHarvey et al.2010] Harvey P. M., Jaffe D. T., Allers K., Liu M., 2010, ApJ, 720, 1374
- [\citeauthoryearHarvey et al.2012] Harvey P. M., et al., 2012, ApJ, 744, L1
- [] Hauck, B., Mermilliod, M. 1998, A&AS, 129, 431
- [] Hauschildt, P. H., Allard, F., Baron, E. 1999, ApJ, 512, 377
- [Hewett et al.(2006)] Hewett, P. C., Warren, S. J., Leggett, S. K., Hodgkin, S. T. 2006, MNRAS, 367, 454
- [Heyer et al.(1987)] Heyer, M. H., Snell, R. L., Goldsmith, P. F., Myers, P. C. 1987, ApJ, 321, 370
- [] Ibar, E., Ivison, R. J., Biggs, A. D., Lal, D. V., Best, P. N., Green, D. A. 2009, MNRAS, 397, 281
- [\citeauthoryearIndebetouw et al.2005] Indebetouw R., et al., 2005, ApJ, 619, 931
- [Jayawardhana & Ivanov(2006)] Jayawardhana, R., Ivanov, V. D. 2006a, ApJ, 647, L167
- [Jayawardhana et al.(2006)] Jayawardhana, R., Coffey, J., Scholz, A., Brandeker, A., van Kerkwijk, M. H. 2006b, ApJ, 648, 1206
- [] Joergens, V., Pohl, A., Sicilia-Aguilar, A., Henning, Th. 2012, A&A, preprint (arXiv:1205.3166)
- [Jørgensen et al.(2006)] Jørgensen, J. K., Harvey, P. M., Evans, N. J., II, et al. 2006, ApJ, 645, 1246
- [Kauffmann et al.(2005)] Kauffmann, J., Bertoldi, F., Evans, N. J., II, the C2D Collaboration 2005, Astronomische Nachrichten, 326, 878
- [Kauffmann et al.(2008)] Kauffmann, J., Bertoldi, F., Bourke, T. L., Evans, N. J., II, Lee, C. W. 2008, A&A, 487, 993
- [Kauffmann et al.(2011)] Kauffmann, J., Bertoldi, F., Bourke, T. L., et al. 2011, MNRAS, 416, 2341
- [Kellermann et al.(1989)] Kellermann, K. I., Sramek, R., Schmidt, M., Shaffer, D. B., Green, R. 1989, AJ, 98, 1195
- [\citeauthoryearKenyon & Hartmann1995] Kenyon S. J., Hartmann L., 1995, ApJS, 101, 117
- [Klein et al.(2003)] Klein, R., Apai, D., Pascucci, I., Henning, T., Waters, L. B. F. M. 2003, ApJ, 593, L57
- [] Kovács, A., 2008, Proc. SPIE, 7020, 45
- [] Lee, C. W., et al. 2009, ApJ, 693, 1290
- [] Lee, J.-E. 2007, JKAS, 40, 83
- [] Liebert, J., Cutri, R. M., Nelson, B., Kirkpatrick, J. D., Gizis, J. E., Reid, I. N. 2000, PASP, 112, 1315
- [Lucas et al.(2008)] Lucas, P. W., Hoare, M. G., Longmore, A., et al. 2008, MNRAS, 391, 136
- [Luhman & Mamajek(2010)] Luhman, K. L., Mamajek, E. E. 2010, ApJ, 716, L120
- [\citeauthoryearLuhman, Liebert, Rieke1997] Luhman K. L., Liebert J., Rieke G. H., 1997, ApJ, 489, L165
- [Luhman et al.(2005)] Luhman, K. L., Adame, L., D’Alessio, P., et al. 2005, ApJ, 635, L93
- [Luhman et al.(2007)] Luhman, K. L. et al. 2007, ApJ, 666, 1219
- [Luhman et al.(2008)] Luhman, K. L., Hernández, J., Downes, J. J., Hartmann, L., Briceño, C. 2008, ApJ, 688, 362
- [Luhman et al.(2010)] Luhman, K. L., Allen, P. R., Espaillat, C., Hartmann, L., Calvet, N. 2010, ApJS, 186, 111
- [\citeauthoryearMermilliod & Mermilliod1994] Mermilliod J.-C., & Mermilliod M. 1994, Catalogue of Mean UBV Data on Stars, VI, Mermilliod, J.-C. & Mermilliod, M. eds., 1387 pp.. Springer-Verlag Berlin Heidelberg New York
- [] Mizuno, A., Onishi, T., Yonekura, Y. et al. 1995, ApJ, 445, L161
- [\citeauthoryearMohanty, Jayawardhana, & Basri2005] Mohanty S., Jayawardhana R., Basri G., 2005, ApJ, 626, 498
- [\citeauthoryearMonin et al.2010] Monin J.-L., et al., 2010, A&A, 515, A91
- [Narayanan et al.(2008)] Narayanan, G., Heyer, M. H., Brunt, C., et al. 2008, ApJS, 177, 341
- [\citeauthoryearNatta et al.2004] Natta A., Testi L., Muzerolle J., Randich S., Comerón F., Persi P., 2004, A&A, 424, 603
- [Ossenkopf & Henning(1994)] Ossenkopf, V. & Henning, T. 1994, A&A, 291, 943
- [Padoan & Nordlund(2004)] Padoan, P., & Nordlund, Å. 2004, ApJ, 617, 559
- [Pascucci et al.(2003)] Pascucci, I., Apai, D., Henning, T., & Dullemond, C. P. 2003, ApJ, 590, L111
- [Pech et al.(2010)] Pech, G., Loinard, L., Chandler, C. J., et al. 2010, ApJ, 712, 1403
- [Phan-Bao et al.(2008)] Phan-Bao, N., Riaz, B., Lee, C.-F., et al. 2008, ApJ, 689, L141
- [] Pirogov, L., Zinchenko, I., Caselli, P., Johansson, L. E. B., & Myers, P. C. 2003, A&A, 405, 639
- [] Pound, M. W., & Blitz, L. 1993, ApJ, 418, 328
- [] Pound, M. W., & Blitz, L. 1995, ApJ, 444, 270
- [] Quanz, S. P., Goldman, B., Henning, T., Brandner, W., Burrows, A., Hofstetter, L. W. 2010, ApJ, 708, 770
- [\citeauthoryearRandall et al.2012] Randall K. E., Hopkins A. M., Norris R. P., Zinn P.-C., Middelberg E., Mao M. Y., Sharp R. G., 2012, MNRAS, 421, 1644
- [Reipurth & Clarke(2001)] Reipurth, B., & Clarke, C. 2001, AJ, 122, 432
- [\citeauthoryearRiaz et al.2012] Riaz B., Lodato G., Stamatellos D., Gizis J. E., 2012a, MNRAS, 422, L6
- [Riaz et al.(2012)] Riaz, B., Lodieu, N., Goodwin, S., Stamatellos, D., & Thompson, M. 2012b, MNRAS, 420, 2497
- [Rice et al.(2003)] Rice, W. K. M., Armitage, P. J., Bonnell, I. A., et al. 2003, MNRAS, 346, L36
- [\citeauthoryearRoussel2012] Roussel H., 2012, preprint (arXiv:1205.2576)
- [Sadavoy et al.(2010)] Sadavoy, S. I., Di Francesco, J., Bontemps, S., et al. 2010, ApJ, 710, 1247
- [] Scaife, A. M. M., Hatchell, J., Davies, M., Franzen, T. M. O., Grainge, K. J. B. et al. 2011, MNRAS, 415, 893
- [\citeauthoryearSchmalzl et al.2010] Schmalzl M., et al., 2010, ApJ, 725, 1327
- [] Scholz, A., Jayawardhana, R., Wood, K. 2006, ApJ, 645, 1498
- [\citeauthoryearScholz et al.2008] Scholz A., Jayawardhana R., Wood K., Lafrenière D., Schreyer K., Doyon R., 2008, ApJ, 681, L29
- [Shang et al.(2011)] Shang, Z., Brotherton, M. S., Wills, B. J., et al. 2011, ApJS, 196, 2
- [Shirley et al.(2007)] Shirley, Y. L., Claussen, M. J., Bourke, T. L., Young, C. H., & Blake, G. A. 2007, ApJ, 667, 329
- [\citeauthoryearSkrutskie et al.2006] Skrutskie M. F., et al., 2006, AJ, 131, 1163
- [] Stamatellos, D., & Whitworth, A. P. 2009, MNRAS, 392, 413
- [Tafalla et al.(2004)] Tafalla, M., Myers, P. C., Caselli, P., & Walmsley, C. M. 2004, A&A, 416, 191
- [\citeauthoryearUmbreit et al.2005] Umbreit S., Burkert A., Henning T., Mikkola S., Spurzem R., 2005, ApJ, 623, 940
- [Voges et al.(1999)] Voges, W., Aschenbach, B., Boller, T., et al. 1999, A&A, 349, 389
- [Ward-Thompson et al.(2007)] Ward-Thompson, D., Di Francesco, J., Hatchell, J., et al. 2007, PASP, 119, 855
- [Ward-Thompson et al.(2011)] Ward-Thompson, D., Kirk, J. M., Greaves, J. S., & André, P. 2011, MNRAS, 415, 2812
- [White et al.(1999)] White, R. J., Ghez, A. M., Reid, I. N., & Schultz, G. 1999, ApJ, 520, 811
- [\citeauthoryearWhitworth & Zinnecker2004] Whitworth A. P., Zinnecker H., 2004, A&A, 427, 299
- [] Young, C. H., et al. 2004, ApJS, 154, 396
Appendix A Photometry for J042118 and J041757-B
In this Appendix we give the photometry for J042118 and J041757-B, from visible wavelengths up to the upper limit set at 1.2 mm with MAMBO-II. To compile the photometry we used the Virtual Observatory Spectral Energy Distribution Analyser (VOSA, Bayo et al. 2008). See Hewett et al. (2006) and Lucas et al. (2008) for a review of the United Kingdom Infrared Digital Sky Survey. For the case of J041757-B, we measured again the flux at 24 m to take into account extended emission (neglected in our previous measurement given in Barrado et al. 2009).
| (m) | (mJy) | (mJy) | Instrument |
| 0.89 | - | SDSS-z | |
| 1.03 | - | UKIDSS-Y | |
| 1.25 | 0.0165 | 0.0003 | UKIDSS-J |
| 2.20 | 0.0453 | 0.0009 | UKIDSS-K |
| 3.4 | 0.196 | 0.010 | WISE |
| 3.6 | 0.249 | 0.004 | Spitzer/IRAC |
| 4.5 | 0.439 | 0.006 | Spitzer/IRAC |
| 4.6 | 0.435 | 0.023 | WISE |
| 5.8 | 0.674 | 0.010 | Spitzer/IRAC |
| 8.0 | 1.093 | 0.016 | Spitzer/IRAC |
| 12 | 1.13 | 0.33 | WISE |
| 24 | 2.73 | 0.07 | Spitzer/MIPS |
| 70 | Spitzer/MIPS | ||
| 350 | 46 | 9 | CSO |
| 1200 | IRAM 30 m |
| (m) | (mJy) | (mJy) | Instrument |
| 0.75 | 0.0034 | 0.0001 | CFHT-i |
| 0.90 | 0.0077 | 0.0002 | CFHT-z |
| 1.03 | - | UKIDSS-Y | |
| 1.25 | 0.0360 | 0.0006 | CAHA-J |
| 1.65 | 0.0680 | 0.0012 | CAHA-H |
| 2.17 | 0.127 | 0.002 | CAHA-K |
| 3.6 | 0.295 | 0.008 | Spitzer/IRAC |
| 4.5 | 0.441 | 0.009 | Spitzer/IRAC |
| 5.8 | 0.491 | 0.010 | Spitzer/IRAC |
| 8.0 | 0.736 | 0.011 | Spitzer/IRAC |
| 12 | 1.79 | 0.15 | WISE |
| 22 | 6.5 | 1.0 | WISE |
| 24 | 7.5 | 1.0 | Spitzer/MIPS |
| 70 | Spitzer/MIPS | ||
| 350 | 165 | 9 | CSO |
| 870 | APEX | ||
| 1200 | IRAM 30 m | ||
| 36000 | 0.19 | 0.11 | VLA |
| 60000 | 0.20 | 0.05 | VLA |