Heavy Flavour Production at TeV
The measurements of b quark, quarkonium and exotic state production performed with the ATLAS and CMS experiments at TeV are presented. The b-quark production cross section is measured both in inclusive and fully reconstructed B hadron decays. The results are compared with QCD expectations at tree-level and NLO.
1 Introduction
The data analyzed for the presented results were collected by the multi-purpose experiments ATLAS and CMS at the LHC, which provides since Spring 2010 proton-proton collisions at = 7 TeV. The collected luminosity by each experiment was close to 40 pb-1 in 2010 and 5 fb-1 in 2011.
The study of heavy quark production cross section in high-energy hadronic interactions plays a critical role as precision tests of next-to-leading order (NLO) Quantum Chromodynamics (QCD) calculations at a higher energy scale than before. Measurements of b-hadron production at the higher energies provided by the Large Hadron Collider (LHC), which are possible thanks to the large cross section at = 7 TeV, represent an important test of theoretical calculations . In addition, a good understanding of b-quark production is necessary, since it is an important background to several other analyses, i.e. top quark physics, Higgs or Supersymmetry searches, etc. These measurements also serve as a validation of the tracking and muon systems.
Both experiments have produced several results on several heavy flavor production subjects, which can be divided in the following three categories: quarkonium production, exclusive heavy flavor hadron cross-section measurements and inclusive b cross-section measurements using b-tagged jets or muons. The latest results on each category will be presented here.
2 Observation of the (3P)
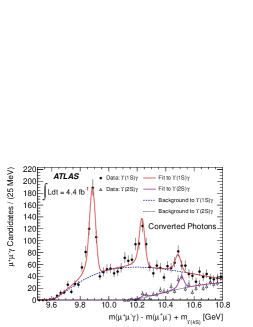
The mesons are the P-wave function excitation of b quark system. They decay radiating a photon into the (1S) or the (2S). These mesons can appear in different spin projections, resulting in a hyperfine splitting of the spectrum. The ATLAS experiment has analyzed the whole 2011 data sample reconstructing , and matching them to either calorimeter reconstructed photons or converted photons, from the e+e- tracks reconstructed in the tracker. Calorimeter photons can be reconstructed more efficiently than converted photons, but in addition to the fact that the converted photons allow the reconstruction of lower energy photons, they also have better energy resolution than those reconstructed in the calorimeter. The spectrum when using converted photons can be seen in Fig. 1, where the right-most peak corresponds to a never observed before state: the (3P). The spectrum is fitted to crystal ball functions for the signal peaks, including the hyperfine mass splitting structure predicted by Ref. , and an empirical function for the background. The (3P) peak significance is larger than 6 standard deviations and the measured mass barycenter is 10.530 0.005 (stat.) 0.009 (syst.) GeV .
3 production cross section
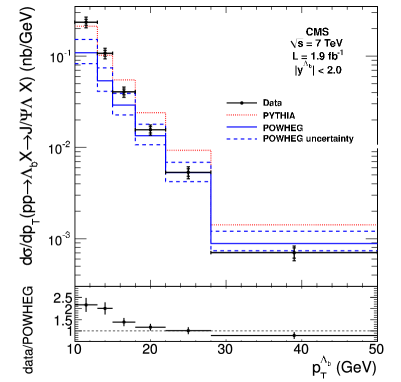
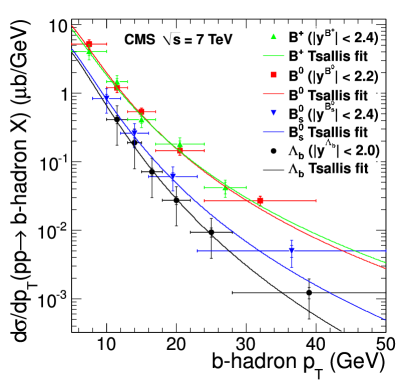
CMS has measured the baryon production differential cross section in transverse momentum (pT) and rapidity () using the decay chain , J/, and with 1.9 fb-1 of the 2011 data sample. As seen in Fig. 2 (left), the measured differential cross section shows a steeper slope than the Monte Carlo (MC) predictions. The production ratio between and is also measured and no significant deviations from theory are found over the measured pT and ranges. In Fig. 2 (right) this result is compared to the differential cross sections of the B+, B0 and Bs, as measured by CMS.
4 Production of heavy flavor with b-jets and with muons
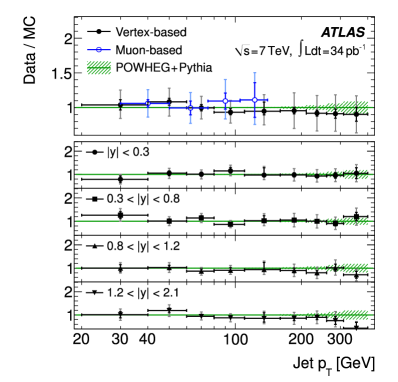
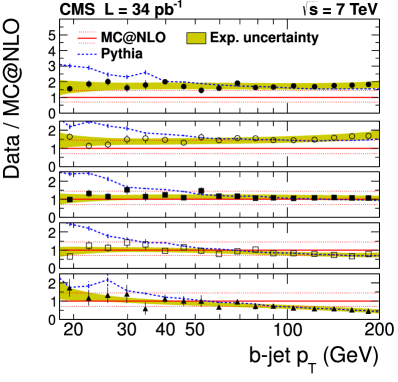
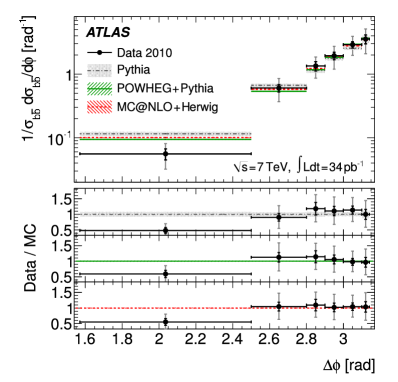
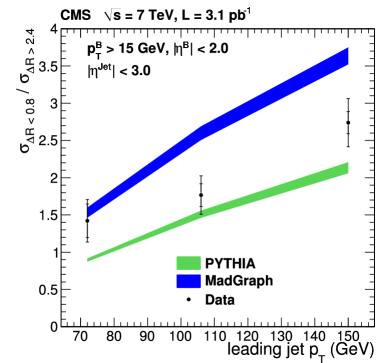
ATLAS and CMS have measured the inclusive beauty cross section for pp collisions at = 7 TeV by means of jets tagged by an algorithm using secondary vertex information with 2010 data . A displaced vertex is a good tag of the presence of a b-quark originated jet. The same measurement has been preformed using muons within the jets. As discriminating variable the transverse momentum relative to the jet axis (”pT rel”) has been used. In both experiments good agreement between the measurement and theory calculations is seen, as shown in Fig. 3, except for some discrepancies at large pT and . The ATLAS result includes a measurement of the di-jet cross section, which also agrees with theory calculations, as seen in 4 (left), except for low azimuthal angles () between the two b-jets. A similar discrepancy, seen in Fig. 4 (right), was observed in a previous CMS result which studied the separation in the (,) plane (R) between the directions of the two b hadrons (BB), found using only information from the tracker.
5 Conclusions
There are many high quality results on heavy flavor production by both ATLAS and CMS. The observation of the new (3P) particle has been presented. The measurement of the exclusive production cross section shows discrepancies with MC predictions. Open heavy flavor production is well described by theory calculations, although some discrepancies with the measurements can be seen at high pT and , and at low di-jet separation angles.
References
References
- [1] ATLAS Collaboration, JINST 3, S08003 (2008)
- [2] CMS Collaboration, JINST 3, S08004 (2008)
- [3] P. Nason, S. Dawson and R.K. Ellis, Nucl. Phys. B 303, 607 (1988).
- [4] M. Cacciari, M. Greco and P. Nason, JHEP 9805, 107 (1998)
- [5] B.A. Kniehl, G. Kramer, I. Schienbein and H. Spiesberger, Phys. Rev. D 77, 014011 (2008)
- [6] L. Motyka and K. Zalewski, Eur. Phys. J. C 4, 107 (1998)
- [7] ATLAS Collaboration, Phys. Rev. Lett. 108, 152001 (2012)
- [8] CMS Collaboration, arXiv:1205.0594 [hep-ex], submitted to Phys. Lett. B (2012)
- [9] ATLAS Collaboration, Eur. Phys. J. C 71, 1846 (2011)
- [10] CMS Collaboration, arXiv:1202.4617v1 [hep-ex] submitted to JHEP (2012)
- [11] CMS Collaboration, JHEP 3, 136 (2011)