11email: nutto@kis.uni-freiburg.de
Revealing the nature of magnetic shadows with numerical 3D-MHD simulations.
Abstract
Aims. We investigate the interaction of magneto-acoustic waves with magnetic network elements with the aim of finding possible signatures of the magnetic shadow phenomenon in the vicinity of network elements.
Methods. We carried out three-dimensional numerical simulations of magneto-acoustic wave propagation in a model solar atmosphere that is threaded by a complexly structured magnetic field, resembling that of a typical magnetic network element and of internetwork regions. High-frequency waves of 10 mHz are excited at the bottom of the simulation domain. On their way through the upper convection zone and through the photosphere and the chromosphere they become perturbed, refracted, and converted into different mode types. We applied a standard Fourier analysis to produce oscillatory power-maps of the line-of-sight velocity.
Results. In the power maps of the upper photosphere and the lower chromosphere, we clearly see the magnetic shadow: a seam of suppressed power surrounding the magnetic network elements. We demonstrate that this shadow is linked to the mode conversion process and that power maps at these height levels show the signature of three different magneto-acoustic wave modes.
Key Words.:
Sun: chromosphere - Sun: magnetic magnetic topology - Sun: oscillations - Magnetic Fields - Magnetohydrodynamics (MHD)1 Introduction
The feature-rich solar chromosphere is one of the most disputed topics in present solar research (Rutten 2012). Debates are fueled by the ever-improving quality of the observations. For instance, high spatial resolution and high temporal cadence observations reveal that oscillations in intensity and Doppler velocities of chromospheric lines are suppressed in the vicinity, but not, or less, directly above quiet-Sun network elements. Judge et al. (2001), using SUMER UV spectral line time-series and TRACE continuum observations, referred to this phenomenon as magnetic shadow “since the network element appears to ‘cast a shadow’ over the neighboring … internetwork region”. These authors offered several explanations for the formation of the magnetic shadow, favoring mode conversion of MHD waves if the plasma- (ratio of thermal to magnetic pressure) was about unity at the formation height of the shadow.
In a subsequent study, McIntosh & Judge (2001) used potential field extrapolations to reconstruct the magnetic field of the observed solar region, from which they concluded that the magnetic shadow is caused by closed magnetic field arches and not by mode conversion of MHD waves, and that the layer is likely located at the heights from which the UV continuum emerges. Krijger et al. (2001) also argued that at the observed height, mode conversion is unlikely to cause the magnetic shadow because this process would only become important at greater heights.
Observations by Vecchio et al. (2007) of the chromospheric spectral line of Ca ii nm, acquired with the Interferometric Bidimensional Spectrometer (IBIS) (Cavallini 2006), most clearly revealed the ring and shadow-like appearance of the suppressed oscillatory power around quiet-Sun magnetic network patches and at frequencies above the acoustic cut-off frequency. More recently, Kontogiannis et al. (2010a) showed similar results from H profiles obtained with the Dutch Open Telescope, revealing ‘the discrete role of the magnetic field … which guides or suppresses the oscillations, depending on its inclination’. Kontogiannis et al. (2010b) complemented this study with a potential magnetic field extrapolation and concluded that the magnetic shadow is associated with the environment.
To shed light on the formation mechanism of the magnetic shadow, we applied detailed three-dimensional MHD simulations of magneto-acoustic waves to a model that shows both magnetic network and internetwork regions, although on a considerably smaller scale than the observations. We followed the simulation approach of Nutto et al. (2012), which allows for the visualiziation of magneto-acoustic waves as they propagate across a complexly structured, dynamic solar atmospheric model. For the terminology used in this paper, we refer the reader to the introductory section of Nutto et al. (2012).
2 The background model
The three-dimensional simulations were carried out with the CO5BOLD-code (Freytag et al. 2012), which solves the magnetohydrodynamic equations for a fully compressible gas including radiative transfer and a realistic equation of state.
2.1 Initial magneto-atmosphere
The employed three-dimensional model extends from the surface layers of the convection zone throughout the photosphere to the middle layers of the magnetically structured chromosphere, corresponding to a height range from km to km, where km is defined by the height of mean optical depth unity, . Rosseland mean opacities are used for the radiation transfer. The horizontal outline of the box is quadratic with the dimensions km by km.
The numerical grid consists of cells in each horizontal direction. In the vertical direction, the grid-cell size gradually decreases from km near the bottom to km in the atmospheric layers. Periodic boundary conditions apply to each horizontal direction, while the bottom and upper boundary are transmittent, allowing acoustic waves to leave the box without major reflection. The boundary conditions force the magnetic field to be vertical at the top and bottom boundaries but allow it to move freely in the horizontal direction.
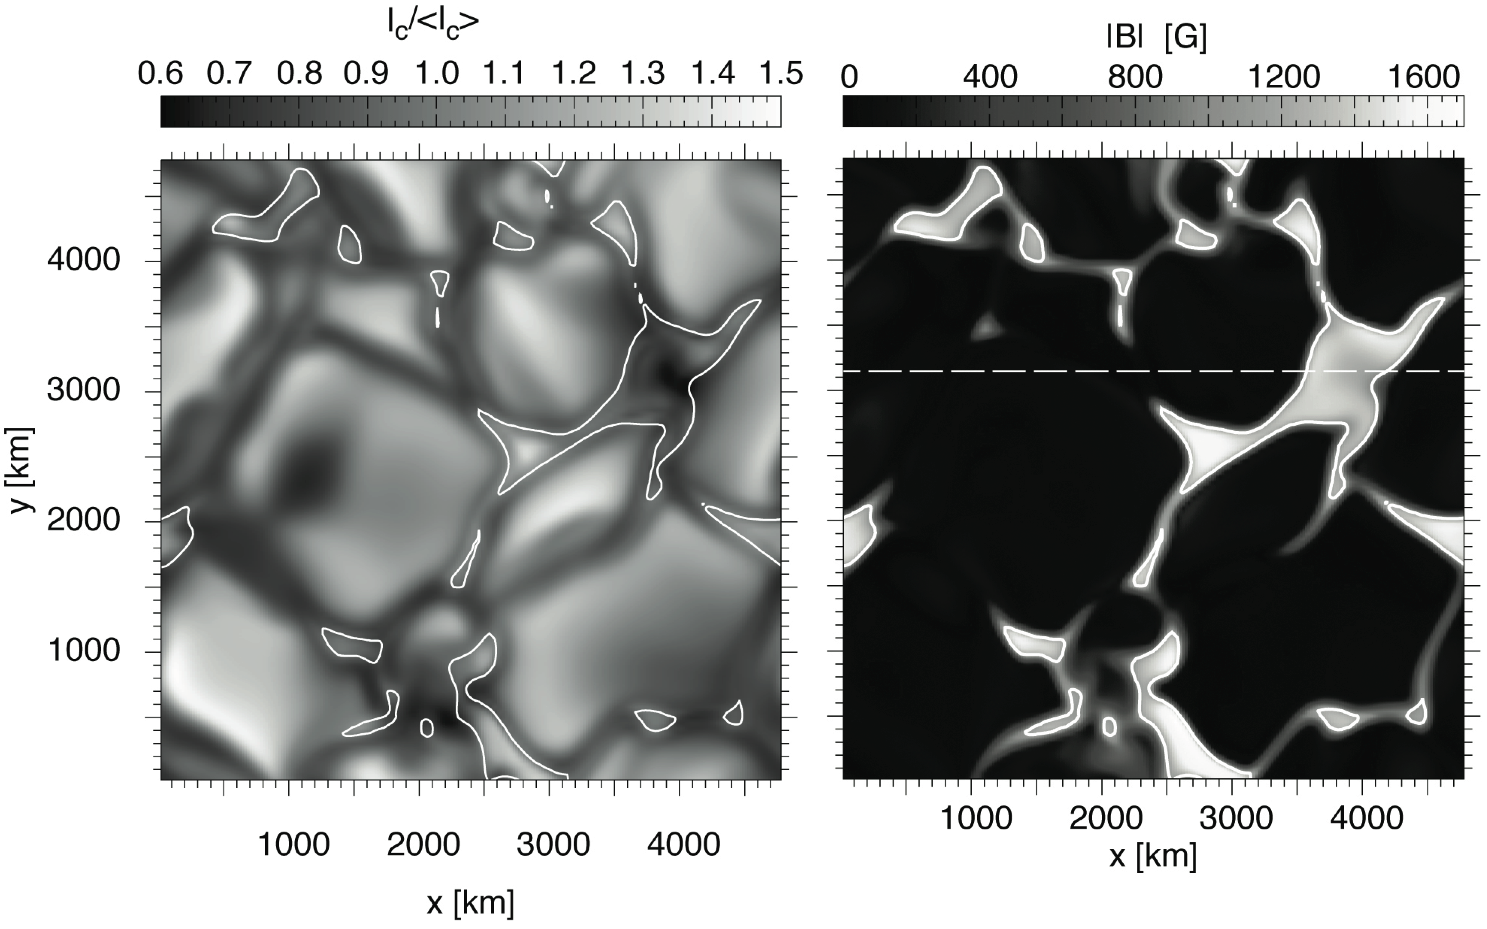
The left panel of Fig. 1 shows the bolometric intensity of the radiation that leaves the box through the top boundary in the vertical direction. It shows the regular granulation pattern of the solar surface and the intergranular lanes. The right panel displays the absolute magnetic field strength of the initial model at the surface layer of .

This initial background model was derived from a simulation that started with a vertically oriented, homogenous magnetic field of a strength of G. Because of the advective motion of the granular cells, the magnetic field is concentrated in the intergranular lanes. In the course of the simulation, a strong flux concentration accumulates in the upper right quadrant of the box, at km. Here, field strengths of up to G are reached inside the flux tube at the surface of . The left half of the box contains a rather weak, horizontally oriented magnetic field that resembles an internetwork region.
2.2 Properties of the time-averaged model
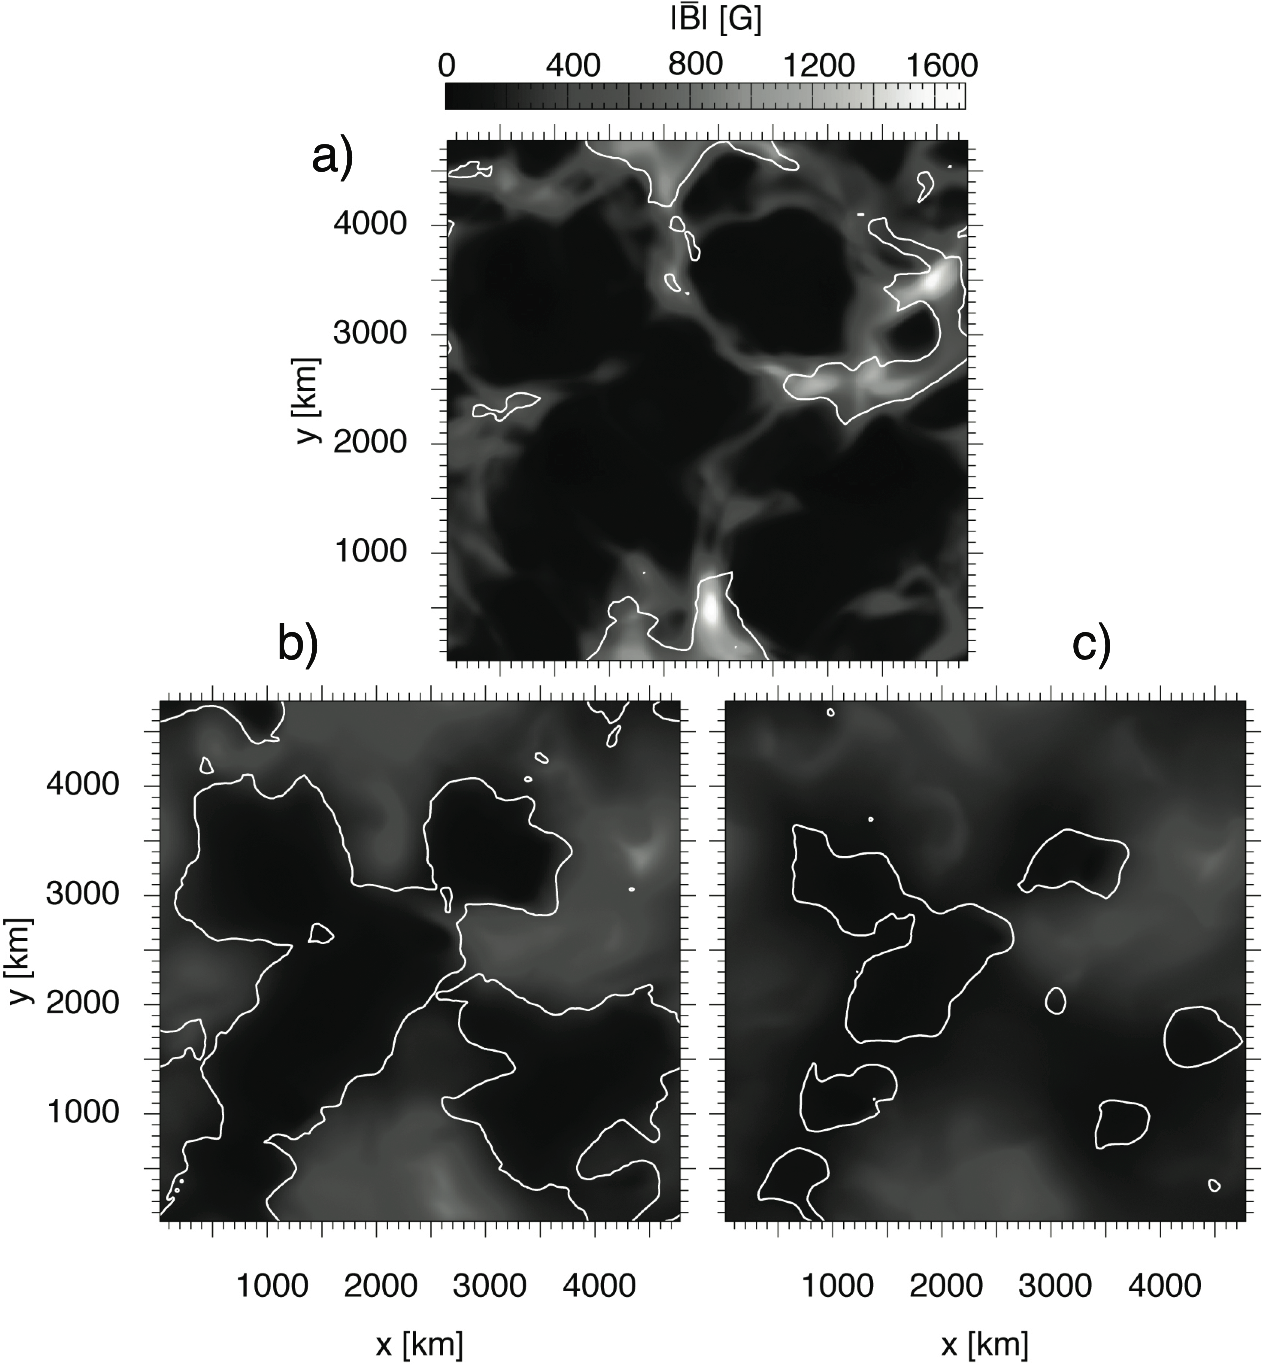
Starting from the initial model, the simulations were advanced for 1250 s. Figure 2 shows the time-averaged (1250 s) magnetic field for different optical depth levels, which is needed for the interpretation of the power maps that derive from the full length of the time series.
The top panel of Fig. 2 displays the time-averaged absolute magnetic field strength, , on the surface of the time-averaged position of optical depth . Compared to the map of the initial model shown in Fig. 1, the time-averaged magnetic field, especially the strong flux concentration, appears diffuse because of its continuous advective motion. Nonetheless, the time average still shows several strong magnetic field concentrations of about G. At the transition to chromospheric levels, at and , the magnetic canopies of several magnetic field concentrations merge and form a magnetically dominated chromosphere (cf. Solanki & Steiner 1990). Below the magnetic canopy, the time-averaged background model contains a fairly weak, horizontally oriented magnetic field, similar to the initial model.

3 Wave propagation
Below, we show snapshots of the wave propagation simulations. We use the subtraction method described by Steiner et al. (2007) for the visualization in which physical quantities of two simulation runs with and without an artificially introduced perturbation are subtracted from each other. Test results for this approach are given in Nutto et al. (2010).
The wave excitation is analogous to the two-dimensional case presented in Nutto et al. (2012), where plane-parallel waves are excited at the lower boundary. The same was performed for the three-dimensional case, except that the wave was now excited along the entire plane of the lower boundary. The applied driver excites monochromatic plane-parallel waves with a frequency of mHz. The waves are continuously excited for the whole duration of the simulation of s. The simulation can only be advanced for a limited amount of time after which the waves become swamped in the background of the residual large-scale velocities (see Nutto et al. 2012). Therefore, we choose the relatively high frequency of mHz to increase the reliability of the analysis for the available limited time period and also for convenient visualization of the waves. One can expect a similar behavior of propagating waves for all frequencies above the acoustic cut-off frequency (Khomenko & Collados 2006), therefore waves with mHz should be a good representation for all waves above the acoustic cut-off frequency of mHz.
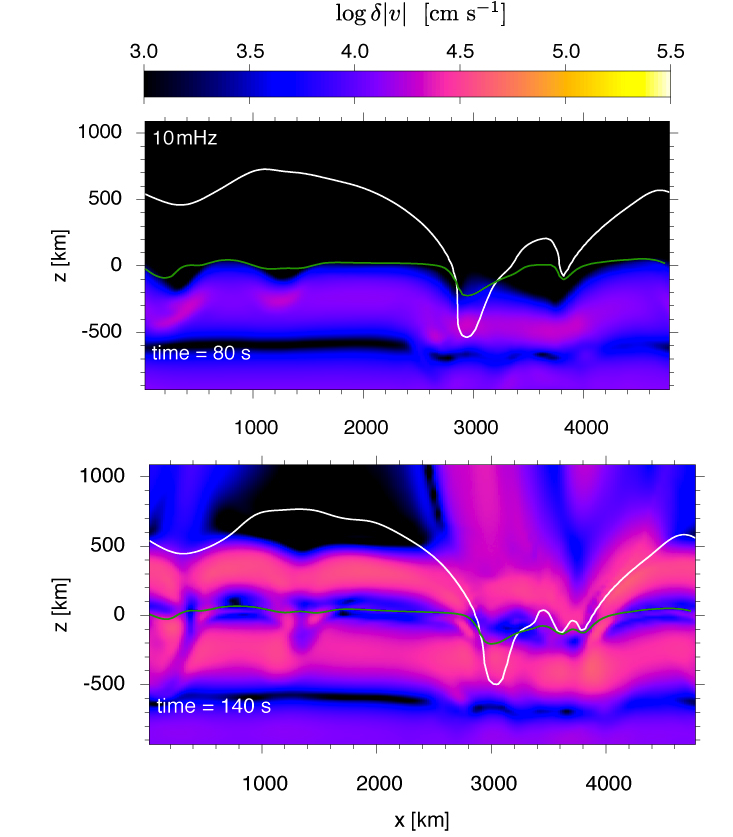
At the bottom of the simulation domain and throughout the simulated portion of the convection zone, we have so that the excited wave is a fast predominantly acoustic mode. The upper panel of Fig. 3 shows the wave as it reaches the solar surface. Mode conversion has not significantly taken place yet, because in the center of the flux tube, the angle between the wave vector and the magnetic field (attack angle) favors the transmission of the acoustic mode (Cally 2007).

In the lower panel of Fig. 3, the wave has traveled through the photosphere and has reached the lower layers of the chromosphere. Clearly, the wave field shows a different propagation behavior inside and outside the magnetic canopy of the flux concentration. Below the magnetic canopy, and hence between the magnetic network elements, the wave propagation is nearly undisturbed. For regions inside the magnetic network elements, viz., above the equipartition level111The equipartition level is defined as the location where the Alfvén and the sound speed are of equal magnitude, , the wave fronts are vertically directed and belong to the fast magnetic mode that is excited because of mode conversion at the equipartition level. Owing to steep gradients of the Alfvén speed in the vertical and horizontal directions, the fast magnetic mode is strongly refracted. In the apex of the refractive path, the fast magnetic mode travels horizontally with the wave front being aligned with the vertical direction.
In the very center of the magnetic flux element and coexistent with the vertical wave fronts of the fast magnetic mode, we see the transmitted slow acoustic mode. Its wave front keeps the horizontal orientation from below and travels vertically upward along the magnetic field lines of the flux concentration, reaching the higher layers of the solar atmosphere much later than the fast mode.
4 Power maps
We restricted our investigation to power maps of the vertical velocity perturbations, , because these can be directly compared to power maps of line-of-sight velocities observed at the center of the solar disk.
The power maps were taken at constant optical depth levels , , and in the atmosphere. The time-averaged positions of these optical depth levels correspond to the geometrical heights km, km, and km. The time series was sampled with a cadence of s. The power of observed Doppler shifts of active regions are usually normalized to regions of the quiet Sun that show the least magnetic activity. In our simulations, where the whole simulation domain is threaded by a magnetic field, we cannot determine a corresponding reference value. Therefore, we normalized the power to the value of the spatially averaged power of each optical depth level.

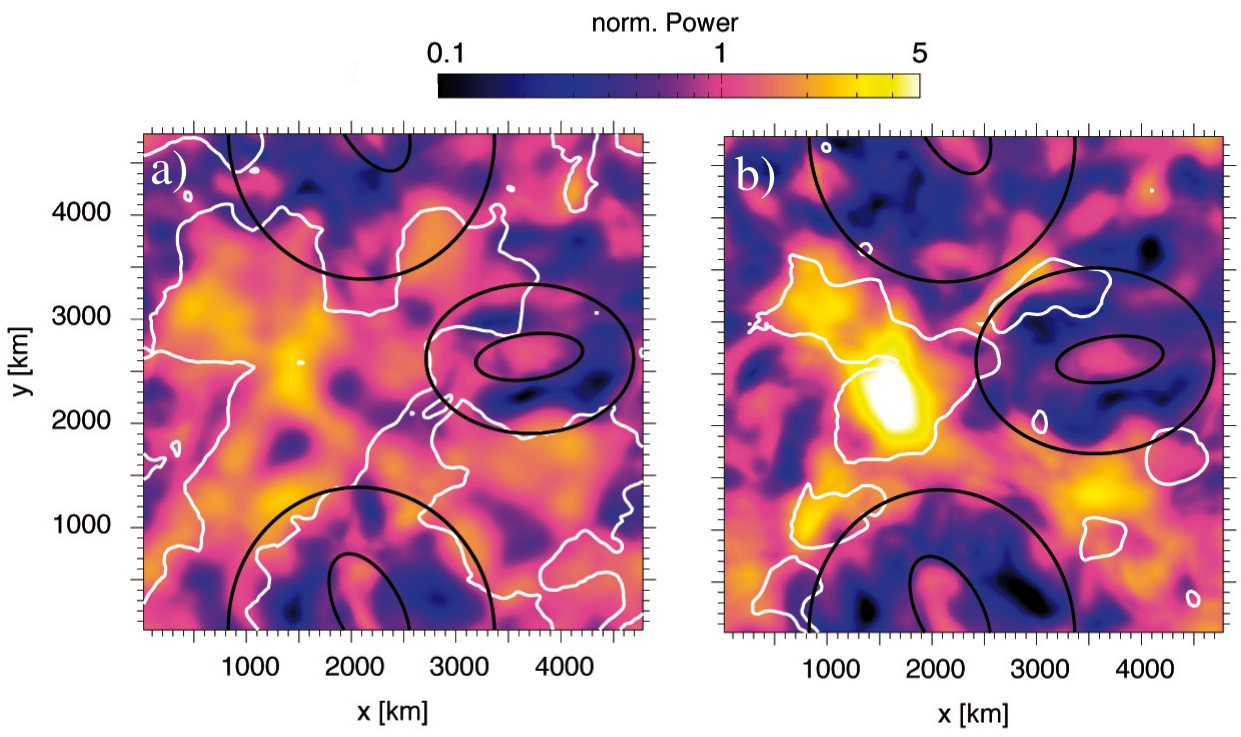
The derived power maps for the upper photosphere, , and the lower chromosphere, , presented in Fig. 4, yield rings of suppressed power (indicated by ellipses) around strong magnetic field elements. These resemble very much the magnetic shadows observed by Vecchio et al. (2007) in the lower chromosphere above magnetic network elements. Three separate regions of different oscillatory strength can be identified. The strongest oscillatory power occurs in the internetwork regions (areas inside the equipartition contour where ), while intermediate power can be found in the very center of the magnetic network elements (inner ellipses). The suppressed oscillatory power, and hence the shadow-like appearance, occurs in the regions between the inner and outer ellipses.
The variable strength of the oscillatory power for the different regions is caused by the presence of various modes of the magneto-acoustic wave. In the internetwork regions the strong power results from the nearly undisturbed fast acoustic mode which propagates upward through the almost field-free medium (cf. Fig. 3). Here, the wave mode primarily possesses a longitudinal polarization with velocity perturbations, , along the propagation path and line-of-sight. Thus, the full strength of the oscillation shows up in the power map.
In the very center of the magnetic flux tubes, where the wave vector and the magnetic field vector are parallel, the fast acoustic mode has been primarily transmitted to the slow acoustic mode. This upwardly propagating slow acoustic mode of longitudinal polarization causes the intermediate oscillatory power in the very center of the magnetic network elements. Compared to the power of the acoustic mode in the internetwork region, the reduction of power is owed to the mode conversion process, where a fraction of the acoustic energy has been converted into the fast magnetic mode.
As shown in Sect. 3, the fast magnetic mode propagates in the region between the internetwork and the center of the network elements. The suppression of the oscillatory power can now be understood in terms of wave polarization—specifically by the orientation of the wave vector with respect to the magnetic field and line-of-sight. In the apex of the refractive wave path, the fast magnetic mode travels basically perpendicular to the magnetic field with longitudinal wave polarization and consequently, with velocity perturbations in the direction of the horizontally directed wave vector. Therefore, along the propagation path, the initial vertical velocity perturbations, , are gradually transformed into horizontal velocity perturbations, , and back again. Thus, the oscillatory power of the vertical velocity perturbations, , corresponding to line-of-sight velocities at the solar disk center, are suppressed around magnetic network elements, causing the appearance of a magnetic shadow.
According to Khomenko & Cally (2012, and references therein), part of the fast magnetic mode can convert into an Alfvén wave, which then propagates along the magnetic field lines. The fast-to-Alfvén conversion takes place most efficiently in the evanescent tail of the fast wave beyond the apex of the refractive wave path (reflection point), which extends throughout the upper chromosphere and beyond (Khomenko & Cally 2012). Therefore it cannot be expected to leave imprints on the power maps of Fig. 4, which pertain to the low chromosphere and upper photosphere, although it may become detectable in the core of H. Moreover, in our case, the apex of the refractive wave path occurs in regions threaded by mainly vertically directed magnetic fields. Hence, the excited Alfvén waves would not significantly contribute to line-of-sight velocity perturbations because of their transversal character. Consequently, we can consider the generation and propagation of the fast magnetic mode as the primary cause for the appearance of the magnetic shadow.
5 Conclusion
Power maps of high-frequency waves observed in chromospheric spectral lines show a reduction in power in the surroundings of network magnetic patches reminiscent of a shadow. The responsible physical process for this appearance has remained ambiguous so far. With three-dimensional radiation magnetohydrodynamic simulation, we can now reproduce the magnetic shadow phenomenon and we conclude that it is tied to the process of mode conversion. The excitation of the fast magnetic mode in the expanding region of the network magnetic field and its refractive wave path reduces the oscillatory power of the vertical velocity perturbations, , in the surroundings of magnetic network elements.
Furthermore, we can show that the power maps taken in the upper photosphere and lower chromosphere show the oscillatory signatures of different magneto-acoustic wave modes in three different phenomenological regions: the fast acoustic mode in the internetwork, the fast magnetic mode with possible superposition of Alfvén waves in the magnetic canopy region, and the slow acoustic mode in the center of magnetic network elements.
Acknowledgements.
The authors acknowledge support from the European Helio- and Astroseismology Network (HELAS), which is funded as Coordination Action by the European Commission’s Sixth Framework Programme. We thank the referee for the thorough reading of the manuscript and for constructive remarks.References
- Cally (2007) Cally, P. S. 2007, Astronomische Nachrichten, 328, 286
- Cavallini (2006) Cavallini, F. 2006, Sol. Phys., 236, 415
- Freytag et al. (2012) Freytag, B., Steffen, M., Ludwig, H.-G., et al. 2012, Journal of Computational Physics, 231, 919
- Judge et al. (2001) Judge, P. G., Tarbell, T. D., & Wilhelm, K. 2001, ApJ, 554, 424
- Khomenko & Cally (2012) Khomenko, E. & Cally, P. S. 2012, ApJ, 746, 68
- Khomenko & Collados (2006) Khomenko, E. & Collados, M. 2006, ApJ, 653, 739
- Kontogiannis et al. (2010a) Kontogiannis, I., Tsiropoula, G., & Tziotziou, K. 2010a, A&A, 510, A41
- Kontogiannis et al. (2010b) Kontogiannis, I., Tsiropoula, G., Tziotziou, K., & Georgoulis, M. K. 2010b, A&A, 524, A12
- Krijger et al. (2001) Krijger, J. M., Rutten, R. J., Lites, B. W., et al. 2001, A&A, 379, 1052
- McIntosh & Judge (2001) McIntosh, S. W. & Judge, P. G. 2001, ApJ, 561, 420
- Nutto et al. (2010) Nutto, C., Steiner, O., & Roth, M. 2010, Astronomische Nachrichten, 331, 915
- Nutto et al. (2012) Nutto, C., Steiner, O., Schaffenberger, W., & Roth, M. 2012, A&A, 538, A79
- Rutten (2012) Rutten, R. J. 2012, Phil. Trans. Royal Soc. A, in press
- Solanki & Steiner (1990) Solanki, S. K. & Steiner, O. 1990, A&A, 234, 519
- Steiner et al. (2007) Steiner, O., Vigeesh, G., Krieger, L., et al. 2007, Astronomische Nachrichten, 328, 323
- Vecchio et al. (2007) Vecchio, A., Cauzzi, G., Reardon, K. P., Janssen, K., & Rimmele, T. 2007, A&A, 461, L1