Extraction of the homogeneous linewidth of a fast spectrally diffusing line
Abstract
We present a simple method to extract the homogeneous linewidth of a single photon emitter line exhibiting fast (down to 1 ns) spectral diffusion (SD). It is based on a recently developed technique using photon correlation measurements on half of the line. Here we show that the SD induced bunching depends on the ratio between the width of the homogeneous line and the spectral diffusion amplitude. Using this technique on a CdSe/ZnSe quantum dot, we investigate the temperature dependence of its fast SD amplitude and its homogeneous excitonic linewidth.
pacs:
78.67.Hc, 78.67.Uh, 78.55.Et, 42.50.Lc,Spectral diffusion (SD) corresponds to random spectral jumps of a narrow line within a broader spectral profile. It is a prominent issue in spectroscopy Klauder ; Plakhotnik ; Empedocles ; Ambrose ; Robinson ; Seufert ; Turck ; Besombes . From a practical point of view, it broadens the observed linewidth and prevents the access to the intrinsic line properties. On a more fundamental side, it gives some very local information on the microscopic environment of a single light emitter embedded in a solid matrix, or moving within a fluid or a gas. The quest for large light matter coupling in condensed matter physics makes use of photonic nanostructures such as photonic crystals Englund ; vuckovic , photonic wires Claudon ; Yeo or metallic nanoantenae Novotny where the emitter is not far from a surface and may therefore undergo spectral diffusion caused by surface charge fluctuations.
Visualizing directly the spectral wandering by recording a time series of spectra has been so far the usual method to observe SD Plakhotnik ; Empedocles ; Ambrose ; Robinson ; Seufert ; Turck ; Besombes . For single photon emitters, the time resolution was therefore limited by the minimum time of about 1 ms required for a photon counting charged coupled device (CCD) to acquire a spectrum.
Except from the exotic possibility of statistics such as Levy flight Brokmann , SD is usually entirely described by its fluctuation amplitude and its characteristic time. But, additionally, one might wish to access the width of the homogeneous wandering line. When the characteristic SD time is faster than the time necessary to record a spectrum, this information is hidden by the inhomogeneous linewidth and difficult to access for a single photon emitter. Sophisticated methods featuring both high spectral and temporal resolution are required to access this quantity. To our knowledge, photon correlation Fourier spectroscopy (PCFS) Coolen is the only published method able to extract the homogeneous linewidth of a rapidly wandering line of a single emitter together with its SD parameters. In PCFS, high spectral resolution () is provided by a Michelson interferometer, and temporal resolution of 20 s is achieved with a photon correlation set-up at the outputs of the interferometer. Alternatively, four wave mixing Langbein is able to give the coherence time of the transition of a single emitter undergoing spectral diffusion, but without any access to SD characteristic time. In the case of an ensemble of emitters, lock-in hole burning techniques Palinginis can give the homogeneous linewidth.
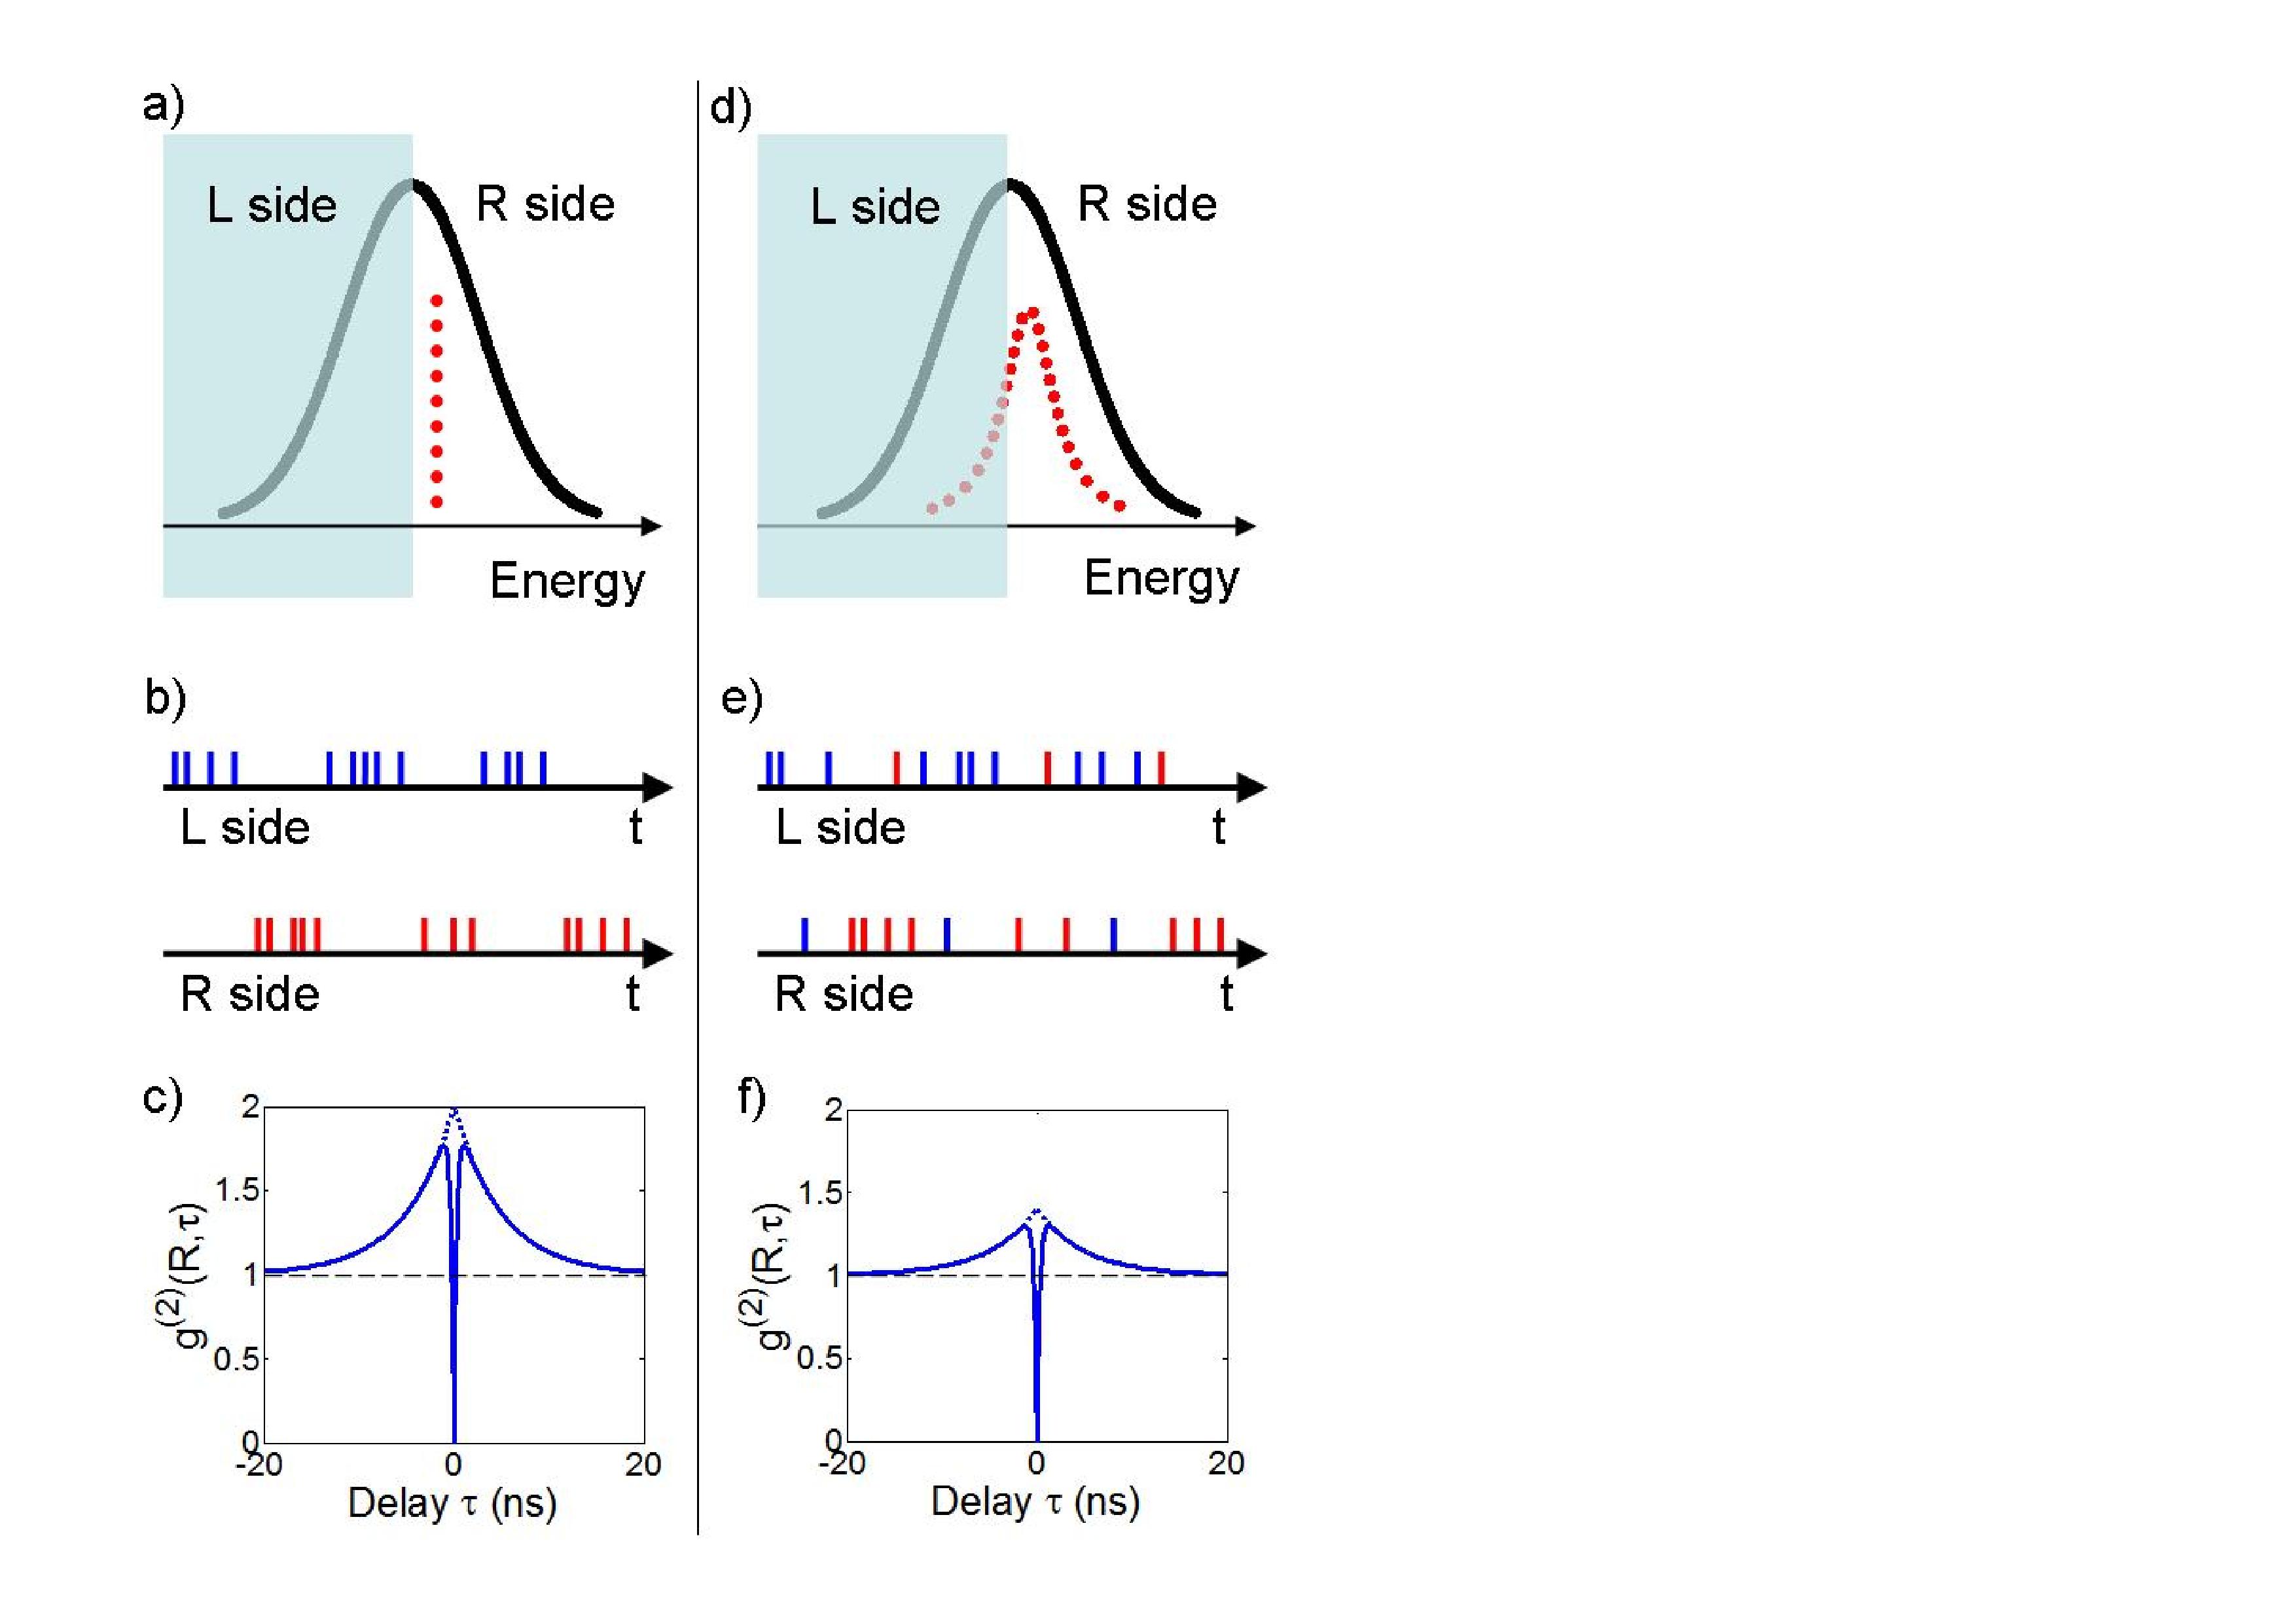
Our recently developed photon correlation spectroscopy (PCS) technique Sallen converts spectral fluctuations into intensity fluctuations, as also reported in Zumbusch ; Coolen ; Marshall . This simple method benefits from the subnanosecond time resolution of an Hanbury-Brown and Twiss photon correlation set-up and the spectral resolution of the spectrometer. In short, it is based on correlations of photons emitted within a spectral window narrower than the SD broadened line. Owing to the wandering of the homogeneous line, the emission energy stays a limited time within this spectral window leading to photon bunching (see fig 1). The characteristic time of this effect can be easily accessed by photon correlation even though it is much shorter than the inverse photon count rate. In practice, spectral diffusion in the 1 ns range can be measured even though the count rate is less than one photon every 10 s. This opens a new domain of fast spectral diffusion phenomena that was previously not accessible.
In this letter, we present a development of the PCS technique that enables the extraction of the homogeneous linewidth of the spectrally diffusing line of a single photon emitter, together with its complete SD parameters. The method is performed on CdSe quantum dots (QDs) embedded in a ZnSe nanowire (NW) JAP , with a single object photoluminescence linewidth between 1 and 2 meV BounouarPRB . After describing the principle of our measurement, we discuss the properties of the half-line autocorrelation function (HLAF) of a spectrally diffusing single photon emitter with a finite homogeneous linewidth. We show that the contrast of the measured photon bunching is related to the ratio between the SD amplitude and the homogeneous linewidth of the wandering line. We evaluate these two quantities separately on our NW-QD and study their behavior when temperature is increased as an illustration of the possibilities offered by our method. This allows us to probe the emitter energy statistic as a function of temperature.

In the case of an infinitely narrow homogeneous line as shown in fig.1(a-c), the HLAF, noted when the R side of the inhomogeneous line is detected, writes
| (1) |
with being the SD correlation rate, the radiative emission rate, the pumping rate and the SD induced bunching factor. This expression is the product of two terms. The last term corresponds to the antibunching of the single photon emitter. The first term accounts for spectral diffusion and its influence on the ability of the emitter to send photons in the R spectral window. Note that in the case of an infinitely narrow homogeneous line when the two energy sides are of equal importance (ie half of the total count in the R side). Equal distribution between L and R is checked very carefully since deviation from this situation leads to a different value of Sallen .
We now consider the case of a finite homogeneous linewidth (fig.1(d-f)). In this situation, even if the homogeneous line is centered in the L side, a photon can nevertheless be detected in the R side and vice versa as represented in fig. 1(e). This randomizes the photon stream and results in a reduction of the bunching contrast as seen in fig.1(f).
A probabilistic model was developed theorsd considering the consequence of a finite linewidth on the HLAF. The key idea is to take into account the combined effects of the correlated energy statistics of the SD together with the uncorrelated energy statistics introduced by the homogeneous linewidth. When the photons are detected on the R side, the bunching contrast is then found as
| (2) |
where is a normalized overlap integral defined as
| (3) |
where is the SD line distribution of full width at half maximum (FWHM) , i.e. the probability density associated with the position of the homogeneous line median energy , and the homogeneous line shape with median and FWHM . We assume here that each of these function has a given shape that can be described by a single width parameter ( for and for ). The coefficients and are the probability to detect a photon in the R spectral window with the homogeneous linewidth respectively centered in R or in L. They only depend on the homogeneous and SD line profiles and . If the a priori knowledge of the physical system allows us to chose the shape of the SD distribution and of the homogeneous line, which is generally the case, the bunching contrast will only depend on their linewidth ratio . This is the main result of the paper.
In the following, we have used a Lorentzian shape of FWHM for and a Gaussian shape of FWHM for to model the bunching factor and fit the experimental data. We are aware that a Lorentzian shape is only an approximation of the real homogeneous line shape, especially at elevated temperature when the exciton-phonon coupling leads to more complex line shapes Besombes_line , but this gives nevertheless a meaningful estimation of the homogeneous linewidth and its variation. The Gaussian shape of the spectral diffusion distribution is justified by the Kubo-Anderson theory which describes the spectral diffusion as the result of fluctuations of a very large number of independent identical random variables, leading globally to a Gaussian distribution of the emitter energies in the "slow fluctuations" regime where kubo ; anderson ; Berthelot . In our case meV and ns so that .
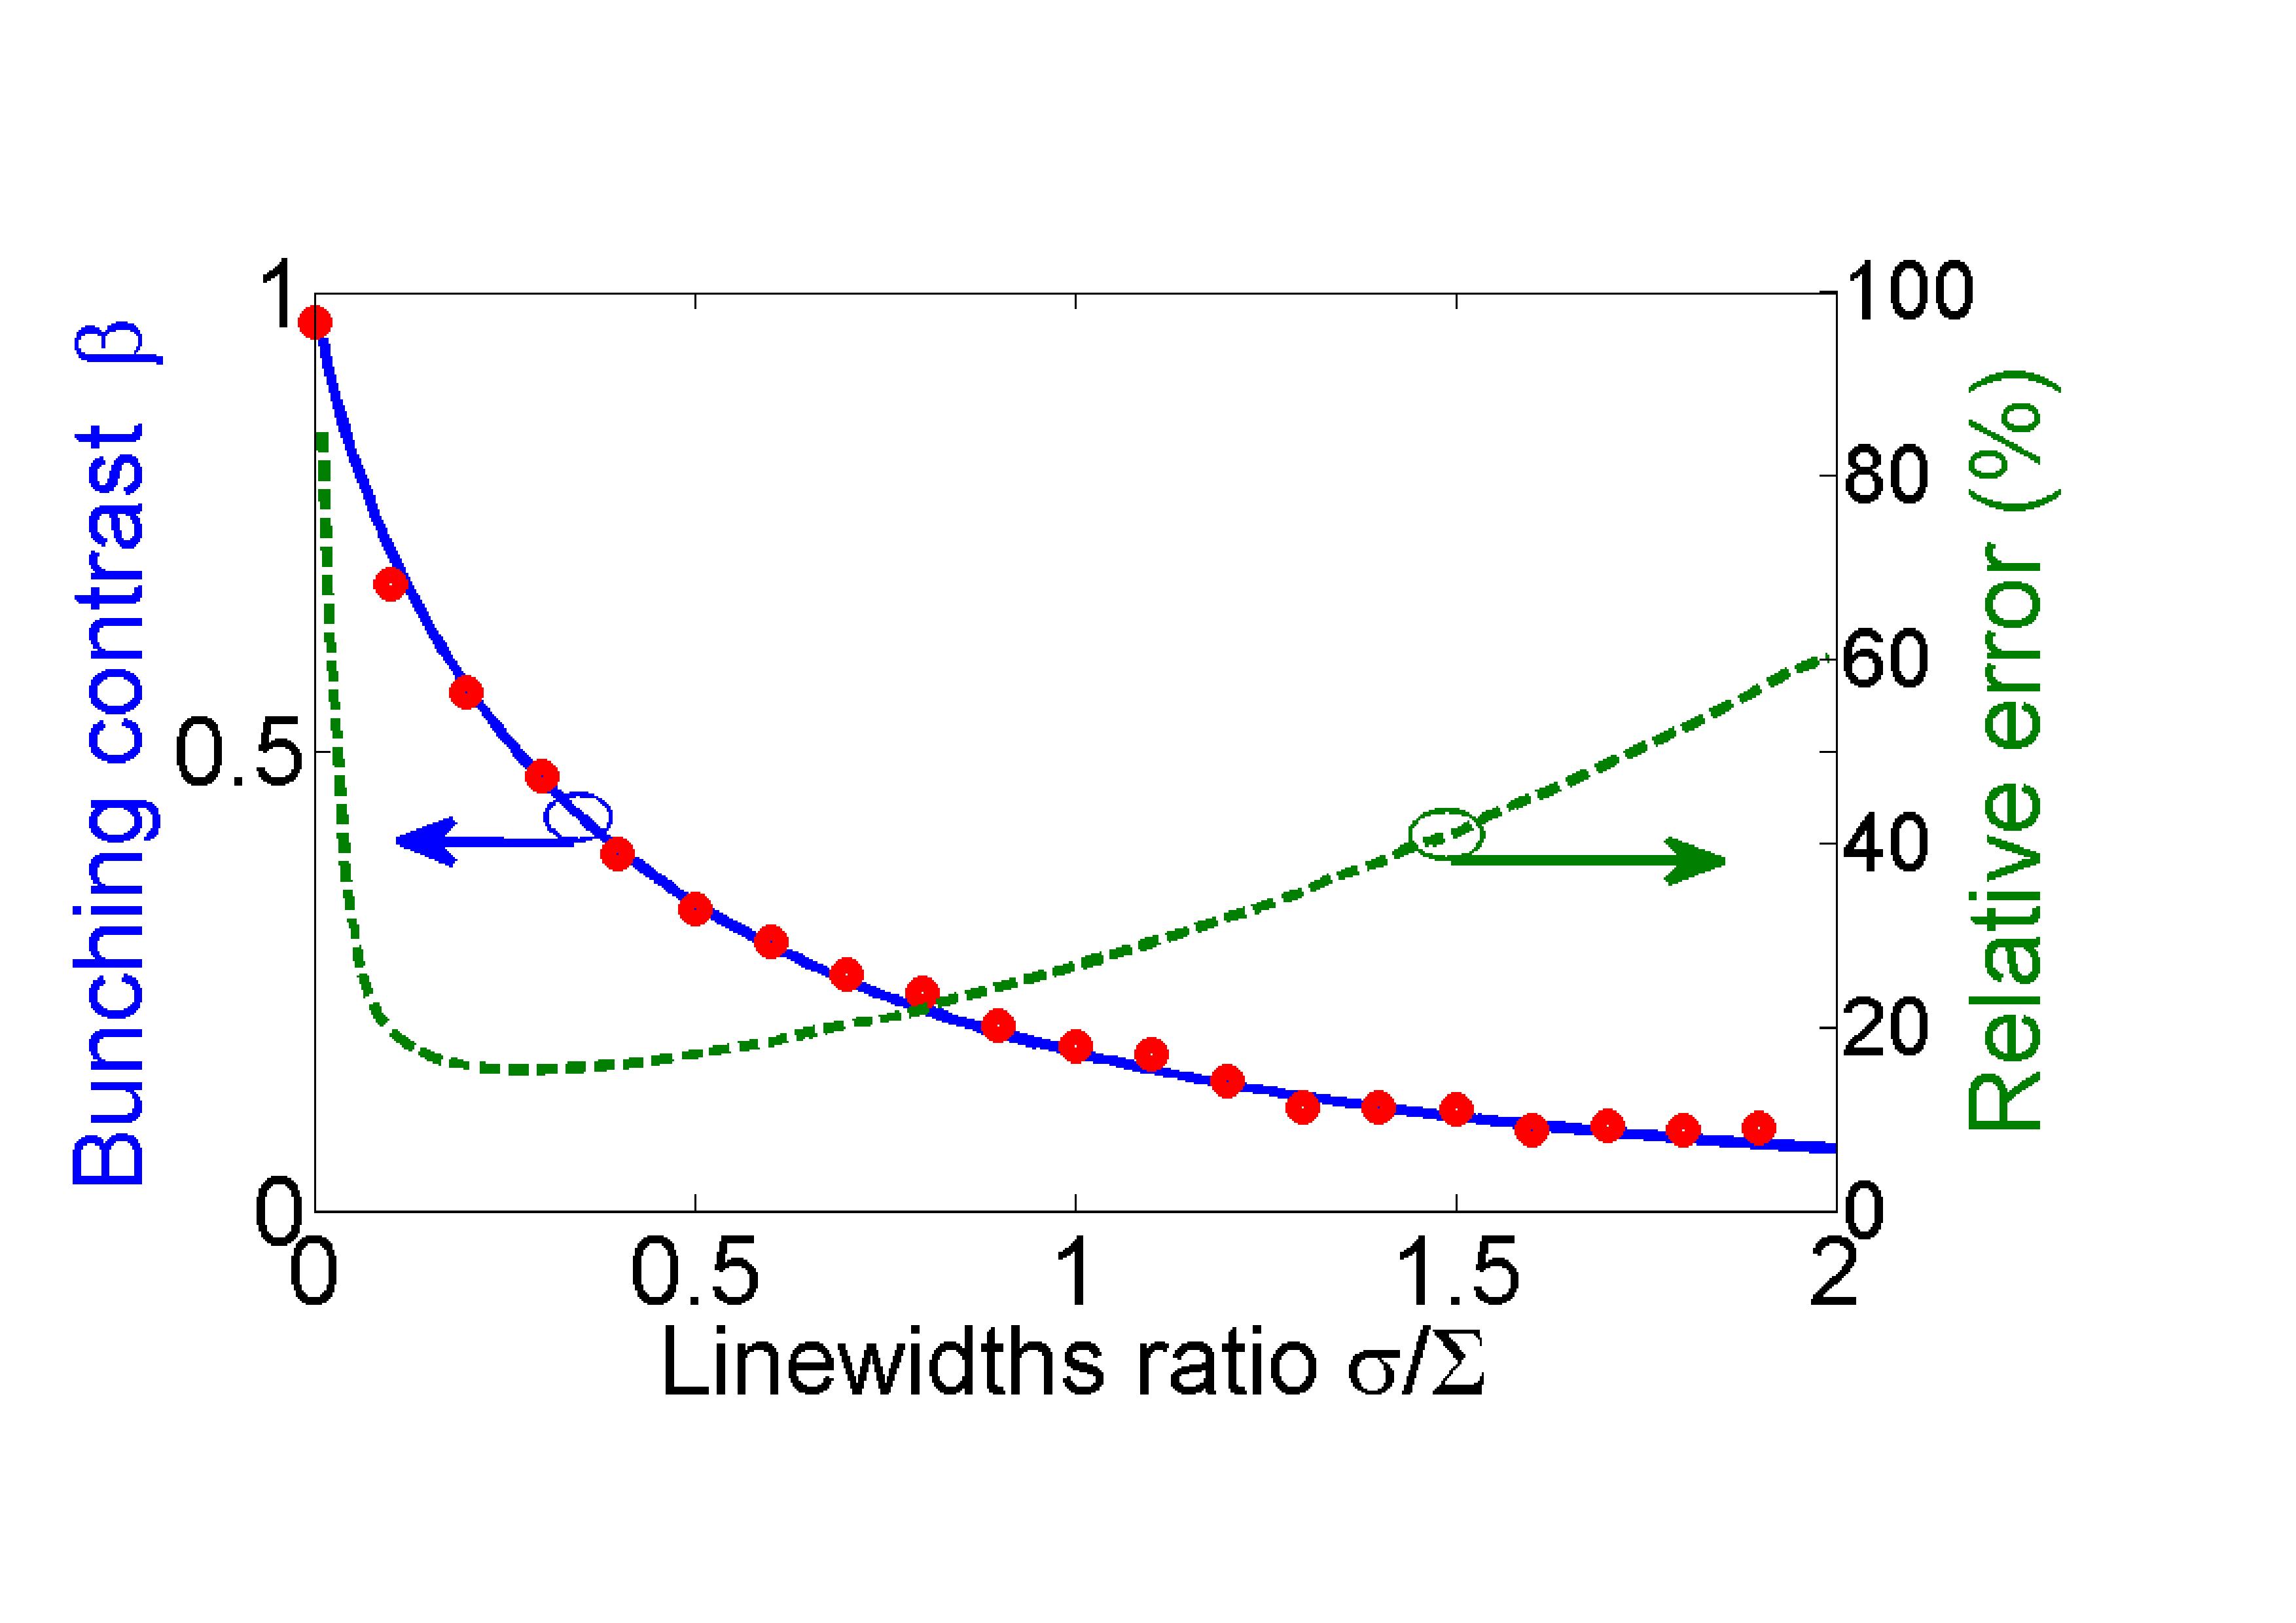
Within the above assumptions, the bunching factor , computed from eq.(2), is plotted in fig.2 as a function of together with a Monte-Carlo simulation. The bunching factor decreases with this ratio because the uncorrelated statistics introduced by the homogeneous linewidth is degrading the bunching induced by the correlated SD process. Note that for an infinitely small homogeneous linewidth the bunching factor is equal to unity ( and ), the energy of the emitter being only defined by SD. On the contrary, for an homogeneous linewidth larger than the SD amplitude the bunching vanishes ( and ), as the uncorrelated homogeneous linewidth process dominates and the emitter energy statistics in the time domain tends to be Poissonian. As seen with the green dashed line in fig.2, a relative error on better than 30 is obtained for in our experimental conditions.

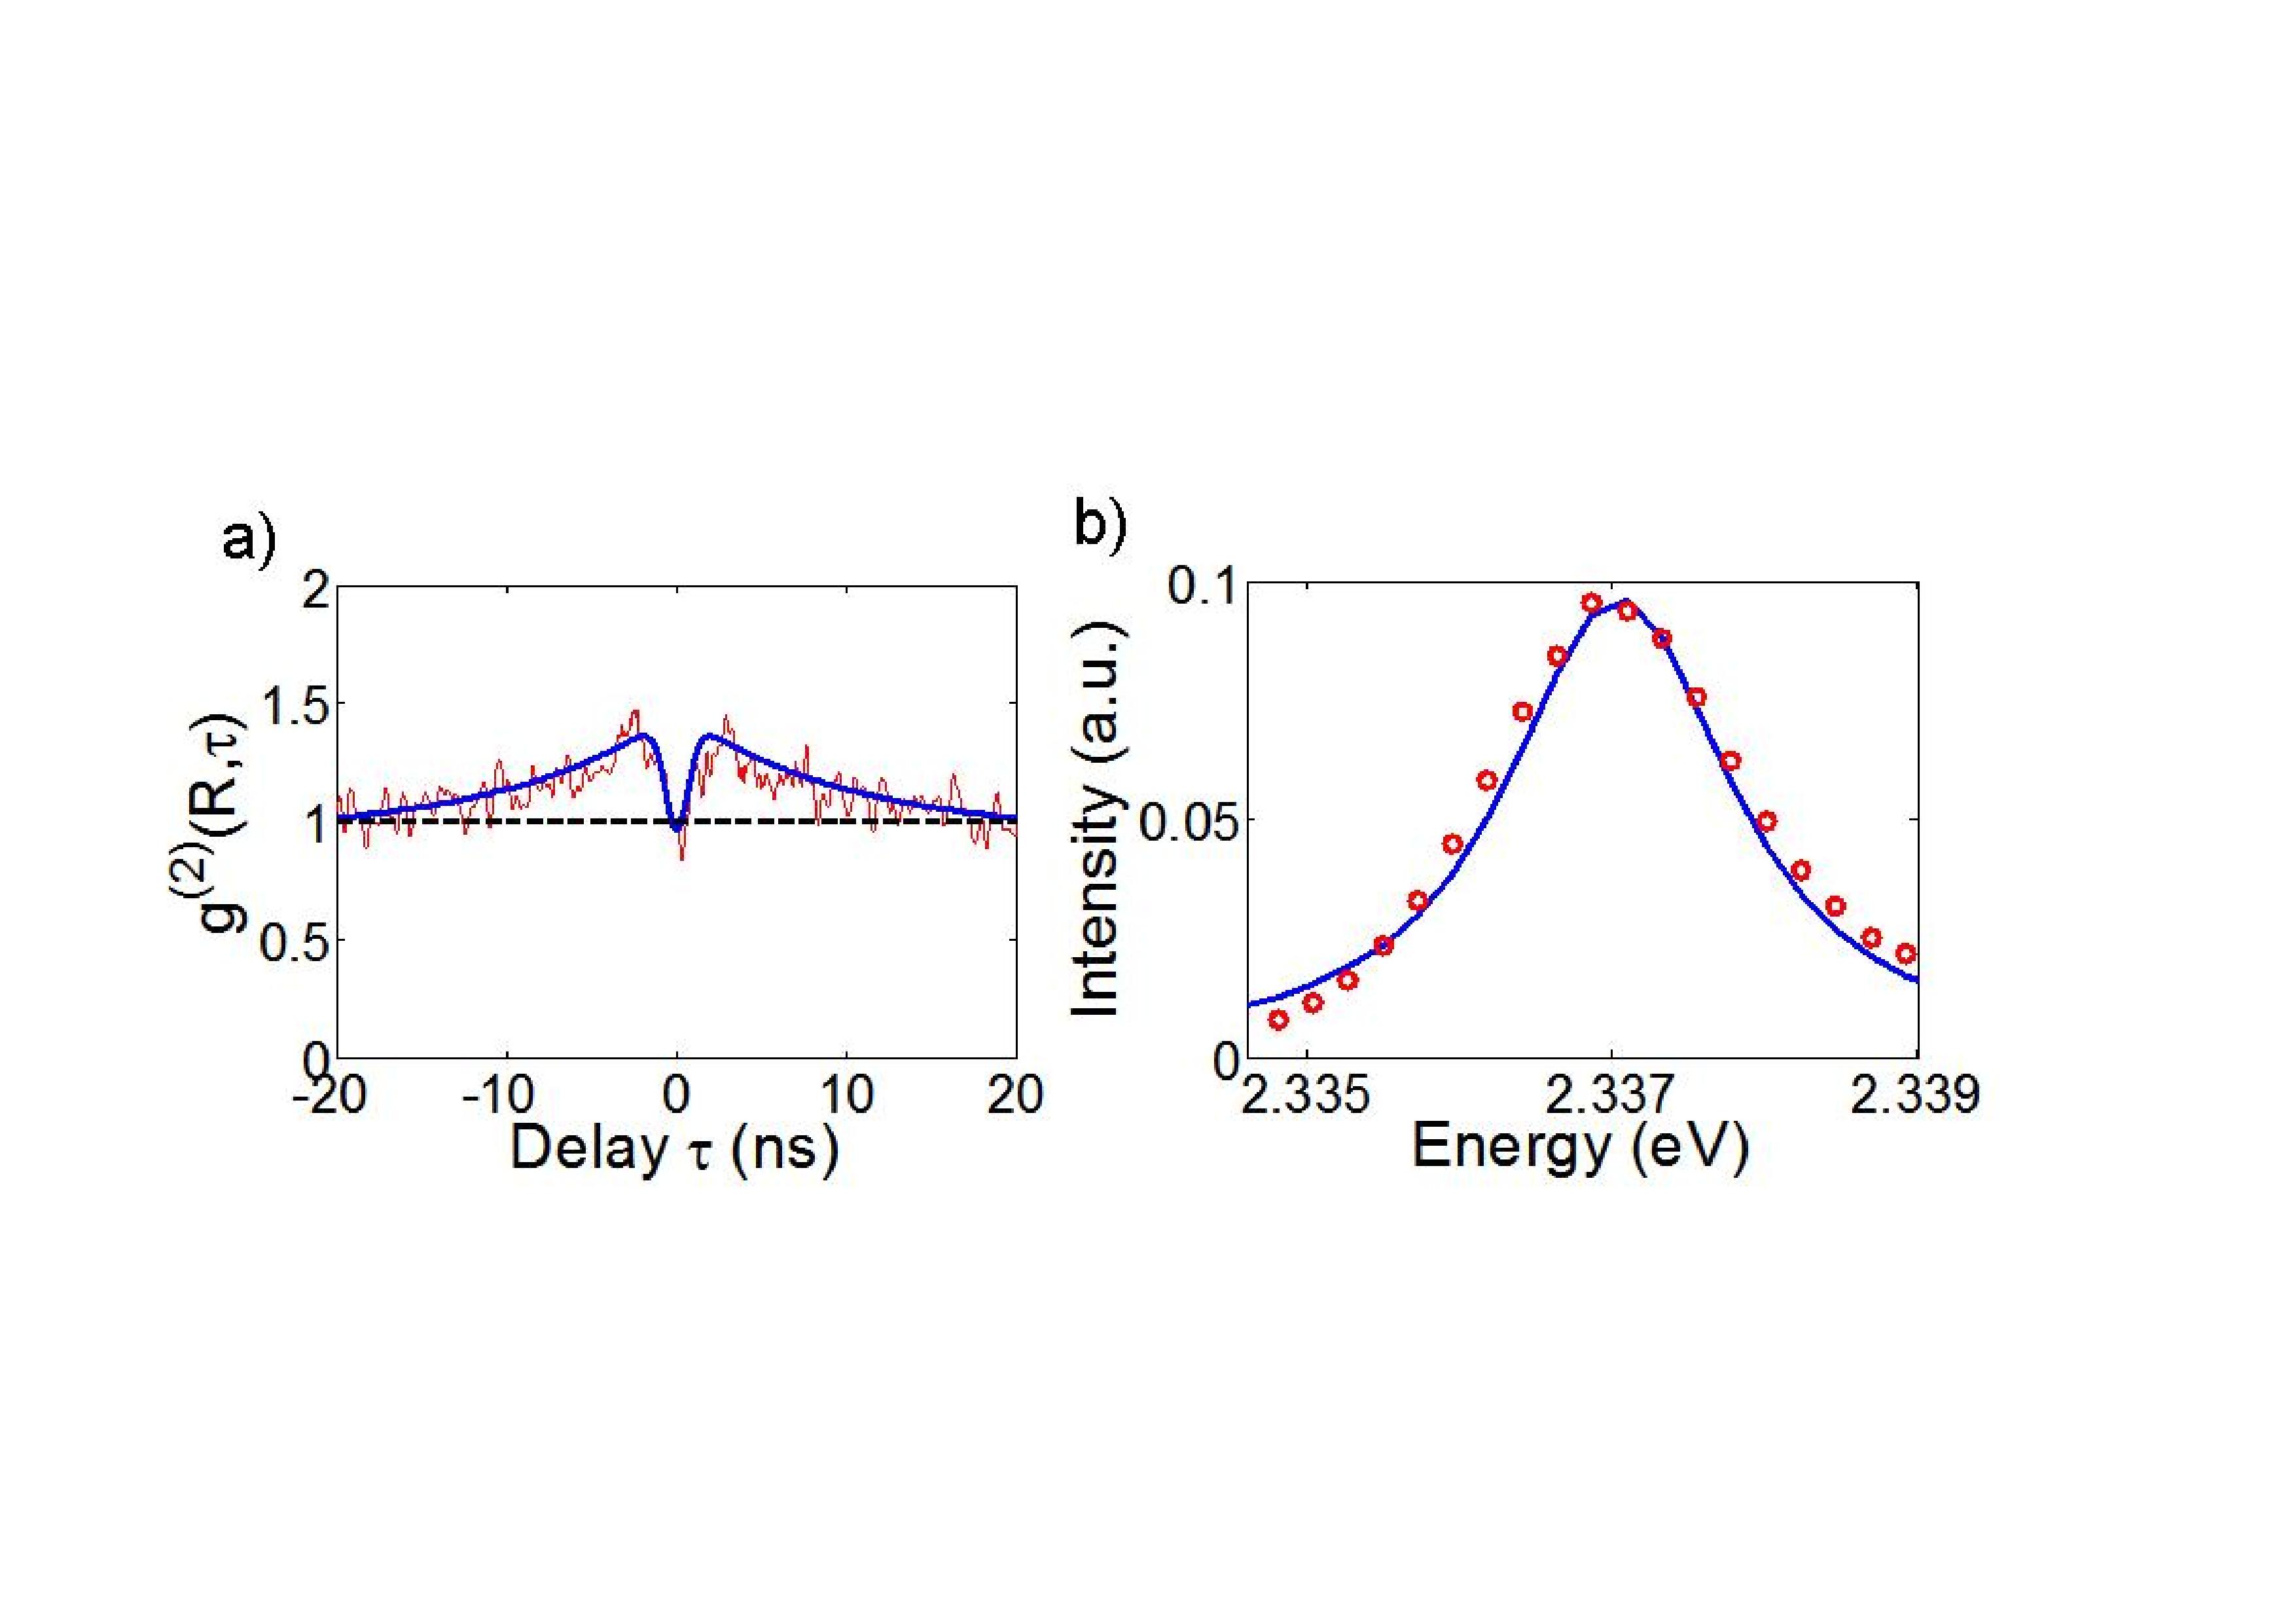
The measurement of the HLAF gives access to the bunching factor and therefore to the ratio. The spectrum also depends on these two parameters as it is a convolution of the homogeneous linewidth and of the spectral diffusion distribution. It leads to a Voigt profile when the homogeneous and the inhomogeneous line are respectively Lorentzian and Gaussian as mentionned above. Thus, the recording of the spectrum and of the HLAF (cf fig.3) allows the extraction of the homogeneous linewidth together with the SD amplitude and characteristic time in the 10 ns range.
Our experimental results have been obtained with a time resolved microphotoluminescence setup. The excitation source is a continuous wave laser emitting at nm (ie eV). The QD luminescence is detected through a nm (ie eV) resolution spectrometer on a charged coupled device (CCD) camera for spectra or on a Handbury-Brown and Twiss photon correlation set-up of overall time resolution of 800 ps (FWHM).
The measurement method was applied on three different QDs with different SD amplitudes and the extracted homogeneous linewidths were around 300 for the three measurements. This actually corresponds to the experimental spectral resolution imposed by the spectrometer. This is the main limitation of this method. However, we underline the fact that the measured correlation times are of the order of 10 ns and that it is the only reported method able to probe experimentally the homogeneous linewidth of such a fast diffusing single photon emitter.

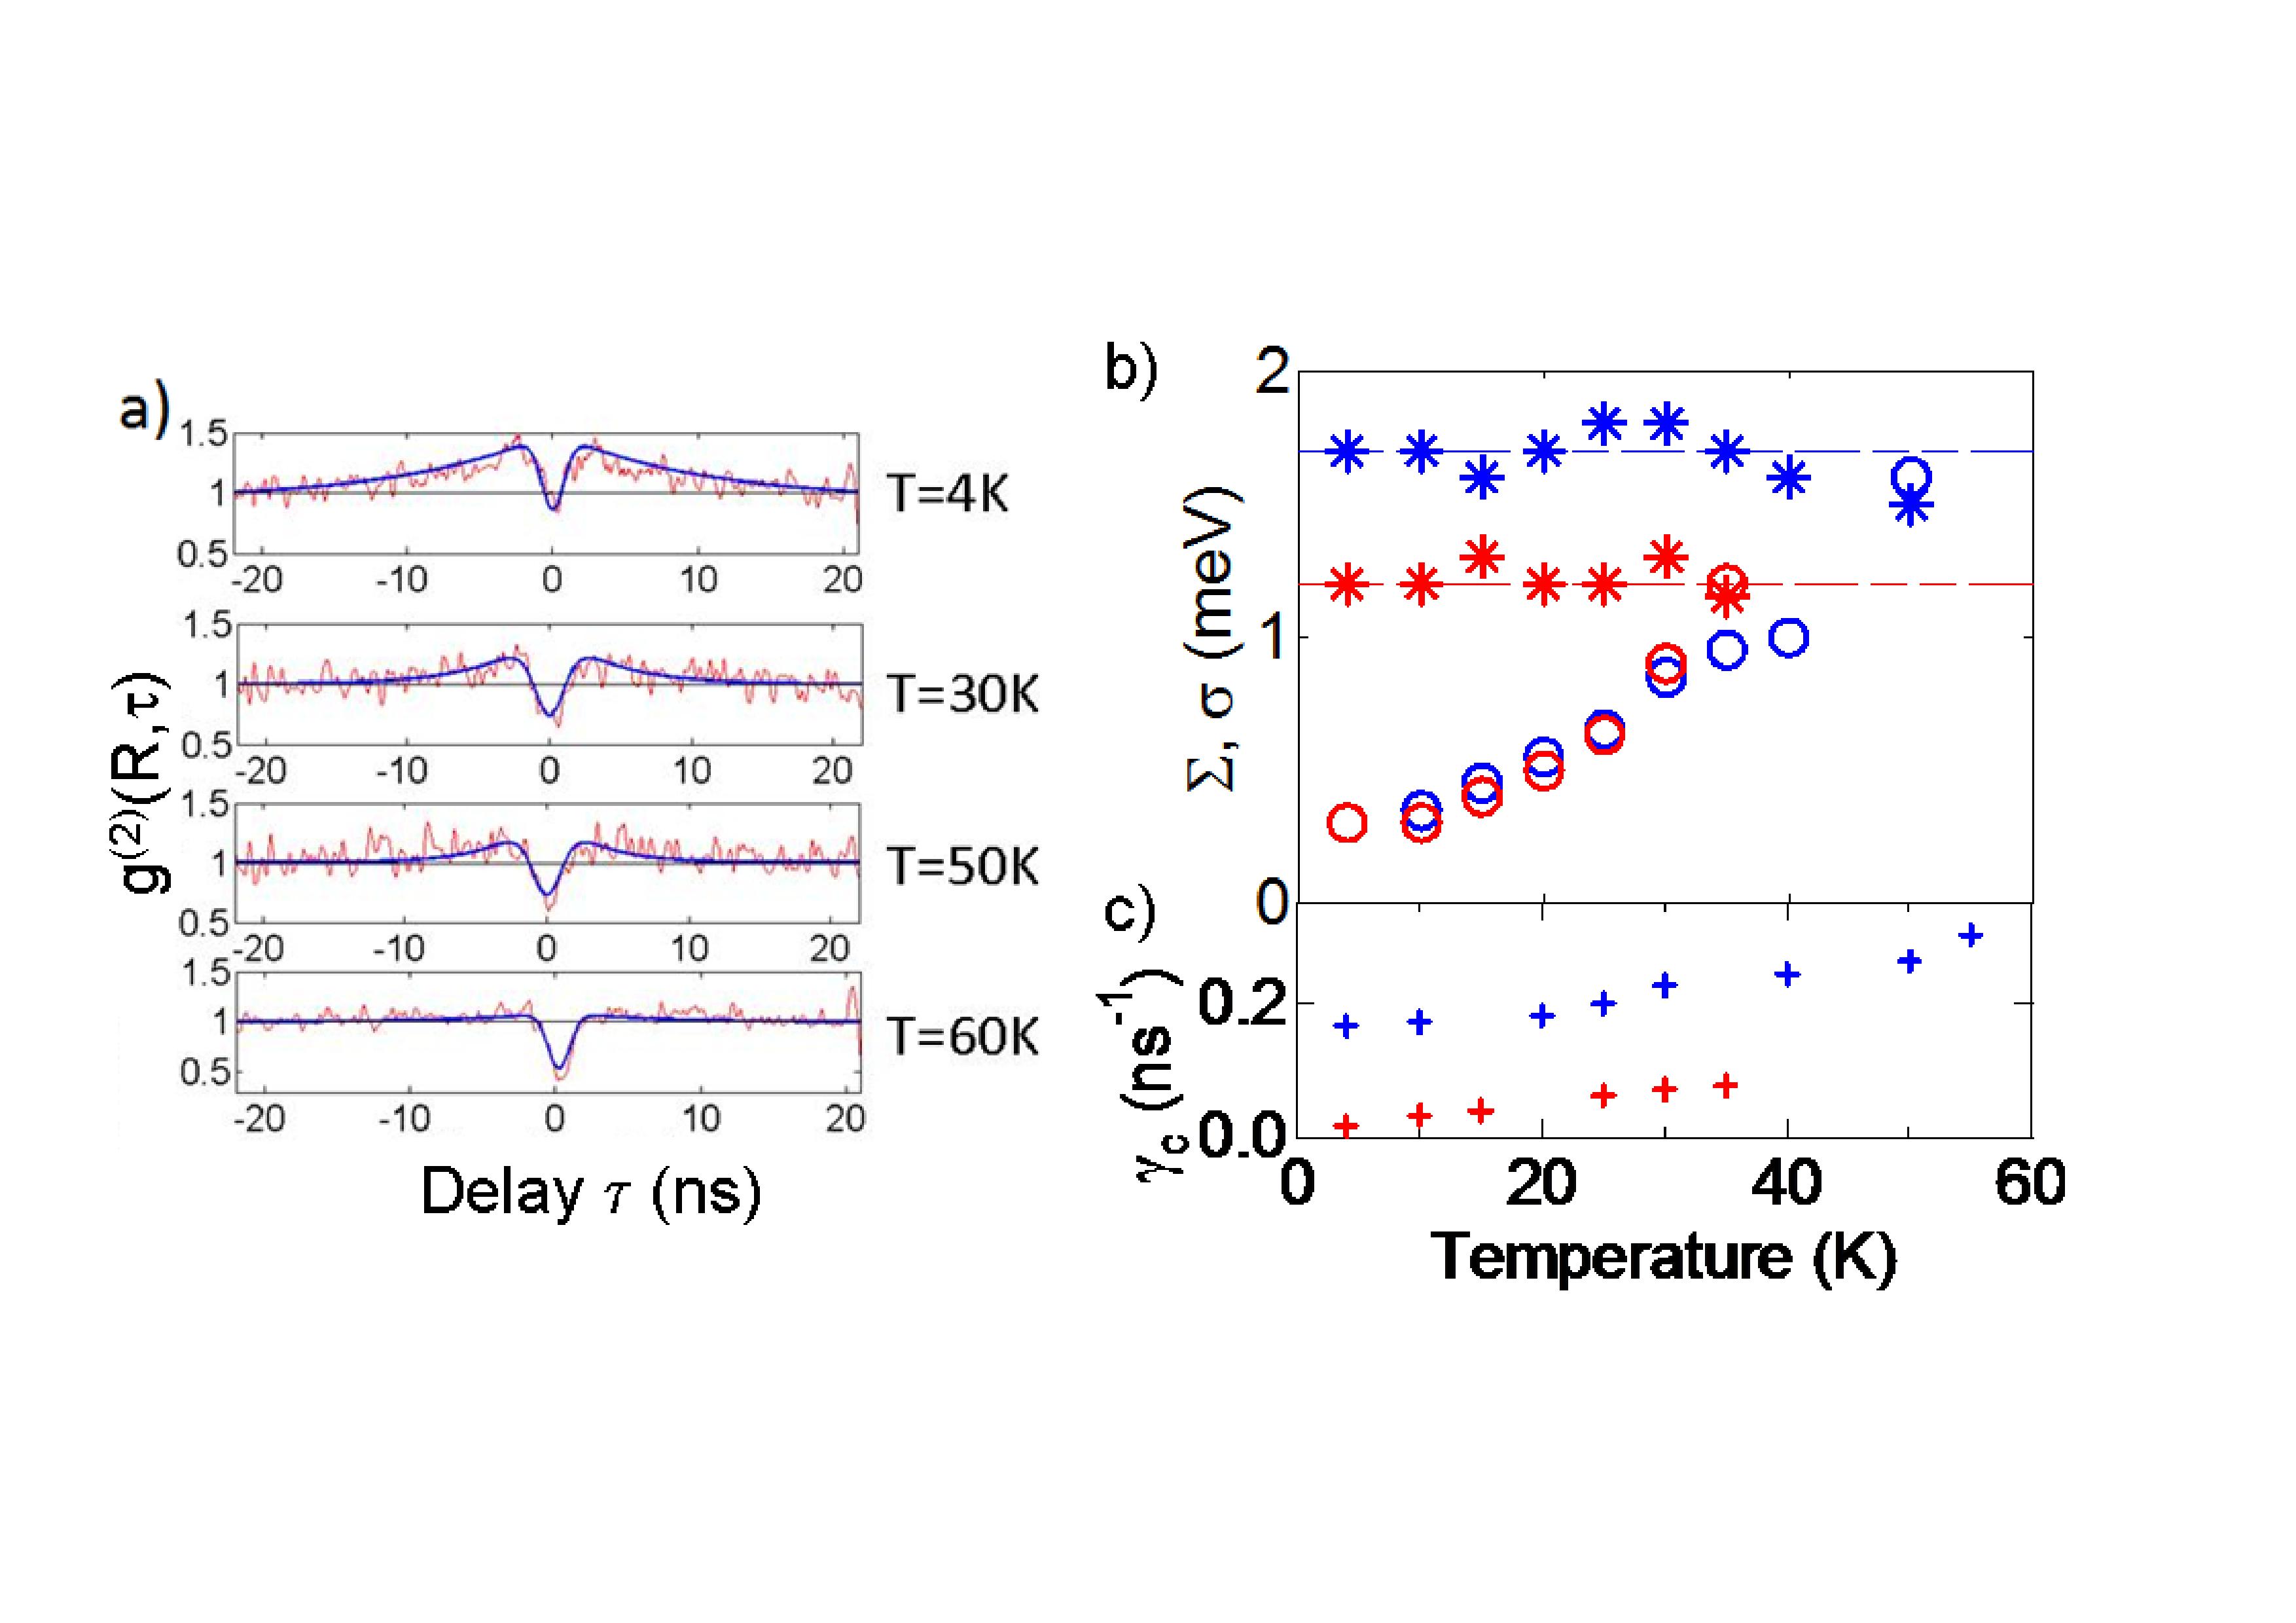
When the temperature is increased, the first noticeable consequence on the HLAF is the decrease of the bunching contrast (fig.4 a)). The first interpretation of this observation is the increase of the homogeneous linewidth owing to temperature induced phonon broadening Besombes_line ; Favero . This process becomes dominant above 60 K for this QD, and the bunching collapses completely for higher temperatures meaning that the ratio becomes large. At high temperature the energy of the emitter is less and less time correlated and tends to adopt a Poissonian statistics. We display the extracted homogeneous linewidths and spectral diffusion amplitudes (fig.4 b)) together with the spectral diffusion rate (fig.4 c)) as a function of temperature for two different QDs with different (blue: QD1, meV and red: QD2, meV). The effective homogeneous linewidths for both QDs increase with temperature. They reach the same order of magnitude as the fluctuation amplitude for temperatures around 40-50 K. For temperatures higher than 60 K, the bunching becomes no longer measurable and the ratio can no longer be accurately extracted.
A remarkable feature that appears in fig.4 b) is that the SD amplitude is constant with temperature for the two investigated quantum dots. So our results show that the main contribution to the QD linewidth is SD for temperatures below 60 K and phonon broadening above. This relatively surprising behaviour can be explained with the help of the Kubo Anderson model adapted to non symmetrical fluctuations Cook ; Berthelot . Even though the description of spectral diffusion mechanisms in QDs is not the main focus of this paper, we give here a brief interpretation of this result. Emission energy fluctuations in semiconductors are caused by captures and escapes of carriers in defects in the QD vicinity. These carrier motions are mainly governed by phonon and Auger effects. The Auger contribution is similar for capture and escape processes and is dominant at high pumping power. This means that, under our experimental conditions, whatever the temperature. Since the SD amplitude is governed by Berthelot , it should therefore be temperature independent, as observed experimentally. Furthermore this effect is rather robust to a departure of the ratio from unity owing to the fact that the SD amplitude features a rather flat maximum around . Fig.4 c) shows that the SD rate increases with temperature. This rate is given by Berthelot . Its rise with temperature is caused by the rise of and with the increasing phonon population. The difference between the two QDs can be attributed to a difference in the Auger rate and/or to a different defect energy depth.
As a conclusion, we have demonstrated that the measurement of the HLAF brings informations on the energy statistics of the emitter in addition of providing a subnanosecond resolution access to the correlation time of the fluctuations. The main result of this paper is the possibility of extracting of the homogeneous linewidth of a fast diffusing line with a simple photon correlation set-up. This work brings a new tool for the understanding of single emitters environment fluctuations. As an illustration, we showed that, in CdSe/ZnSe NW QDs, SD amplitude does not depend on temperature and that the line broadening is only due to the coupling of the emitter with phonons. This contributes to a better interpretation of the temperature behaviour of QD linewidths.
We acknowledge support from the French National Research Agency (ANR) through the Nanoscience and Nanotechnology Program (Project BONAFO ANR-08-NANO-031-01) that provided a research fellowship for MdH. MEJ acknowledges financial support from the Nanosciences Foundation "Nanosciences, aux limites de la nanoélectronique" (RTRA).

References
- (1) J. R. Klauder and P. W. Anderson, Phys. Rev. 125, 912 (1962)
- (2) W. P. Ambrose, and W. E. Moerner, Nature 349, 225 (1991).
- (3) S. A. Empedocles, D. J. Norris, and M. G. Bawendi, Phys. Rev. Lett. 77, 3873 (1996).
- (4) H. D. Robinson and B. B. Goldberg, Phys. Rev. B 61, R5086 (2000).
- (5) T. Plakhotnik and D. Walser, Phys. Rev. Lett. 80, 4064 (1998)
- (6) J. Seufert, R. Weigand, G. Bacher, T. Kümmell, A. Forchel, K. Leonardi, and D. Hommel Appl. Phys. Lett. 76, 1872 (2000)
- (7) V. Türck, S. Rodt, O. Stier, R. Heitz, R. Engelhardt, U. W. Pohl, D. Bimberg, and R. Steingruber, Phys. Rev. B 61, 9944 (2000).
- (8) L. Besombes, K. Kheng, L. Marsal, and H. Mariette, Phys. Rev. B 65, 121314 (2002).
- (9) D. Englund, A. Faraon, I. Fushman, N. Stoltz, P. Petroff and J. Vučković, Nature (London) 450, 857 (2007)
- (10) A. Majumdar, E. D. Kim, and J. Vučković, Phys. Rev. B 84, 195304 (2011)
- (11) J. Claudon, J. Bleuse, N.S. Malik, M. Bazin, P. Jaffrennou, N. Gregersen, C. Sauvan, P. Lalanne and J.-M. Gérard, Nature Photon. 4, 174 (2010).
- (12) I. Yeo, N.S. Malik, M. Munsch, E. Dupuy, J. Bleuse, Y.-M. Niquet, J.-M. Gérard, J. Claudon, E. Wagner, S. Seidelin, A. Auffèves, J.-Ph. Poizat, and G. Nogues, Appl. Phys. Lett. 99, 233106 (2011)
- (13) L. Novotny and N. van Hulst, Nature Photon. 5, 83 (2011)
- (14) X. Brokmann, J.-P. Hermier, G. Messin, P. Desbiolles, J.-P. Bouchaud, and M. Dahan, Phys. Rev. Lett. 90, 120601 (2003)
- (15) X. Brokmann, M. Bawendi, L. Coolen, J.-P. Hermier, Opt. Express, 14, 6333 (2006); L. Coolen, X. Brokmann, and J.-P. Hermier, Phys. Rev. A 76, 033824 (2007); L. Coolen, X. Brokmann, P. Spinicelli, and J.-P. Hermier Phys. Rev. Lett. 100, 027403 (2008).
- (16) B. Patton, W. Langbein, U. Woggon, L. Maingault and H. Mariette, Phys. Rev. B 73, 235354 (2006); W. Langbein and B. Patton, J. Phys. Condens. Matter 19 295203 (2007); W. Langbein, Rivista Nuovo Cimento 33, 255 (2010)
- (17) P. Palinginis, S. Tavenner, M. Lonergan, and H. Wang Phys. Rev. B 67, 201307 (2003).
- (18) G. Sallen, A. Tribu, T. Aichele, R. André, L. Besombes, C. Bougerol, M. Richard, S. Tatarenko, K. Kheng, and J. Ph. Poizat, Nature Photon. 4, 696 (2010)
- (19) A. Zumbusch, L. Fleury, R. Brown, J. Bernard, and M. Orrit, Phys. Rev. Lett. 70, 3584 (1993).
- (20) L. F. Marshall, J. Cui, X. Brokmann, and M. G. Bawendi, Phys. Rev. Lett. 105, 053005 (2010).
- (21) M. Den Hertog, M. Elouneg-Jamroz, E. Bellet-Amalric, S. Bounouar, C. Bougerol, R. André, Y. Genuist, J.-Ph. Poizat, K. Kheng and S. Tatarenko, J. Appl. Phys. 110, 034318 (2011).
- (22) S. Bounouar, C. Morchutt, M. Elouneg-Jamroz, L. Besombes, R. André, E. Bellet-Amalric, C. Bougerol, M. Den Hertog, K. Kheng, S. Tatarenko, and J. Ph. Poizat, Phys. Rev. B 85, 035428 (2012).
- (23) A. Trichet and S. Bounouar. arXiv:1201.4016
- (24) L. Besombes, K. Kheng, L. Marsal, and H. Mariette Phys. Rev. B 63, 155307 (2001).
- (25) R. Kubo, J. Phys. Soc. Jap. 9, 935 (1954).
- (26) P. W. Anderson, J. Phys. Soc. Jpn. 9, 316 (1954).
- (27) A. Berthelot, I. Favero, G. Cassabois, C. Voisin, C. Delalande, Ph. Roussignol, R. Ferreira, and J.-M. Gérard, Nature Physics 2, 759 (2006).
- (28) I. Favero, A. Berthelot, G. Cassabois, C. Voisin, C. Delalande, Ph. Roussignol, R. Ferreira, and J.-M. Gérard, Phys. Rev. B 75, 073308 (2007).
- (29) R. J. Cook and H. J. Kimble, Phys. Rev. Lett, 54, 1023 (1985).