Correlation of supernova redshifts with temperature fluctuations of the Cosmic Microwave Background
Abstract
Redshifts of a supernova (SN) and gamma-ray burst (GRB) samples are compared with the pixel temperatures of the Wilkinson Microwave Anisotropy Probe (WMAP) seven-years data, the pixels locations corresponding to the SN and GRB sky coordinates. We have found a statistically significant correlation of the SN redshifts with the WMAP data, the average temperature deviation being for the redshifts ranging from 0.5 to 1.0 and for . The latter value accords with the theoretical estimates for the distortion of the cosmic microwave background due to the integrated Sachs-Wolfe effect, whereas the larger anomaly for higher redshifts should be studied in more detail in the future.
keywords:
methods: statistical — gamma-ray burst: general — supernovae: general — cosmic background radiationDOI:10.1111/j.1365-2966.2012.21026.x
1 Introduction
During the past few years there has been a noticeable increase in publications discussing different aspects of non-Gaussian features in the cosmic microwave background (CMB) radiation (Ferreira et al., 1998; Wu et al., 2001; Verde et al., 2001; Komatsu et al., 2003; Park, 2004; Vielva et al., 2004; De Troia et al., 2007; Vanchurin, 2009; Bernui & Rebouças, 2010; Pogosyan et al., 2011; Ashoorioona et al., 2011). The non-Gaussian behaviour seen on different angular scales and with a variety of amplitudes imply the existence of some large-scale anisotropies in the distribution of matter in the Universe.
One of such anisotropies is a so far unexplained alignment of low-order multipoles ( to ) in the representation of CMB as a power series expansion with spherical harmonics. This anomaly is sometimes referred to as “the cosmic axis of evil” (Spergel et al. 2003; De Oliveira-Costa et al. 2004; Schwarz et al. 2004; Land & Magueijo 2005; Magueijo & Sorkin 2007; see also the review by Rakic & Schwarz 2007). Furthermore, recently it was found that the axes of rotation of most galaxies from the Sloan Digital Sky Survey (SDSS) appear to line up with the axis of evil (Longo, 2011). The other known anomalies are related to the so-called “hot” and “cold” spots of the CMB (Larson & Wandelt, 2004, 2005; Vielva et al., 2007; Copi et al., 2010; Ayaita et al., 2010) which are regions of increased or reduced temperatures compared to the average temperature of the CMB map. For example, the temperature of one of the most prominent and broadly discussed non-Gaussian features known as the extreme cold spot (Vielva et al., 2004; Mukherjee & Wang, 2004; Martínez et al., 2006; Cruz et al., 2007; Vielva, 2010) is approximately 70 K lower than the average CMB temperature. The possibilities of such a large anomaly appearing within the framework of the standard -cold-dark-matter (CDM) model are discussed by Inoue (2012), who argues that there might exist a large-scale void along the line of view towards the extreme cold spot. The existence of a void of 100 Mpc radius along this line at was recently ruled out by Granett et al. (2010), who used galaxy counts in photometric redshift bins. However, the void might be at larger distances. The non-uniform distribution of the largest CMB spots over the celestial sphere results in the north-south ecliptic asymmetry in the CMB maps (Eriksen et al. 2004; Bernui 2008; see also the discussion in Rakic & Schwarz 2007).
A variety of techniques are used for extracting the information about CMB anisotropies, such as the determination of both angular and planar modulation parameters by using the two-point correlation function (Szapudi et al., 2001), the characterisation of deviations from a given (say, Gaussian) model using the -criterion, or the comparison of random Gaussian maps with observed maps (Liguori et al., 2003, 2007).
Also of importance is the interpretation of the deviations from a Gaussian distribution found in the CMB power spectrum. One of the possible explanations of these deviations is based on the assumption that they might be due to contamination of CMB by foreground sources. The induced deviations caused by the strongest of these sources are removed by the foreground reduction procedure, although the completeness of this procedure is still under scrutiny (see Naselsky et al., 2003; Then, 2006; Bennett et al., 2011).
It is worthwhile mentioning the Sachs-Wolfe (Sachs & Wolfe, 1967), Rees-Sciama (Rees & Sciama, 1968) and Sunyaev-Zeldovich (Sunyaev & Zeldovich, 1970) effects. The first two alter the energy of CMB photons when they traverse gravitational fields of different strengths corresponding to either voids or conglomerations of matter. In CDM models, the “late-time” Sachs-Wolfe effect works mostly on large angular scales (Bartolo et al., 2010). The third is related to the scattering of CMB photons from high energy electrons in hot coronae of galaxy clusters.
The distinction between the proper and induced CMB anomalies can be made by comparing the WMAP data with patterns created by other sources on the sky. For example, Verkhodanov et al. (2010) have found statistically significant correlations between CMB map temperatures and the distribution of gamma-ray bursts (GRB). Significant correlations of WMAP data with galaxy samples on large angular scales of to were found by Fosalba & Gastañaga (2004) for the Automated Plate Measuring galaxy survey, by Fosalba et al. (2003); Cabre et al. (2006) for the Sloan Digital Sky Survey, by Goto et al. (2012) for the wide-field infrared survey of galaxies and by other authors.
Since there exists a broad variety of opinions with respect to the nature of the anomalies seen in the WMAP data, further statistical studies of these data by using alternative techniques are desirable. In particular, it is important to continue with cross-correlations of CMB maps with spatial distributions of different high-redshift objects, such as galaxies, quasars or GRBs.
Most of the cross-correlations are based on two-dimensional distributions of extragalactic sources. Here we shall explore the third coordinate (redshift ) for checking whether some of the CMB fluctuations might be caused by distant concentrations of matter. We shall use supernovae (SNe) and GRB samples as the test objects that trace matter in the universe.
2 CMB temperature as a function of SN redshifts
For our analysis we have taken the list of supernovae (Bartunov et al., 2007) compiled by the Sternberng Astronomical Institute (Moscow) at http://www.sai.msu.su/sn/sncat which contains a large sample of SNe with known redshifts (5688 SNe for September 2011). We have also used sources from the GRB list maintained by J. Greiner Greiner (2008) at Max-Planck-Institut für extraterrestrische Physik (Garching) at http://www.mpe.mpg.de/~jcg/grbgen.html. With the updates from Cucciara et al. (2011) and the Swift data archive at http://www.swift.ac.uk this list contained 992 GRBs (as for October 2011).
The WMAP data products (The WMAP Group, 2010) were obtained from the NASA archive at http://lambda.gsfc.nasa.gov, and the software for processing these data was adopted from the comprehensive HEALPix package developed by Jet Propulsion Laboratory and available at http://healpix.jpl.nasa.gov (Gorski et al., 2005). Since most of the correlations between the CMB and extragalactic sources are found on large angular scales, we have used here the foreground reduced WMAP sky maps with the resolution corresponding to the HEALPix parameter .

.
Figure 1 shows the histogram of the WMAP pixel temperatures for the SNe locations as a function of SNe redshifts for the WMAP Internal Linear Combination (ILC) map with the redshift ranging from zero to 1.4.
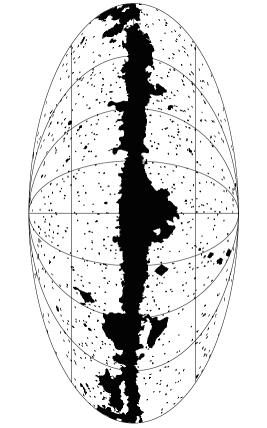
In order to avoid contamination from point sources and from the Galactic plane, we have used the WMAP temperature analysis mask (The WMAP Group, 2010) which includes point sources from external catalogues, as well all as the proper WMAP point source catalogue. It also takes into account the galactic foreground emission (Gold et al., 2011). We have taken the temperature analysis mask with higher resolution corresponding to (Figure 2) and applied it to the same higher resolution ILC-map, after which we degraded the masked ILC-map to the lower resolution of .
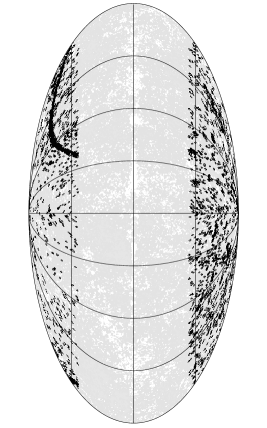
Additionally, we have restricted our SN and GRB samples to the galactic latitudes and rejected the WMAP pixels with temperature values mK, as such pixels are likely to correspond to artifacts or some extra point sources. The distribution of SNe over the sky within the selected latitude limits is shown in Figure 3.
.
As for the GRB data, only part of them contains photometric redshifts, so we included in our analysis the GRB pseudo-redshifts from the catalogue of Pélangeon et al. (2008) available at http://cosmos.ast.obs-mip.fr (the empirical methods for estimating pseudo-redshifts are described by Atteia 2003; Band et al. 2004).
By grouping the WMAP pixel temperatures into redshift bins with the bin size of 0.2 for GRBs and 0.01 for SNe, we have built two histograms for examining the possible relationship between the SN and GRB redshifts and CMB temperatures.

The histogram in Figure 1 shows the bin-averaged values of the WMAP temperatures for supernovae; the values for gamma-ray bursts are shown in Figure 4. The error-bars in these plots indicate the standard errors (SE) of the averages (or ) in each redshift bin calculated as , where is the number of SNe in the bin. The points corresponding to a single source in the bin are shown having no error-bars. The average WMAP pixel temperature for the selected latitude range, , was subtracted from the bin-averages (the positive shift of is due to the latitude selection effect, as the zero-average corresponds to the whole sky only). Although the data are noisy, one can notice a statistically significant deviation of from the average temperature , which is larger for the redshifts ranging from 0.5 to 1.0, where the average of is , and which is smaller for lower redshifts : , the average number of SNe in each redshift bin being 52 for and 6.5 for . For the whole sample of 2413 SNe within the selected latitude range, the average temperature is also significantly positively biased: . Such an excess of is larger than the current theoretical and observational estimates for the potential biases in the CMB temperatures due to extragalactic contamination (Knox et al., 1998; Santos et al., 2003; Zahn et al., 2005; Serra et al., 2008; Taburet et al., 2009).
The GRB histogram (Figure 4) is quite random and shows no temperature excess. For this histogram , which is statistically insignificant and which is what one would expect [the average number of GRBs in each redshift bin was 6.4 for the redshift range ]. One could attribute the difference between the two histograms to the differences between the GRB and SN distributions across the sky: the GRB sample is uniform, whereas the SN sample contains fields with high source densities, corresponding to specialised surveys of extragalactic sources. Figure 3 shows the sky distribution of the SNe used here for calculating the temperature-redshift histogram. There is a distinctive strip seen in this map that contains a larger number of SNe. It corresponds to the SDSS Supernova Survey conducted for a narrow equatorial zone of -width (Frieman et al., 2008). In order to check whether the excess of the WMAP pixel temperatures is due to this SN subsample, we have calculated a separate -histogram containing only the SNe with (shown in Figure 5), and we have found that this histogram reveals a statistically-significant positive shift of the average temperature for low redshifts , whereas for higher redshifts the shift is not significant: , which indicates that the found temperature shift for higher redshifts comes from the rest of the SN sample, which is distributed more uniformly across the sky than the SDSS Supernova Syrvey.
In order to distinguish between possible sources of the detected anomaly we have calculated similar histograms for three different WMAP frequency bands, separately for the Q, V and W bands (keeping in mind that, for instance, the Sunyaev-Zeldovich effect is energy-dependent). These three histograms are similar to each other and to the histogram shown in Figure 1, their linear regression slopes varying only slightly: , and for the Q, V and W bands, respectively. This means that a larger sample of SNe (which might become available in the future) is needed to get a more clear picture about the nature of the detected correlation. A similar band-independent correlation between WMAP temperatures and large-scale structures traced by galaxies was found by Goto et al. (2012) for the Wide-field Infrared Survey Explorer data, which was attributed by the authors to the integrated Sachs-Wolfe effect.

Yet another check ensuring that the seen correlation is not due to a systematic error consists in randomising the SN positions on the sky. For this purpose, we have used the same SN sample with assigned random coordinates, while maintaining their redshift-distribution, as well as their higher density in the equatorial zone corresponding to the SDSS subsample. The histogram for this randomised SN locations (Figure 6) does not reveal any significant temperature anomalies, for both low () and high () redshift ranges, with the average for the whole SN sample being . So, the found anomaly is likely to be real.

3 Discussion
In our view, this anomaly can be interpreted in a number of different ways, of which we would like to mention the following:
-
-
it might correspond to the secondary CMB anisotropies caused by dust associated with clusters and superclusters of galaxies at moderate redshifts ;
-
-
it could be related to secondary and tertiary ionisation of the foreground media during the post-reionisation epoch;
-
-
it could be caused by large-scale inhomogeneities in matter distribution, such as voids, filaments or walls, which could alter the energies of the primordial CMB photons through the integrated Sachs-Wolfe and Rees-Sciama effects.
These effects are broadly discussed in the literature, so let us just briefly outline how they contribute to the CMB anisotropies.
Dust contribution. The SN and GRB host galaxies contain dust whose thermal radiation contributes to the CMB. It is known that dust in spiral galaxies has a wide range of temperatures (Rowan, 1992; Franceschini & Andreani, 1995) which makes it difficult to separate CMB anisotropies caused by dust from the primordial CMB anisotropies. Recent Hershel submillimiter observations have shown the presence of large dust masses in high-redshift galaxies (Santini et al., 2010). Similarly, large dust masses have been measured in local universe galaxies (Galliano et al., 2005; Bendo et al., 2006; Galametz et al., 2009; Grossi et al., 2010; O’Halloran et al., 2010). So, indeed, there is a possibility that dust from galaxies at all redshifts contributes to the CMB temperature fluctuations, which, in turn, would result in a positive correlation between CMB temperatures and overdensities of galaxies – see, e.g., Ho et al. (2008). The possible impact of dusty galaxy clusters on cosmological parameter estimates was also discussed by Serra et al. (2008), Dunkley et al. (2011) and Millea et al. (2012).
Ionised gas. Another possible source of secondary anisotropies in the CMB power spectrum is the Thomson scattering on free electrons in regions of ionised gas with bulk peculiar velocities produced at the epochs of reionisation (McQuinn et al., 2005; McQuinn, 2010) and post-reionisation. Local variations in the ionised gas increase temperature anisotropies through the kinetic Sunyaev-Zeldovich effect, the primordial temperature perturbations being damped as , where is the Thomson scattering optical depth.
The WMAP best-fitting model for the large-scale polarisation anisotropy favours a mean redshift of reionisation of (Bennett et al., 2003; Komatsu et al., 2009) with (Dunkley et al., 2009). The observed spectra of quasars indicate a rapid change in the ionising background at the redshift , so that reionisation is completed at that epoch. By contrast, there are many uncertainties regarding the redshift corresponding to the beginning of reionisation. The polarisation anisotropies models are based on a number of assumptions regarding the density distribution of the baryons, quasar physics, etc., much of which are unknown. If reionisation occurred gradually over a period of time, then it started as long ago as (Kogut et al., 2003), so that the values of or even (Kogut et al., 2003; Spergel et al., 2003) is likely to be underestimated. As was shown by Gnedin (2004), one can construct a posteriori models that produce a large value of the Thomson scattering optical depth (up to ) consistent with the WMAP measurements. Moreover, the reionisation history could be much more complex than is usually thought (Barkana & Loeb, 2001; Miralda-Escudé, 2003; Bromm, 2004; McQuinn et al., 2007). According to Wyithe & Loeb (2003); Cen (2003); Himan & Holder (2003); Bromm (2004), there might have been more than one reionisation period, with the first reionisation occurring at due to massive population III stars, followed by a period of partial recombination, and, finally, the reionisation at . Giant blobs of gas are known to surround galaxies and galaxy clusters (Francis et al., 1996; Steidel et al., 2000; Matsuda et al., 2004; Hayes et al., 2011). Some of partially ionised blobs remaining after the end of the reionisation epoch at could screen and dampen the CMB fluctuations along certain directions at much lower redshifts (this might be yet another possible explanation of the extreme Cold Spot anomaly).
Besides the afore-mentioned damping of the primordial fluctuations, there exists an effect caused by inhomogeneous reionisation which leads to the generation of new temperature fluctuations on small angular scales (Babich & Loeb, 2006, 2007; Holder et al., 2007) due to the bulk motion of electrons in overdense regions (Ostriker & Vishniac, 1986). The patchiness of reionisation remains theoretically uncertain and observationally unconstrained, whereas its contribution to the CMB fluctuations is likely to be comparable to, or larger than, that of the Thomson scattering effect.
The upper limits of on the CMB anisotropies due to the secondary thermal and kinetic Sunyaev-Zeldovich effects were estimated by Leuker et al. (2010) and Shirokoff et al. (2011). These are smaller than the amplitude of the anomaly we have reported here.
Large-scale structure. Both CMB anisotropy and large-scale structures of the universe (mapped by galaxy surveys) are related to the genesis and evolution of primordial perturbations and to the cosmological model and its parameters. However, due to the existence of large-scale structures in the universe (high-density knots, filaments, walls etc.) there are gravitational potential wells all over the sky which distort the CMB power spectrum on large angular scales through the integrated Sachs-Wolfe and Rees-Sciama effects. The existence of correlations between WMAP maps and large scale structures is well-known (Crittenden & Turok, 1996; Kinkhabwala & Kaminkowski, 1999; Boughn & Crittended, 2004; Cabre et al., 2006; Stefanescu & Popa, 2010), so the correlation which we are reporting here is likely to be of a similar kind. Granett et al. (2008) measured the amplitude of the temperature deviations due to the integrated Sachs-Wolfe effect for galaxy superclusters in SDSS, which was found to be of of the order of . This is in a good agreement with the reported here anomaly for low redshifts: , whereas the larger anomaly for higher redshifts, , exceeds the theoretical amplitudes for the integrated Sachs-Wolfe effect. This should be studied in more detail in the future.
As we have seen, many factors of the foreground contamination could distort the primordial angular power spectrum of CMB fluctuations. All these effects create a rather thick patchy screen between the epoch of last-scattering and the current epoch. This screen might be responsible for a great deal of the observed CMB anisotropy.
4 Conclusions
The correlation between the SNe redshifts and WMAP temperatures indicates that the WMAP data are still contaminated by extragalactic foreground, despite being thoroughly cleaned from known foreground sources. Thus, further studies are important in order to clarify the question concerning the fraction of the primordial fluctuations remaining in the CMB maps, as the knowledge of the power spectrum of these fluctuations is pivotal for the calculation of the parameters of the standard cosmological model.
acknowledgements
The research has made use of the following archives: the Legacy Archive for Microwave Background Data Analysis operated by NASA’s Goddard Space Flight Center; the Hierarchical Equal Area iso-Latitude Pixelisation (HEALPix) software packages maintained by the Jet Propulsion Laboratory, California Institute of Technology, Pasadena; the list of GRB sources maintained by J.Greiner, Max-Planck -Institut für extraterrestrische Physik, Garching; the Leicester Database and Archive Service (LEDAS) operated by the University of Leicester; the GRB pseudo-redshift catalogue maintained by A. Pélangeon and J.-L. Atteia at Laboratoire d’Astrophysique de Toulouse-Tarbes, Université de Toulouse; and the Supernovae Catalogue maintained by Sternberg Astronomical Institute, Moscow State University. The authors appreciate the helpful comments made by Dr. L.V. Morrison. One of the authors (V.V. Orlov) is thankful to the Russian President Grants Council for the State Support of the Leading Scientific Schools (the Grant NSCH-3290.2010.2).
References
- Ashoorioona et al. (2011) Ashoorioona A., Chialvab D., Danielssona U., 2011, J. Cosm. Astropart. Phys., 06, 034
- Atteia (2003) Atteia J.-L., 2003, A&A, 407, L1
- Ayaita et al. (2010) Ayaita Y., Weber M., Wetterich C., 2010, Phys. Rev. D, 81, 023507
- Babich & Loeb (2006) Babich D., Loeb A., 2006, ApJ, 640, 1
- Babich & Loeb (2007) Babich D., Loeb A., 2007, MNRAS, 374, L24
- Band et al. (2004) Band D. L., Norris J. P., Bonnell J. T., 2004, ApJ, 613, 484
- Barkana & Loeb (2001) Barkana R., Loeb A., 2001, Phys. Rep., 349, 125
- Bartolo et al. (2010) Bartolo N., Mattarese S., Riotto A., 2010, Advances in Astron., 2010, 75
- Bartunov et al. (2007) Bartunov O. S., Tsvetkov D. Yu., Pavlyuk N. N., 2007, Highlights in Astr., 14, 316
- Bendo et al. (2006) Bendo G. J., Dale D. A., Draine B. T., et al., 2006, ApJ, 652, 283
- Bennett et al. (2003) Bennet C. L., Halpern M., Hinshaw G., et al., 2003, ApJS, 148, 1
- Bennett et al. (2011) Bennett C., Hill R. S., Hinshaw G., et al., 2011, ApJS, 192, 17
- Bernui (2008) Bernui A., 2008, Phys. Rev. D 78, 063531
- Bernui & Rebouças (2010) Bernui A., Rebouças M. J., 2010, Phys. Rev. D 81, 063533
- Boughn & Crittended (2004) Boughn S. P., Crittended R. G., 2004, Nature, 427, 45
- Bromm (2004) Bromm V, 2004, Publ. Astron. Soc. Pacific, 116, 103
- Cabre et al. (2006) Cabré A., Gaztañaga E., Manera M., Fosalba P., Castander F., 2006, MNRAS, 372, L23
- Cen (2003) Cen R., 2003, ApJ, 591, 12
- Copi et al. (2010) Copi C. J., Huterer D., Schwarz D. J., Starkman G. D., 2010, Advances in Astron., 2010, 847541
- Crittenden & Turok (1996) Crittenden R. G., Turok N., 1996, Phys. Rev. Lett., 76, 575
- Cruz et al. (2007) Cruz M., Cayón L., Martínez-González E., Vielva P., Jin J., 2007, ApJ, 655, 11
- Cucciara et al. (2011) Cucciara A., Levan A. J., Fox D. B., et al., 2011, ApJ, 736, 7
- De Oliveira-Costa et al. (2004) De Oliveira-Costa A., Tegmark M., Zaldarriaga M., Hamilton A., 2004, Phys. Rev. D 69, 063516
- De Troia et al. (2007) De Troia G., Ade P. A. R., Bock J. J., et al., 2007, ApJ, 670, L73
- Dunkley et al. (2009) Dunkley J., Komatsu E., Nolta M. R., et al., 2009, ApJS, 180, 306
- Dunkley et al. (2011) Dunkley J., et al., 2011, ApJ, 739, 52
- Eriksen et al. (2004) Eriksen H. K., Hansen F. K., Banday A. J., Górski K.M., Lilje P.B., 2004, ApJ, 605, 14
- Ferreira et al. (1998) Ferreira P. G., Magueijo J., Gorski K. M., 1998, ApJ, 503, L1
- Fosalba et al. (2003) Fosalba P., Gastañaga E., Castander, F., 2003, ApJ, 597, L89
- Fosalba & Gastañaga (2004) Fosalba P., Gastañaga E., 2004, MNRAS, 350, L37
- Franceschini & Andreani (1995) Franceschini A., Andreani P., 1995, ApJ, 440, L5
- Francis et al. (1996) Francis P. J., Woodgate B. E., Warren S. J., et al., 1996, ApJ, 457, 490
- Frieman et al. (2008) Frieman J. A., Basset B., Becker A., et al., 2008, AJ, 135, 338
- Galametz et al. (2009) Galametz M., Madden S., Galliano F., et al., 2009, A&A, 508, 645
- Galliano et al. (2005) Galliano F., Madden S. C., Jones A. P., Wilson C.D., Bernard J.-P., 2005, A&A, 434, 867
- Gnedin (2004) Gnedin N. Y., 2004, ApJ, 610, 9
- Gold et al. (2011) Gold B, Odegard N., Weiland J. L., et al., 2011, ApJS, 192, 15
- Gorski et al. (2005) Gorski K. M., Hivon E., Banday A. J., Wandelt B.D., Hansen F.K., Reinecke M., Bartelmann M., 2005, ApJ, 622, 759
- Goto et al. (2012) Goto T., Szapudi I., Granett B. R., 2012, MNRAS, 422, 77
- Granett et al. (2008) Granett B. R., Neyrinck M. C., Szapudi I., 2008, ApJ, 683, L99
- Granett et al. (2010) Granett B. R., Szapudi I., Neyrinck M. C., 2010, ApJ, 714, 825
- Greiner (2008) Greiner J., in Trumper J.E. & Hasinger G., eds., The Universe in X-Rays, Springer-Verlag, Berlin Heidelberg, p.435
- Grossi et al. (2010) Grossi M., Hunt L. K., Madden S., et al., 2010, A&A, 518, L52
- Hayes et al. (2011) Hayes M., Scarlata C., Siana B., 2011, Nature, 476, 304
- Himan & Holder (2003) Haiman Z., Holder G. P., 2003, ApJ, 595, 1
- Ho et al. (2008) Ho S., Hirata C. M., Padmanabhan N., Seljak U., Bahcall N., 2008, Phys. Rev. D, 78, 043519
- Holder et al. (2007) Holder G. P., Iliev I. T., Mellema G., 2007, ApJ, 663, L1
- Inoue (2012) Inoue K. T., 2012, MNRAS, 421, 2731
- Kinkhabwala & Kaminkowski (1999) Kinkhabwala A., Kaminkowski M., 1999, Phys. Rev. Lett., 82, 4172
- Knox et al. (1998) Knox L., Scoccimaro R., Dodelson S., 1998, Phys. Rev. Lett., 81, 2004
- Kogut et al. (2003) Kogut A., Spergel D. N., Barnes C., 2003, ApJS, 148, 161
- Komatsu et al. (2003) Komatsu E., Kogut A., Nolta M. R., et al., 2003, ApJS, 148, 119
- Komatsu et al. (2009) Komatsu E., Dunkley J., Nolta M. R., 2009, ApJS, 180, 330
- Land & Magueijo (2005) Land K., Magueijo J., 2005, MNRAS, 362, 838
- Larson & Wandelt (2004) Larson D. L., Wandelt B. D., 2004, ApJ, 613, L85
- Larson & Wandelt (2005) Larson D. L., Wandelt B. D., 2005, arxiv:astro-ph/0505046
- Leuker et al. (2010) Leuker M., Reichardt C. L., Schaffer K. K., et al., 2010, ApJ, 719, 1045
- Liguori et al. (2003) Liguori M., Matarrese S., Moscardini L., 2003, ApJ, 597, 57
- Liguori et al. (2007) Liguori M., Yadav A., Hansen F. K., 2007, Phys. Rev. D, 76, 105016
- Longo (2011) Longo M. J., 2011, Phys. Lett.B, 699, 224
- Magueijo & Sorkin (2007) Magueijo J., Sorkin R. D., 2007, MNRAS, 377, L39
- Martínez et al. (2006) Martínez-González E., Cruz M., Cayón L., Vielva P., 2006, New Astron. Rev., 50, 875
- Matsuda et al. (2004) Matsuda Y., Yamada T., Hayashino T., et al., 2004, Astron. J., 128, 569
- McQuinn et al. (2005) McQuinn M., Furlanetto S. R., Hernquist L, Zahn O., Zaldarriaga M., 2005, ApJ, 630, 643
- McQuinn et al. (2007) McQuinn M., Lidz A., Zahn O., Dutta S., Hernquist L., Zaldarriaga M., 2007, MNRAS, 377, 1043
- McQuinn (2010) McQuinn M., 2010, Astron. Soc. Pac. Conf. Ser., 432, 65
- Millea et al. (2012) Millea M., Doré O., Dudley J., Holder G., Knox L., Shaw L., Song Y.-S., Zahn O., 2012, ApJ, 746, 4
- Miralda-Escudé (2003) Miralda-Escudé J., 2003, Science, 300, 1904
- Mukherjee & Wang (2004) Mukherjee P., Wang Y., 2004, ApJ, 613, 51
- Naselsky et al. (2003) Naselsky P. D., Doroshkevich A. G., Verkhodanov O. V., 2003, ApJ, 599, L53
- O’Halloran et al. (2010) O’Halloran B., Galametz M., Madden S.C., et al., 2010, A&A, 518, L58
- Ostriker & Vishniac (1986) Ostriker J. P., Vishiac E. T., 1986, ApJ, 306, L51
- Park (2004) Park C.-G., 2004, MNRAS, 349, 313
- Pélangeon et al. (2008) Pélangeon A., Atteia J.-L., Nakagawa Y., et al., 2008, A&A, 491 157
- Pogosyan et al. (2011) Pogosyan D., Pichon C., Gay C., 2011, Phys. Rev.D, 84, 083510
- Rees & Sciama (1968) Rees M. J., Sciama D. W., 1968, Nature, 217, 511
- Rakic & Schwarz (2007) Rakic A., Schwarz D. J., 2007, Phys. Rev. D, 75, 103002
- Rowan (1992) Rowan-Robinson M., 1992, MNRAS, 258, 787
- Sachs & Wolfe (1967) Sachs R. K., Wolfe A. M. 1967, ApJ, 147, 73
- Santini et al. (2010) Santini P., Maiolino R., Magnelli B., et al., 2010, A&A, 518, L154
- Santos et al. (2003) Santos M. G., Cooray A., Haiman Z., Knox L., Ma C.-P., 2003, ApJ, 598, 756
- Schwarz et al. (2004) Schwarz D. J., Starkman G. D., Huterer D., Copi C.J., 2004, Phys. Rev. Lett., 93, 221301
- Serra et al. (2008) Serra P., Cooray A., Amblard A., 2008, Phys. Rev. D 78, 043004
- Shirokoff et al. (2011) Shirokoff E., Reichardt C. L., Shaw L., et al., 2011, ApJ, 736, 61
- Spergel et al. (2003) Spergel, D. N., Verde L., Peiris H. V., et al, 2003, ApJS, 148, 175
- Stefanescu & Popa (2010) Stefanescu P., Popa L. A., 2010, Romanian Rep. Phys., 62, 887
- Steidel et al. (2000) Steidel C. C., Adelberger K. L., Shapley A. E., Pettini M., Dickinson M., Giavalisco M., 2000, ApJ, 532, 170
- Sunyaev & Zeldovich (1970) Sunyaev R. A., Zeldovich Ya. B., 1970, Astrophys. Space Sci., 7, 3
- Szapudi et al. (2001) Szapudi I., Prunet S., Pogosyan D., Szalay A.S., Bond J.R., 2001, ApJ, 548, L115
- Taburet et al. (2009) Taburet N., Aghanim N., Douspis M., Langer M., 2009, MNRAS, 392, 1153
- The WMAP Group (2010) The WMAP Group, 2010, in Limon M. et al., eds., Wilkinson Wicrowave Anisotropy Probe (WMAP): Seven-Year Explanatory Supplement. NASA/GSFC, Greenbelt, MD (http://lambda.gsfc.nasa.gov)
- Then (2006) Then H, 2006, MNRAS, 373, 139
- Vanchurin (2009) Vanchurin V., 2009, arXiv:0906.4954[astro-ph.CO]
- Verde et al. (2001) Verde L., Jimenez R., Kamionkowski M., Matarrese S., 2001, MNRAS, 325, 412
- Verkhodanov et al. (2010) Verkhodanov O. V., Sokolov V. V., Khabibullina M. L., Karpov S. V., 2010, Astrophys. Bull., 65, 238
- Vielva et al. (2004) Vielva P., Martínez-González E., Barreiro R.B., Sanz J.L., Cayón L., 2004, ApJ, 609, 22
- Vielva et al. (2007) Vielva P., Wiaux Y., Martinez-Gonzalez E., Vandergheynst P., 2007, MNRAS, 381, 932
- Vielva (2010) Vielva P., 2010, Adv. Astron., 2010, 592094
- Wyithe & Loeb (2003) Wyithe J. S. B., Loeb A., 2003, ApJ, 588, L69
- Wu et al. (2001) Wu J. H. P., Balbi A., Borrill J., et al., 2001, Phys. Rev. Lett., 87, 251303
- Zahn et al. (2005) Zahn O., Zaldarriaga M., Hernquist L., McQuinn M., 2005, ApJ, 630, 657