Ubiquitous torsional motions in type II spicules
Abstract
Spicules are long, thin, highly dynamic features that jut out ubiquitously from the solar limb. They dominate the interface between the chromosphere and corona and may provide significant mass and energy to the corona. We use high-quality observations with the Swedish 1-m Solar Telescope to establish that so-called type II spicules are characterized by the simultaneous action of three different types of motion: (i) field-aligned flows of order 50-100 km s-1, (ii) swaying motions of order 15-20 km s-1, and (iii), torsional motions of order 25-30 km s-1. The first two modes have been studied in detail before, but not the torsional motions. Our analysis of many near-limb and off-limb spectra and narrow-band images using multiple spectral lines yields strong evidence that most, if not all, type-II spicules undergo large torsional modulation and that these motions, like spicule swaying, represent Alfvénic waves propagating outward at several hundred km s-1. The combined action of the different motions explains the similar morphology of spicule bushes in the outer red and blue wings of chromospheric lines, and needs to be taken into account when interpreting Doppler motions to derive estimates for field-aligned flows in spicules and determining the Alfvénic wave energy in the solar atmosphere. Our results also suggest that large torsional motion is an ingredient in the production of type-II spicules and that spicules play an important role in the transport of helicity through the solar atmosphere.
Subject headings:
Sun: chromosphere - Sun: corona - Sun: oscillations - Sun: magnetic fields1. Introduction
Between the photosphere and corona lies the chromosphere, a region of relatively cool plasma that is most conspicuous in the hydrogen H Balmer line. The upper chromosphere is dominated by spicules, thin jets of chromospheric plasma that reach heights of km or more above the photosphere. Although spicules were described already by Secchi in 1877, understanding their physical nature has progressed only slowly (reviews by Beckers, 1968; Sterling, 2000). The launch of the Hinode satellite (Kosugi et al., 2007) and the combined use of adaptive optics and image post-processing (van Noort et al., 2005) in ground-based observing have revolutionized our view of spicules.
There are (at least) two types (De Pontieu et al., 2007b). Type i spicules reach heights of 2-9 Mm, show up- and downward velocities of 10–30 km s-1, and have lifetimes of 3–10 minutes. They probably correspond to on-disk dynamic fibrils caused by shock waves that propagate upward into the chromosphere (Hansteen et al., 2006; Rouppe van der Voort et al., 2007; De Pontieu et al., 2007a) (see also Suematsu et al., 1995). Type ii spicules reach larger heights at velocities of order 50–100 km s-1. They have shorter lifetimes, of order 100 s, and usually only exhibit upward motion before their rapid fading in the chromospheric lines in which they are detected. On the disk they appear as rapidly moving absorption features in the blue wings of chromospheric lines (Langangen et al., 2008; Rouppe van der Voort et al., 2009). In this paper we focus on this intriguing class of features.
Our previous studies suggest that type ii spicules represent impulsively accelerated chromospheric material that is continuously heated while it rises (De Pontieu et al., 2009, 2011). The cause of the heating and acceleration are unknown, but a magnetic process such as reconnection and/or flux emergence is most likely (De Pontieu et al., 2007b; Sterling et al., 2010; Martínez-Sykora et al., 2011).
Type ii spicules show other motions in addition to radial outflow. In the Ca ii H line they are seen to sway to-and-from transversely with amplitudes of order 10–20 km s-1 and periodicities of 100–500 s, suggesting Alfvénic waves (De Pontieu et al., 2007c). The continuation of these motions in transition region and coronal lines suggests that they may help drive the solar wind (McIntosh et al., 2011).
Other types of motion are less well established. Suematsu et al. (2008) reported that some spicules appear as double threads with evidence of spinning motion. Curdt & Tian (2011) and Curdt et al. (2012) suggest that similar spinning explains the tilts of ultraviolet lines in so-called explosive events producing larger-scale macro spicules. Spectral-line tilts were noted earlier in observations at the limb and also attributed to spicule rotation (Beckers, 1972), or not interpreted (Houtgast & Namba, 1979).
In this paper we definitely confirm the indications for twisting spicular motions by unequivocally detecting torsional spicule modulation in limb spectroscopy and imaging spectroscopy with unprecedented spectral and spatial resolution.
2. Observations
We analyze various data sets obtained with the Swedish 1-m Solar Telescope (SST, Scharmer et al., 2003a) on La Palma: slit spectroscopy with the TRI-Port Polarimetric Echelle-Littrow spectrograph (TRIPPEL, Kiselman et al., 2011) and imaging spectroscopy with the CRisp Imaging SpectroPolarimeter (CRISP, Scharmer et al., 2008). All observations used adaptive optics.
With the TRIPPEL spectrograph we observed the Ca II H line at 396.8 nm with nominal spectral resolution of 1.6 pm. A slit-jaw camera of the same type was slaved to the spectrum camera. The data were binned to 0.49 pm spectral and 0.068″ spatial pixel sizes. The spectrograms were corrected for dark current, gain variations, and spectrograph distortions following Langangen et al. (2007). We use a 55 min duration, 0.91 s cadence sequence of Ca II H spectrograms taken on 2009 October 8 in excellent seeing. The slit was set parallel to the limb at various heights above the limb ranging from 3″ to 10″. The exposure time was 800 ms.
CRISP contains a dual Fabry-Pérot interferometer and allows for fast (50 ms) wavelength tuning within a spectral region. High spatial resolution and precise alignment between the sequentially taken images for different tunings is achieved with the image restoration technique of van Noort et al. (2005) and Rouppe van der Voort et al. (2009). In section 3 we present results from two CRISP data sets: a 17 min sequence at the ultra-high cadence of 0.44 s sampling H (656.3 nm) only at mÅ ( km s-1), registering the limb near AR11230 on 2011 June 11, and an earlier 36 min, 17 s cadence sequence of finely spaced H and Ca ii 854.2 nm profile samplings registering the limb on 2010 June 27.
3. Results
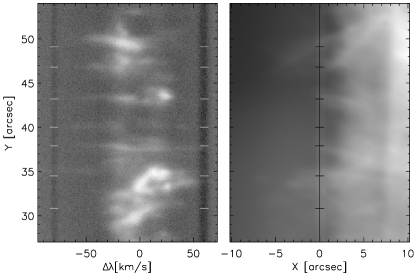
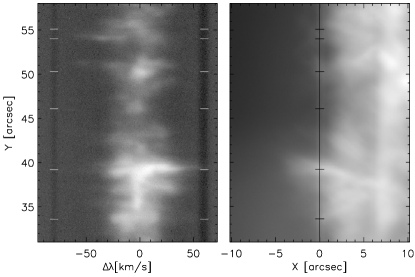
Our various observations all show clear evidence of torsional motions on very small scales, of order 0.7″ or less. We first demonstrate these in the TRIPPEL spectra. Since the slit was oriented approximately parallel to the limb, it crossed many spicules. In Figure 1 (top row) we show two cuts, selecting moments when the slit was located at least several arcseconds above the limb to avoid the enormous line-of-sight superposition at and just above the limb. The slit-jaw images indeed show many distinct spicules that seem at least partially resolved. Each spectral panel contains multiple cases in which a spicule appears as a thin bright streak across the spectrum, with a small tilt from the horizontal wavelength direction and a substantial offset from nominal line center. We detected such behavior throughout the 55-min sequence at all sampled heights. The tilted-streak morphology indicates relative redshift on one side of a spicule, blueshift on the other. This reversal in transverse motion is the signature of torsional spicule motion. In addition, the substantial offsets of the tilted streaks from nominal line center can be understood as the superposition of swaying motion and a projection of field-aligned flow onto the line-of-sight.
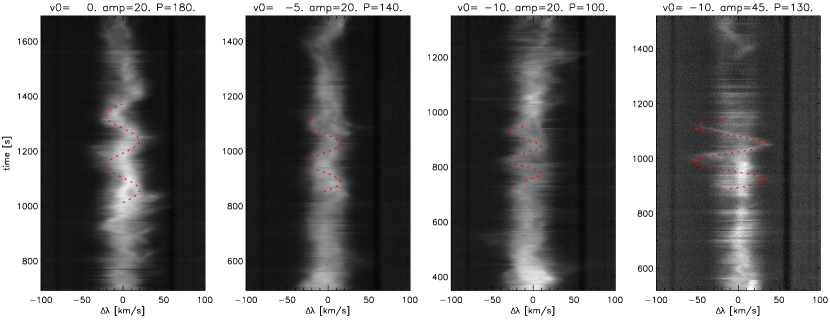
Next, we examine how our data can be used to separate and constrain the magnitudes and other properties of these three types of spicular motion. Figure 1 (bottom row) shows the temporal variation of the Ca II H profile. Although significant line-of-sight superposition occurs, we find clear evidence of quasi-sinusoidal episodes in the Dopplershifts. To get an idea of the typical amplitudes and periods of such oscillations we overplot simple functions and find that amplitudes of order 20-40 km s-1 and periods of order 100-200 s are common. Swaying and torsional motions can both produce such sinusoidal signature in plots, but they have a different appearance in a time sequence of successive plots, with swaying motions showing wiggling of the entire streak-like feature whereas torsional modulation shows up as a tilted streak that shrinks into a more vertical feature and then becomes tilted with opposite sign. Detailed inspection of many such plots showed that temporal undulation as in Figure 1 (bottom row) is sometimes associated with swaying and sometimes with torsional modulation.
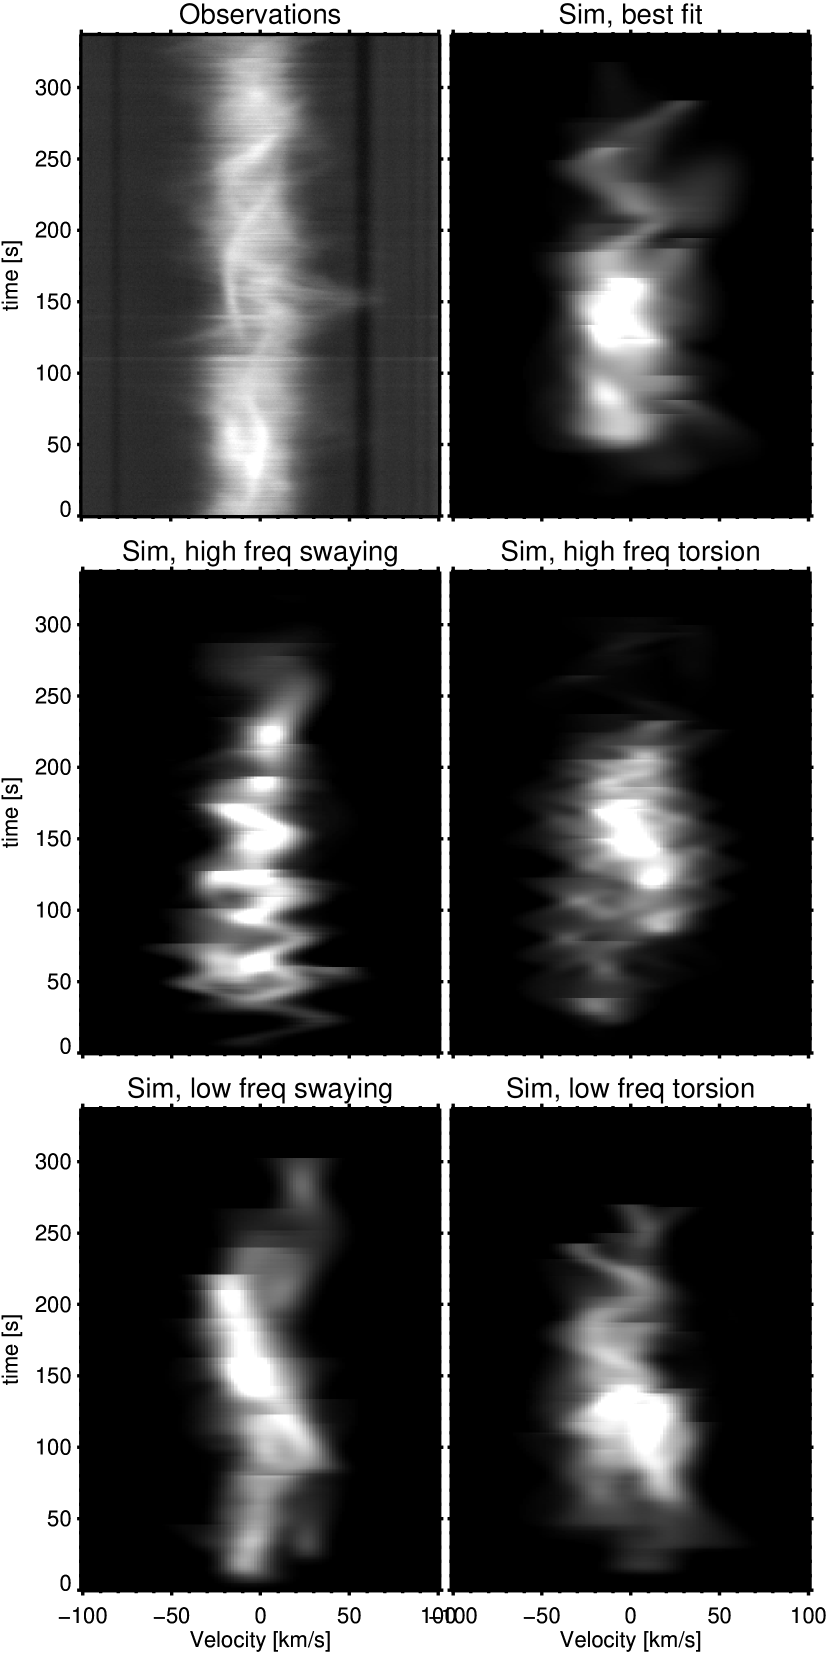
Our data inspection thus reveals evidence for three distinct types of spicular motion. Given the limitations of our data sets (in particular the enormous line-of-sight superposition at the limb and variations in seeing quality), we find that the best method to derive statistical properties of these different motions is to compare the observations with Monte Carlo simulations. We adapt methodology used previously by De Pontieu et al. (2007c) and McIntosh et al. (2008): we consider spicules and impose on each a field-aligned flow , a torsional motion , and a swaying motion . Inspired by our earlier analyses of type ii spicules we assume that, during their lifetime , they continuously grow with constant velocity along a straight path, inclined by an angle from the vertical and with an azimuth angle , until they fade rapidly from view. The torsional and swaying motions are assumed to have periods and , respectively, with random phase.
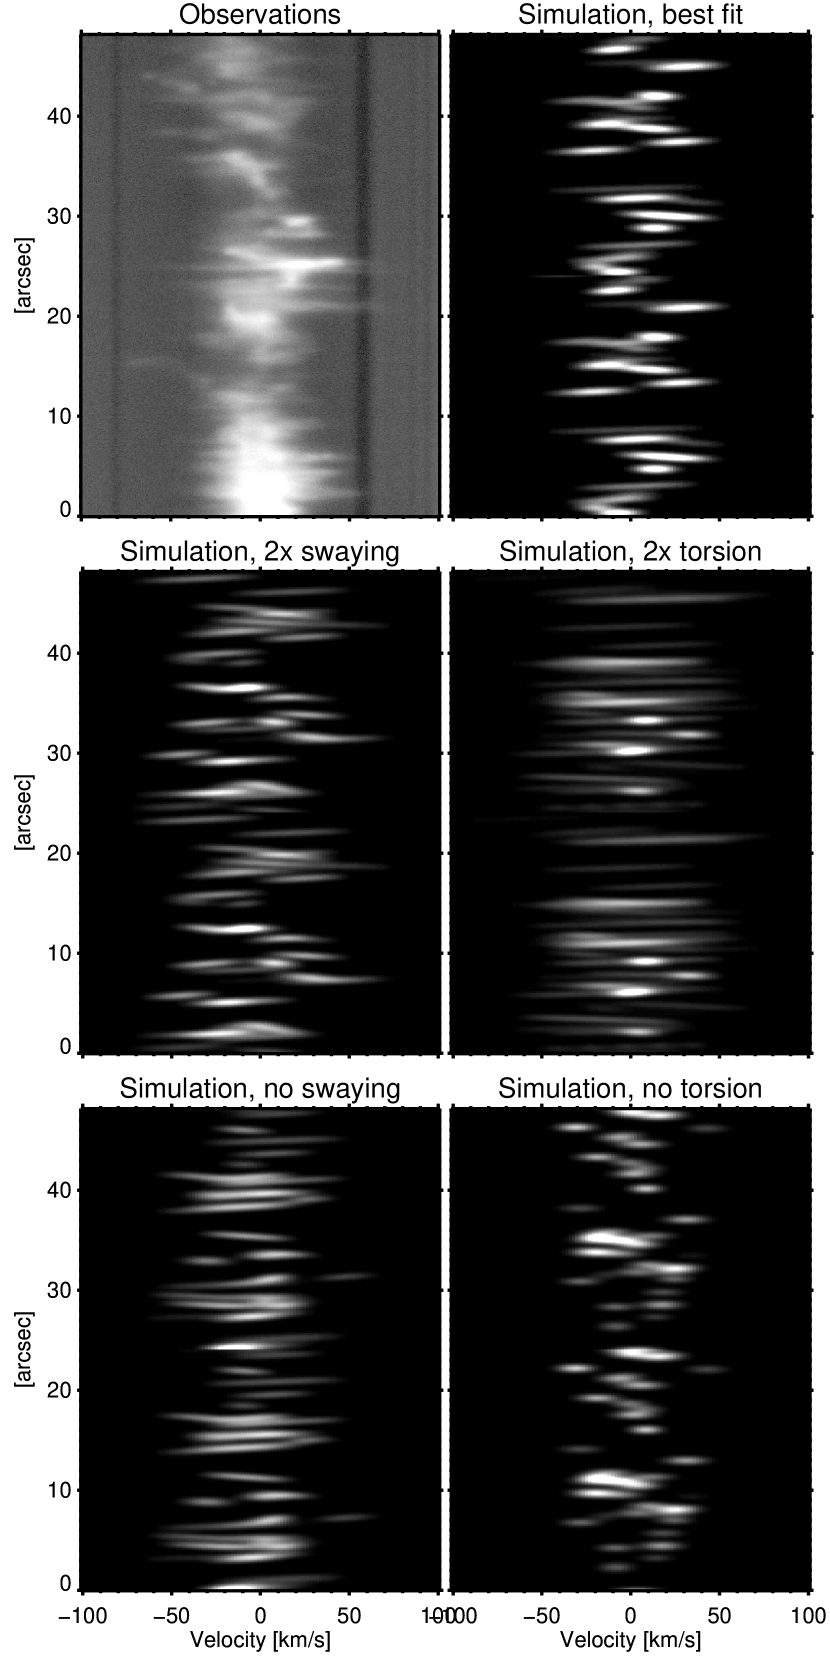
Figures 2 and 3 shows examples of comparisons between observed and plots and results from these Monte Carlo simulations for different parameter choices. We made many such plots with large parameter variation and defined a best-fit solution by selecting parameter combinations that reproduce the observed behavior the best. Per spicule this best-fit choice takes randomly from a Gaussian distribution around 60 km s-1 with standard deviation km s-1 (similar to what is found by Pereira et al., in prep.), from a Gaussian distribution around 120 s with s (Pereira et al., in prep.), from a Gaussian distribution around 20 degrees with degrees (based on slit-jaw images), from a uniform distribution over 0-360 degrees, from a Gaussian distribution around 30 km s-1 with km s-1, from a Gaussian distribution around 15 km s-1 with km s-1, and both and from a uniform distribution over 100-300 s. Comparison of the and panels for this best-fit solution with the observations in the top left panels of Figures 2 and 3 and in Figure 1 shows that the best-fit solution reproduces, statistically, the appearance of both types of data, with a similar multitude of slightly tilted streak-like features in and similar sinusoidal swings in .
How well defined are the best-fit parameters, given the large number of free parameters in our simulations? To answer this question we ran multiple simulations in which we changed the distribution for only one parameter, keeping all others fixed. Examples are given in the lower rows of Figures 2 and 3. In the first panel of the second row (Fig. 2) the mean swaying amplitude is doubled and gives an overall zig-zag pattern with too many extremes. Similarly, doubling the mean torsional amplitude gives streaks that are too wide in velocity. Removing the swaying (bottom-left panel) produces too little zig-zag motion in . No torsional motion gives streaks that are too narrow in velocity. Similarly, in the panels of Fig. 3, doubling the frequencies to periods of 50-100 s of the swaying or torsional motion leads to too many wiggles, whereas lower frequencies (periods 300-600 s) yield too few wiggles. Note that it is more difficult to determine the periods since these often exceed the spicule lifetimes (see also De Pontieu et al., 2007c),
In summary, our Monte-Carlo analysis provides reasonably well-defined constraints. In order to reproduce the appearance of our limb spectra the torsional and swaying motions should be of order 30 and 15 km s-1, respectively, with periodicities of order s.
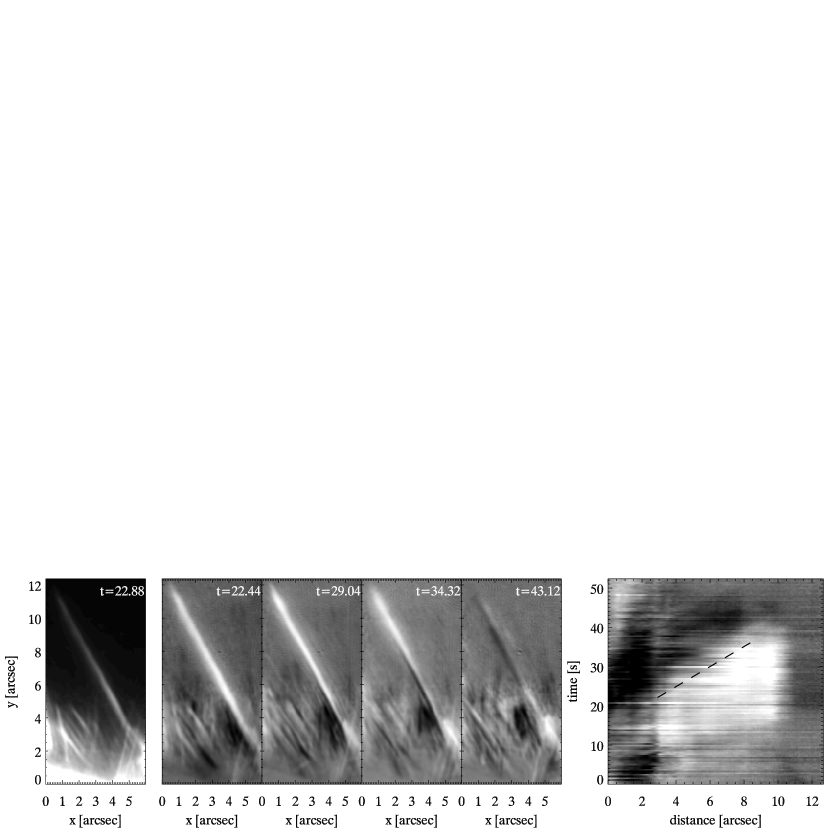
The next issue is whether the transverse swaying and torsional modulations represent propagating waves. Since our limb spectra sample only one height above the limb at a time, we address this question with CRISP imaging spectroscopy in H. The ultra-high cadence sequence permits the construction of Doppler images by subtracting the images taken in the red and blue wings (corresponding to km s-1 Dopplershift). In these we often observe very fast propagation of the Doppler signal. An example is shown in Figure 4 where the apparent phase speed is 285 km s-1. Values in the range 100-300 km s-1 are common. This is the order of magnitude expected for the Alfvén speed in structures with densities of order cm-3 (Beckers, 1968) and magnetic field strengths of order 10-30 Gauss (Centeno et al., 2010).
Determining whether these Dopplershift modulations represent swaying or torsional motion is not straightforward. In our Dopplergrams, torsional modulation will show up as a black-and-white pattern across a spicule only when the sum of the swaying motion and projection of the field-aligned flow happens to be zero. The large offsets from line center in Figure 1 suggest that such cancellation does not occur often. Direct separation of the torsional and swaying modes is impeded by the combination of very high phase speed, sparse wavelength sampling, and relatively low cadence, i.e., lack of simultaneity between the red- and blue-wing samplings. Nevertheless, the black-and-white pattern of the spicule at s in Figure 4 seems direct evidence of significant torsional motion. Its propagation at about 300 km s-1 provides further support that the observed rotational motions are a signature of torsional Alfvén waves that propagate outward along spicules.
4. Discussion
Our observations and analysis lead to the conclusion that spicules undergo three different types of motions at the same time: field-aligned flow aligned with the spicule axis, swaying that moves the spicule as a whole transverse to its axis, and torsional motion around its axis. The superposition of these motions complicates the interpretation of spicule spectroscopy and imaging considerably. Our Monte Carlo simulations served to disentangle them and indicate that our observations are compatible with field-aligned flows of order 50-100 km s-1, swaying of order 15-20 km s-1, and torsional motion of order 25-30 km s-1. We also found evidence that the swaying and torsional motions are both signatures of Alfvénic waves with periods of order 100-300 s with propagation along the spicule axis at phase speeds as high as 100-300 km s-1. Our data are inadequate to decide whether only upward propagation occurs, or whether propagation in both directions or even standing waves are as important for the torsional motions as they seem to be for swaying motions (Okamoto & De Pontieu, 2011).
Our results impact several long-standing issues. First, any interpretation of observed spicular motion is likely wrong if not all three kinetic modes are properly accounted for. The classic reports of field-aligned outflows of order 20-30 km s-1 from Doppler shifts at the limb (e.g., Beckers, 1972) did not include torsional and swaying contributions. This introduces additional uncertainty in the historically reported values for field-aligned spicular flows, which are already plagued by poor spatio-temporal resolution.
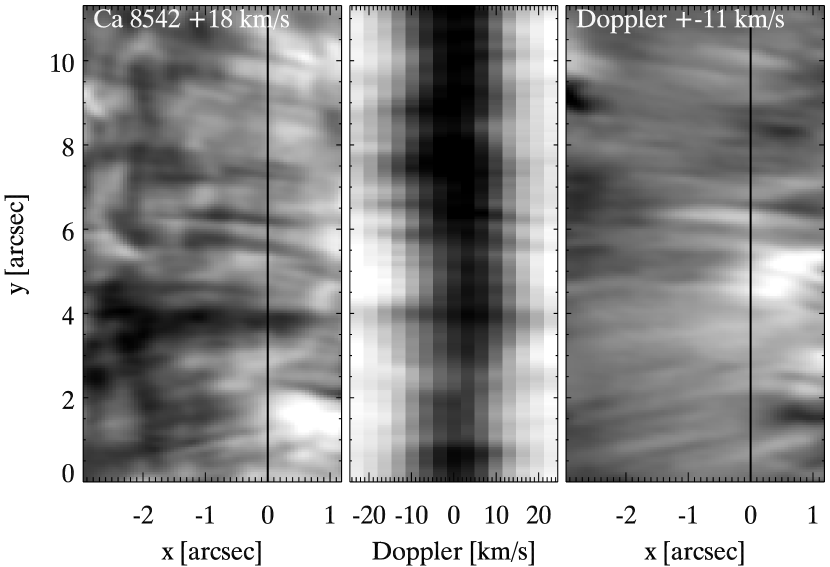
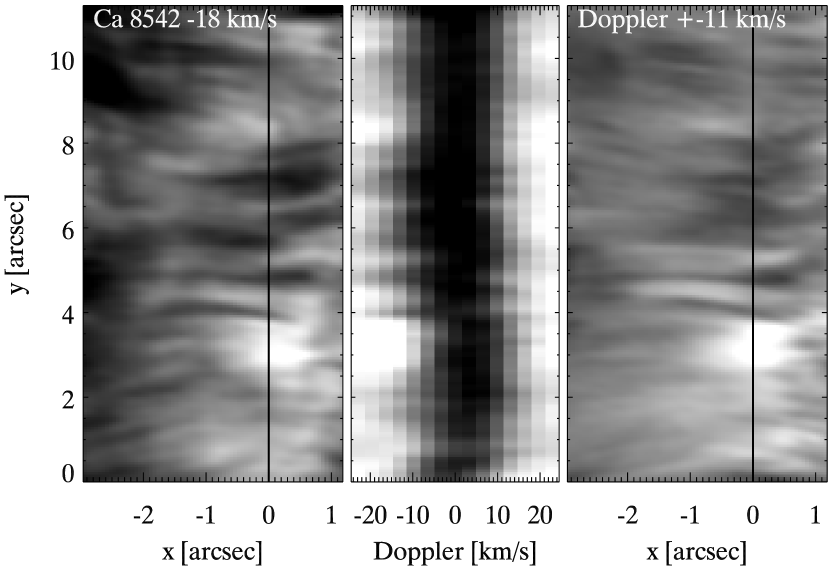
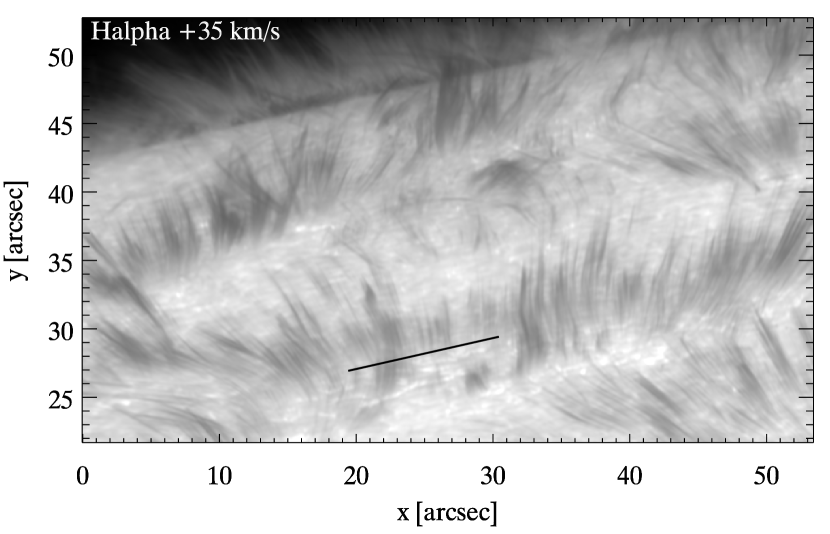
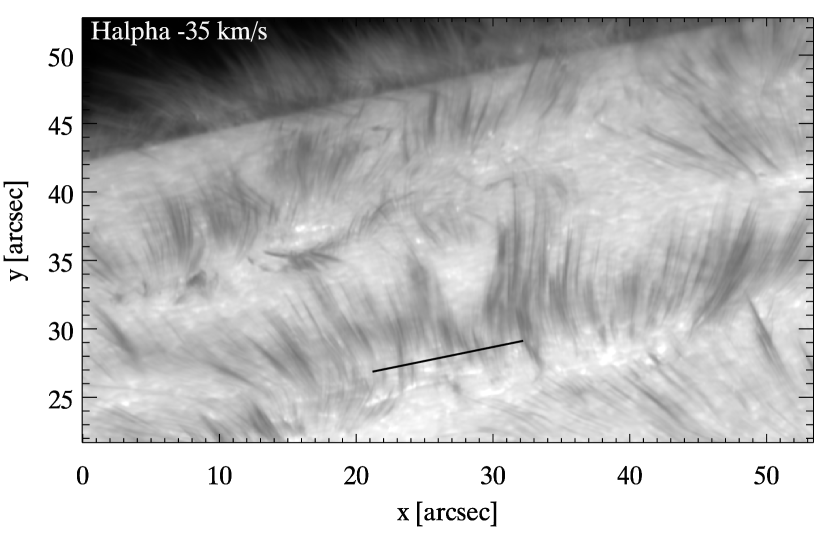
Second, juxtaposition of the three modes of motion explains the appearance of spicular features in the blue and red wings of Ca II 854.2 nm and H close to the limb. Such images show rows (“bushes”) of near-vertical absorption features that are comparable to the on-disk “rapid blue excursions” (RBEs) of Rouppe van der Voort et al. (2009). When these are compared between near-simultaneous red and blue outer-wing samplings, the red-shifted and blue-shifted features appear with remarkably similar, though not identical, morphology and orientation. Precise fine-scale overlap is rare but the bush patterns often appear roughly the same. An H example pair is shown in the lower panels of Figure 5. Such outer-wing similarity has been interpreted as presence of similar field-aligned flows pointing towards and away from the observer (Beckers, 1972), but the asymmetry of near-limb line-of-sight projection should then cause large morphological inequality. It is much more likely that large-amplitude transverse motions dominate the visibility close to the limb of outer-wing features and that they cause morphological equality through near-cospatial and alternating red and blue Dopplershift modulation. The upper panels of Figure 5 indeed show spicular Doppler tilts in the central spectrum panels, much like the off-limb ones in Figure 1. This suggests that on-disk RBEs also undergo torsional motion.
Our observations confirm the speculation of Curdt & Tian (2011) that torsional motions likely occur on smaller scales than their SUMER observations of macrospicules and explosive events (or the so-called swirls, see Wedemeyer-Böhm & Rouppe van der Voort, 2009). Our results also support the early work by Avery (1970) and suggestions by Pasachoff et al. (1968) that upward propagating Alfvén waves explain indications of high-speed propagation of Doppler signals along spicules. The presence and/or observed periods of propagating torsional Alfvén waves can in principle provide information about the thermodynamic and magnetic properties of the guiding structures (e.g., Routh et al., 2010; Verth et al., 2010). Such idealized models are not yet a good representation of actual, highly dynamic spicules but may illustrate the potential diagnostic value of spicular wave observations.
The ubiquity of torsional spicule motion also provides support for scenarios of spicule formation in which non-linear coupling of torsional Alfvén waves to other wave modes on expanding flux tubes leads to significant field-aligned flows that drive the plasma upwards (Hollweg et al., 1982; Sterling & Hollweg, 1984; De Pontieu & Haerendel, 1998; Kudoh & Shibata, 1999; Matsumoto & Shibata, 2010). However, none of these models can explain both the large observed field-aligned flows and the rapid heating to at least transition-region temperatures. This suggests that while torsional motions may play a role in providing upward momentum in spicules, other components of spicule formation are still missing.
While our Monte Carlo simulation assumes the presence of only the torsional mode, the observations show also evidence for more complex torsional modes with (see example at y=34″ in top left panel of Figure 1). Our results thus may provide support for the recent hypothesis (van Ballegooijen et al., 2011; Asgari-Targhi & van Ballegooijen, 2012) that complex torsional motions are generated in the interaction between convective motions and photospheric flux tubes (see, e.g., the ubiqitous vorticy reported in recent simulations by Moll et al., 2011), and that they may be responsible for heating of the chromosphere and corona.
The observed torsional motions imply that spicules, given their ubiquity, play a major role in the transport of helicity through the solar atmosphere. In addition, our results suggest that the energy flux carried by Alfvénic motions into the corona and heliosphere may be twice as large as the previous estimates that were based on swaying motions only (De Pontieu et al., 2007c; McIntosh et al., 2011).
References
- Asgari-Targhi & van Ballegooijen (2012) Asgari-Targhi, M. & van Ballegooijen, A. A. 2012, ApJ, 746, 81
- Avery (1970) Avery, L. W. 1970, Sol. Phys., 13, 301
- Beckers (1968) Beckers, J. M. 1968, Sol. Phys., 3, 367
- Beckers (1972) —. 1972, ARA&A, 10, 73
- Centeno et al. (2010) Centeno, R., Trujillo Bueno, J., & Asensio Ramos, A. 2010, ApJ, 708, 1579
- Curdt & Tian (2011) Curdt, W. & Tian, H. 2011, A&A, 532, L9
- Curdt et al. (2012) Curdt, W., Tian, H., & Kamio, S. 2012, ArXiv e-prints 1201.3199
- De Pontieu & Haerendel (1998) De Pontieu, B. & Haerendel, G. 1998, A&A, 338, 729
- De Pontieu et al. (2007a) De Pontieu, B., Hansteen, V. H., Rouppe van der Voort, L., van Noort, M., & Carlsson, M. 2007a, ApJ, 655, 624
- De Pontieu et al. (2007b) De Pontieu, B., McIntosh, S., Hansteen, V. H., Carlsson, M., Schrijver, C. J., Tarbell, T. D., Title, A. M., Shine, R. A., Suematsu, Y., Tsuneta, S., Katsukawa, Y., Ichimoto, K., Shimizu, T., & Nagata, S. 2007b, PASJ, 59, 655
- De Pontieu et al. (2011) De Pontieu, B., McIntosh, S. W., Carlsson, M., Hansteen, V. H., Tarbell, T. D., Boerner, P., Martinez-Sykora, J., Schrijver, C. J., & Title, A. M. 2011, Science, 331, 55
- De Pontieu et al. (2007c) De Pontieu, B., McIntosh, S. W., Carlsson, M., Hansteen, V. H., Tarbell, T. D., Schrijver, C. J., Title, A. M., Shine, R. A., Tsuneta, S., Katsukawa, Y., Ichimoto, K., Suematsu, Y., Shimizu, T., & Nagata, S. 2007c, Science, 318, 1574
- De Pontieu et al. (2009) De Pontieu, B., McIntosh, S. W., Hansteen, V. H., & Schrijver, C. J. 2009, ApJ, 701, L1
- Hansteen et al. (2006) Hansteen, V. H., De Pontieu, B., Rouppe van der Voort, L., van Noort, M., & Carlsson, M. 2006, ApJ, 647, L73
- Hollweg et al. (1982) Hollweg, J. V., Jackson, S., & Galloway, D. 1982, Sol. Phys., 75, 35
- Houtgast & Namba (1979) Houtgast, J. & Namba, O. 1979, Proceedings of the Royal Netherlands Academy of Arts and Sciences, Vol. 82, Nr. 3, p. 223, 82, 223
- Kiselman et al. (2011) Kiselman, D., Pereira, T. M. D., Gustafsson, B., Asplund, M., Meléndez, J., & Langhans, K. 2011, A&A, 535, A14
- Kosugi et al. (2007) Kosugi, T., Matsuzaki, K., Sakao, T., Shimizu, T., Sone, Y., Tachikawa, S., Hashimoto, T., Minesugi, K., Ohnishi, A., Yamada, T., Tsuneta, S., Hara, H., Ichimoto, K., Suematsu, Y., Shimojo, M., Watanabe, T., Shimada, S., Davis, J. M., Hill, L. D., Owens, J. K., Title, A. M., Culhane, J. L., Harra, L. K., Doschek, G. A., & Golub, L. 2007, Sol. Phys., 243, 3
- Kudoh & Shibata (1999) Kudoh, T. & Shibata, K. 1999, ApJ, 514, 493
- Langangen et al. (2007) Langangen, Ø., Carlsson, M., Rouppe van der Voort, L., & Stein, R. F. 2007, ApJ, 655, 615
- Langangen et al. (2008) Langangen, Ø., De Pontieu, B., Carlsson, M., Hansteen, V. H., Cauzzi, G., & Reardon, K. 2008, ApJ, 679, L167
- Martínez-Sykora et al. (2011) Martínez-Sykora, J., Hansteen, V., & Moreno-Insertis, F. 2011, ApJ, 736, 9
- Matsumoto & Shibata (2010) Matsumoto, T. & Shibata, K. 2010, ApJ, 710, 1857
- McIntosh et al. (2011) McIntosh, S. W., de Pontieu, B., Carlsson, M., Hansteen, V., Boerner, P., & Goossens, M. 2011, Nature, 475, 477
- McIntosh et al. (2008) McIntosh, S. W., De Pontieu, B., & Tarbell, T. D. 2008, ApJ, 673, L219
- Moll et al. (2011) Moll, R., Cameron, R. H., & Schüssler, M. 2011, A&A, 533, A126
- Okamoto & De Pontieu (2011) Okamoto, T. J. & De Pontieu, B. 2011, ApJ, 736, L24
- Pasachoff et al. (1968) Pasachoff, J. M., Noyes, R. W., & Beckers, J. M. 1968, Sol. Phys., 5, 131
- Rouppe van der Voort et al. (2009) Rouppe van der Voort, L., Leenaarts, J., de Pontieu, B., Carlsson, M., & Vissers, G. 2009, ApJ, 705, 272
- Rouppe van der Voort et al. (2007) Rouppe van der Voort, L. H. M., De Pontieu, B., Hansteen, V. H., Carlsson, M., & van Noort, M. 2007, ApJ, 660, L169
- Routh et al. (2010) Routh, S., Musielak, Z. E., & Hammer, R. 2010, ApJ, 709, 1297
- Scharmer et al. (2003a) Scharmer, G. B., Bjelksjo, K., Korhonen, T. K., Lindberg, B., & Petterson, B. 2003a, in Society of Photo-Optical Instrumentation Engineers (SPIE) Conference Series, Vol. 4853, Society of Photo-Optical Instrumentation Engineers (SPIE) Conference Series, ed. S. L. Keil & S. V. Avakyan, 341–350
- Scharmer et al. (2008) Scharmer, G. B., Narayan, G., Hillberg, T., de la Cruz Rodríguez, J., Löfdahl, M. G., Kiselman, D., Sütterlin, P., van Noort, M., & Lagg, A. 2008, ApJ, 689, L69
- Sterling (2000) Sterling, A. C. 2000, Sol. Phys., 196, 79
- Sterling et al. (2010) Sterling, A. C., Harra, L. K., & Moore, R. L. 2010, ApJ, 722, 1644
- Sterling & Hollweg (1984) Sterling, A. C. & Hollweg, J. V. 1984, ApJ, 285, 843
- Suematsu et al. (2008) Suematsu, Y., Ichimoto, K., Katsukawa, Y., Shimizu, T., Okamoto, T., Tsuneta, S., Tarbell, T., & Shine, R. A. 2008, in Astronomical Society of the Pacific Conference Series, Vol. 397, First Results From Hinode, ed. S. A. Matthews, J. M. Davis, & L. K. Harra, 27
- Suematsu et al. (1995) Suematsu, Y., Wang, H., & Zirin, H. 1995, ApJ, 450, 411
- van Ballegooijen et al. (2011) van Ballegooijen, A. A., Asgari-Targhi, M., Cranmer, S. R., & DeLuca, E. E. 2011, ApJ, 736, 3
- van Noort et al. (2005) van Noort, M., Rouppe van der Voort, L., & Löfdahl, M. G. 2005, Sol. Phys., 228, 191
- Verth et al. (2010) Verth, G., Erdélyi, R., & Goossens, M. 2010, ApJ, 714, 1637
- Wedemeyer-Böhm & Rouppe van der Voort (2009) Wedemeyer-Böhm, S. & Rouppe van der Voort, L. 2009, A&A, 507, L9