Thin film growth by using random shape cluster deposition
Abstract
The growth of a rough and porous thin surface by deposition of randomly shaped clusters with different sizes over an initially flat linear substrate is simulated, using Monte Carlo technique. Unlike the ordinary Random Deposition, our approach results in aggregation of clusters which produces a porous bulk with correlation along the surface and the surface saturation occurs in long enough deposition times. The scaling exponents; the growth, roughness, and dynamic exponents are calculated based on the time scale. Moreover, the porosity and its dependency to the time and clusters size are also calculated. We also study the influence of clusters size on the scaling exponent, as well as on the global porosity.
I Introduction
Nowadays, the fabrication of the solid-state electronic devices is vastly dependent on the deposition technology which is used in their construction. The formation, growth and dynamics of surfaces can well be regarded as the main factor in device fabrication which has attracted strong attention, specially in past few decades. Furthermore, the deposition of particles via different procedures has immense importance not only in a broad range of physics applications, but also in chemistry, biology, and engineering. Until today, several analytical and numerical approaches and approximation methods have been developed to investigate the generic properties of various surface growth processes. Since the nature of resulting surfaces are random and far-from-equilibrium, they are called non-equilibrium and rough surfaces Barabasi ; Meakin .
Regarding it as the simplest model of surface growth, Random Deposition (RD) Barabasi has a continuum growth equation which results in exact determination of scaling exponents. In this model, each particle is randomly dropped over a site of an initially flat reference surface and deposited on the top of the selected column. The growth of columns are independent of each other, and the surface is uncorrelated. Ballistic deposition (BD) Vold is another method of surface growth which is a colloidal aggregation. In this model, a particle is released from a randomly chosen position above the surface, located at the distance larger than the maximum height of interface. Since the different sites of the surface are dependent on the heights of neighboring sites, a correlation develops along the surface. Hence, the height of the new particle will be equal to or larger than that of its neighbors. The correlation length is the typical distance over which the heights ”know about” each other which grows with time until it reaches the size of the system when the surface becomes saturated Barabasi . There are also other surface growth models such as Random Deposition with Surface Relaxation (RDSR) Family1 and nonlinear discrete models such as the Eden growth (ED) model Parisi , restricted solid-on-solid (RSOS) model Kim and body-centered solid-on-solid (BCSOS) model Chin have been proposed to study the kinetic roughening of the growth processes which belong to different universality classes.
In order the simple surface growth equations to present more complicated physical systems, theoretical efforts have been carried out and different types of noise were added to the models to adapt the possible variety of forces which might complicate the dynamics of growth in each physical system. The continuum linear growth model defined by the Edward-Wilkinson (EW) equation is counted with the same universality class as that of the discrete models, such as RDSR model Edwards . The nonlinear Kardar-Parisi-Zhang (KPZ) equation, which is a generalization of the EW equation, explains the universality class which includes the discrete growth models, such as the BD, RSOS, and BCSOS models kpz . In some approaches, the two or more different deposition models are combined to investigate the time evolution of roughness in real systems Wang ; El-Nashar ; Reis . The other works have proposed a surface growth model by the random deposition of linear particles with different or identical sizes in and dimensions. These particles are aggregated on a flat surface with special deposition rules and a porous bulk is generated Forgerini1 ; Forgerini2 .
Due to the daily development of nano-electronic technology, an increasing demand is appeared to fabricate the nano-dimension devices. Deposition of clusters instead of single particles due to their large size, are a suitable choice for building the desirable structures. Furthermore, as the clusters occupy more than one unit site of the surface it is possible to generate porous bulks which has plenty of applications in magnetic storage Nielsch , solar cells KARMHAG , carbon nano-tubes and other means Guangli ; Che . In the recent years, several methods have also been proposed to simulate the growth of thin films by deposition of clusters among which the Molecular Dynamics (MD) simulations and Monte Carlo (MC) technique have been frequently used. Unlike the MD model which is only applicable to small systems, the MC outstandingly can be applied to systems with large numbers of atoms Yanling ; Biswas ; Kang ; Mizuseki .
In the following work, we are presenting a generalization of the particle deposition to enrich the physics of the simulation process and make it correspond more with the real deposition processes such as sputtering in which clusters of random shape and size are ejected from a solid target material due to bombardment of the target by energetic particles and deposited over the substrate. Although we do not deal with bombardment in our approach, we propose a method to produce such random shape and size clusters, ranging from a single particle to a bunch of attached particles, to make the simulation corresponds more with experimental reality. we are also interested to the study of the morphology of surfaces which are formed by adding such randomly shaped clusters to an initially flat linear substrate, based on MC simulations and random deposition model.
In contrast to the ordinary RD in which there is no correlation along the surface and the interface width increases infinitely without occurrence of saturation, our approach results in aggregation of clusters which produces a porous bulk with correlation along the surface. Moreover, the surface saturation is reached in long enough deposition times. Consequently, the scaling exponents; the growth, roughness, and dynamic exponents, are countable based on the time scale. In addition, the porosity and its dependency to the time and clusters size is calculated. We have also studied the influence of clusters size on the scaling exponent, as well as on the global porosity.
The outline of the paper is as follows: In section II, the model, deposition rules, and the details involved in the Monte Carlo simulations are described. The results of numerical simulations for scaling exponents, interface width, and porosity as a function of the time evolution and cluster’s sizes are presented in section III. The paper end with conclusion In section IV.
II Model and Simulation Method for cluster deposition
In the deposition process, the clusters with different shapes and size are dropped randomly on an initially flat linear substrate. As deposition starts, the surface grows gradually. The width of the surface which is called the surface roughness , is a consequence of the non-equilibrium growth conditions under which the surface is formed
| (1) |
where is the height of the growing surface at horizontal position and time and is the size of the substrate. is the horizontally averaged surface height at time
| (2) |
The comprehensive scaling behavior of the rough surface is studied with the Family-Vicsek scaling ansatz Family . The scaling relation implies that the interface width, increases as a power of time, , which is the roughness scaling exponent. The surface width saturates at a value which increases as a power low of the system size, , where is the growth scaling exponent. These two exponents are related to each other by another scaling exponent which is called the dynamic scaling exponent; Barabasi .
| (3) |
The function is expected to have an asymptotic form such that
| (4) |
In addition to roughness width, , the correlation length is another parameter which characterizes the rough surface by measuring the rate of changes of roughness along the surface. As the RD model has an uncorrelated nature, the correlation length is zero and the roughness exponent is infinite. Therefor, the resulting surface is not self-affine and the saturation will not be reach.
In the following, at first, we will describe the procedure of building and depositing the clusters with different shape and size, using Monte Carlo simulation. Then, we show that during the surface growth, three different behaviors appear as a function of time. These behaviors at the initial and intermediate times, are characterized by growth exponents and , respectively. At large times, the surface width grows slowly and the saturation will be reached. The morphology of rough surface is then characterized by the value of the exponent . In addition, the variation of global porosity with time and size of the bulk formed by depositing clusters are studied.
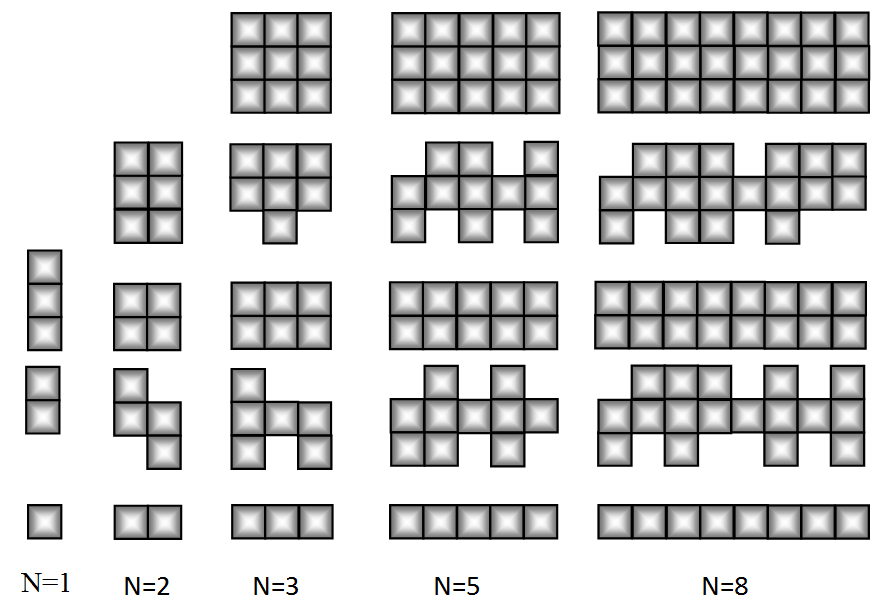
In our approach for constructing rough structures, instead of growing the surface by atom-atom aggregation on the substrate, we propose a cluster growth procedure in which a random number of single particles with a unit height are attached together in a way that different shape clusters are formed. Each cluster is a linear box where is the cluster length and ranges from one to an arbitrary random number. In other way, is the maximum permitted size for the deposition. The middle row of the cluster is fully filled with unit particles and the top and bottom rows are occupied by random number of particles, , , which their positions are quite random (Fig. 1).
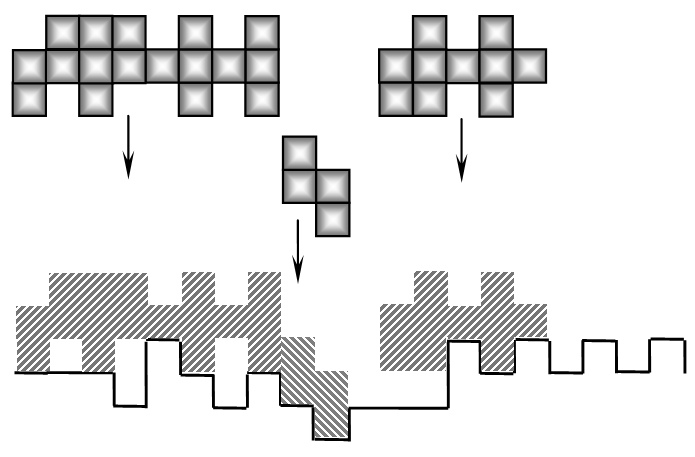
As the deposition is initiated, the clusters are dropped over random positions of a finite one dimensional substrate. The middle point of the cluster would land over the randomly selected position of the substrate. Regarding the size of a cluster, its middle point is considered as the half of its length. Thereafter, by checking the vacant sites around the landing point which depends on the geometric constraint of the previous deposited layer (the previous MC step) the lowest possible place in which the cluster can be fitted is determined the incident cluster permanently sticks there.
To clarify the growth rules and geometry conditions of the surface, three situations for which the clusters might be added to the surface are illustrated in Fig. 2. The vacant locations across the surface which has no other chance of being filled on the next deposition step, produce a porous structure in the bulk. The porosity is defined as the proportion of the unoccupied part of the surface volume to the total surface volume
| (5) |
where , which and are the volume of the occupied and empty sites, respectively. As the clusters are larger than unit site of surface, a porous structure is produced such that its porosity is dependent on the time evolution and size of the clusters poros1 ; poros2 . In the next section, we focus on studying this dependency and scaling exponent of the surface by cluster deposition.
III Discussion and Results
We performed a MC simulations on a linear flat substrate with it’s size ranging from to . The deposition process starts at time and the log-log curve of the time dependency of roughness for different values of substrate and clusters size is evaluated. Furthermore, the behavior of the surface width and scaling exponents are studied for two cases of different and identical cluster’s size. The time evolution of the porosity and its dependency to the cluster’s size are also discussed in section III.3.
III.1 Clusters with different size
Considering the clusters with different size, we investigate the time evolution of the surface roughness and estimate the scaling exponents and determine the universality class of the model. The MC simulations were performed for the substrates with different sizes as and . The numerical results show that as time goes by, in spite of the RD model, the surface roughness in our model presents three different behaves. This happens due to the correlation among the columns which leads to the lateral growth of the surface. The roughness behaviors correspond to the initial, intermediate and long time scales. The unit of time is measured in Monte Carlo steps (MCs).
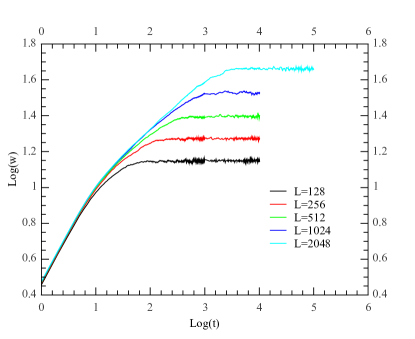
Fig. 3 demonstrate the log-log plot of the surface width as a function of time for the deposition of different size clusters on the substrate. The results were obtained for the deposition of a mixture of clusters with different sizes, , where N ranges from to . In order to get reliable results, the average sampling were performed over different samples for and for . As it is illustrated in the figure, the behaviour of surface width at initial times which corresponds to , is close to for all substrate sizes. This value is close to that of the random deposition of particles with arbitrary correlation. At the intermediate times, the lateral correlations are appeared and the growth exponent shows a completely different behavior. During this time, the height-height correlation develops and exhibits smaller value than . At this times is approximately which in contrast to , does not belong to the RD universality. Although it is close to the results for the RDSR model in (1+1) dimension which is described by EW equation, however it is possible that our model does not belong to any universality class. It is due to the fact that the exponents have to be in exact agreement with that of EW so that we could decisively conclude that they are in the same universality class. Eventually at long enough times, the exponent characterizes the roughness of the saturated surface. The roughness width has a power law dependency to the exponents with respect to (i.e.,). In other words, surface grows in early time regimes and saturates to a finite value, which depends on the size L. The exponent is estimated close to . The scaling exponents were also measured for averaging over independent MC runs for each system size and the dynamic exponent obtained equal to from and .
III.2 Clusters with identical size
Following our investigations,the MC simulations were performed for 7 different cases for each of which the clusters of identical size() but with different shapes were deposited over the substrate (Table 1).
The results show that the surface width does not exhibit a noticeable dependency to the size of clusters, and the time evolution of the roughness behaves in a similar manner to that of clusters of different sizes. In this case also there are two different regimes at the initial and intermediate times which correspond to the exponents and , respectively. The exponent is also determined at the long enough times when the saturation is reached
Table 1 demonstrate the results of each MC simulation for different cases of deposition of identical size clusters. The scaling exponents , , , and z for a substrate with L are presented in the table. Although the clusters have identical sizes, the exponents behave the same as the previous approach with different size clusters. Once again we claim that although the exponents are close to that of EW universality class but as they are not in exact agreement, our model may not belong to any universality class. For example in the case N=4, the scaling exponents explain the EW universality class. However, it might be accidental.
| N | ||||
|---|---|---|---|---|
| 2 | 0.4950.001 | 0.2930.001 | 0.520.02 | 1.770.07 |
| 4 | 0.5320.004 | 0.2560.001 | 0.500.03 | 1.950.11 |
| 6 | 0.5450.005 | 0.2600.002 | 0.540.04 | 2.070.15 |
| 8 | 0.5530.007 | 0.2680.001 | 0.550.03 | 2.050.11 |
| 10 | 0.5570.006 | 0.2670.002 | 0.510.04 | 1.910.15 |
| 12 | 0.5620.007 | 0.2890.003 | 0.580.05 | 2.000.17 |
| 14 | 0.5800.004 | 0.2960.004 | 0.620.03 | 2.090.10 |
III.3 Porosity
Deposition of particles of size 2 or larger would lead to the generation of porous structures Karmakar ; Trojan ; Caglioti . Our model is also based on the deposition of different size and shape clusters and is expected to be porous. Fig. 6 illustrates a piece of the porous surface which is obtained from our deposition model. In the following, we investigate the porosity of our surface as a function of time and cluster size.
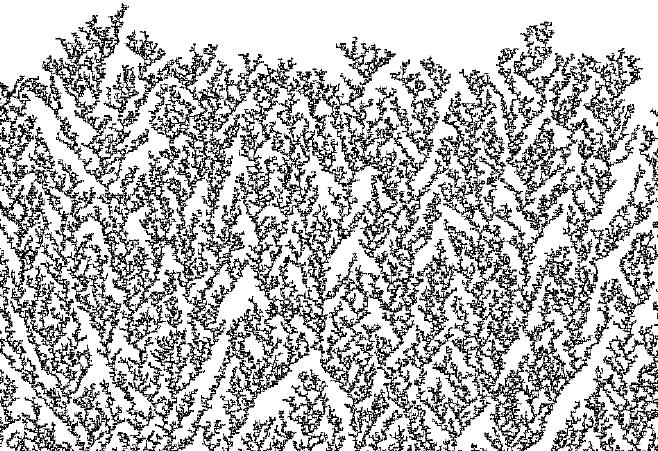
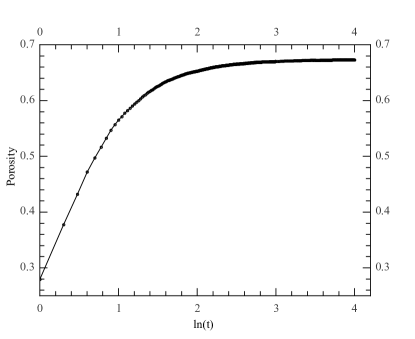
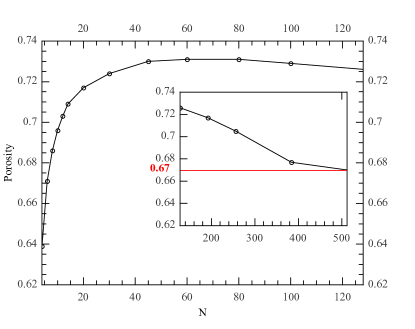
Fig. 4 demonstrate the porosity of a surface of with different size clusters as a function of time. Unlike the roughness width, porosity saturates at the early stages of deposition. The saturation occurs at . The dependency of global porosity of a surface of to the cluster’s size is depicted in Fig. 5. The results show that as the cluster size is increased, the porosity is increased either. And after reaching a maximum value at , the porosity is decreased and tends to in . One can explain this behavior by considering the variation of porosity in terms of the total height of the surface. If the total number of deposited clusters and the maximum surface height are denoted by and , respectively, the porosity can be approximated as:
| (6) |
Due to consideration of the overhangs from the topmost layer, the maximum value for porosity is generally smaller than what is obtained from Eq. 6. Considering the case, after depositing a cluster on one side of the substrate, the probability of depositing another cluster exactly adjacent to it is very small (). Hence, the second cluster is mostly probable to land over the previous one. As the height of each cluster in our model is 3, the total height of the surface at the end of the growth process is . Inserting in Eq. 6, the porosity reads . For the case , the second cluster sits in the vicinity of the first cluster with probability and over it with . The prosity is for the former and for the later and the total porosity is obtained as . Therefor, as the cluster size is decreased from , the porosity is increased. The increase of porosity continues until the blending and mixturing of clusters revers the process and the porosity starts to decrease.
Our investigations also shows that the porosity is independent of the linear size of substrate.
IV Conclusion
We have used the Monte Carlo simulations to study a surface growth model with deposition of the mixture of clusters with different sizes, , where is the cluster length and ranges randomly from one to a maximum value.
Due to deposition of clusters with different sizes, a porous bulk is formed which reaches to a saturation regimes at the initial Monte Carlo steps (faster than the roughness width). The porosity depends on the cluster’s size and increases as the size of clusters is increased until it reaches a maximum value, then decreases and tend to the value .
Our results show that surface width presents three different behavior as a function of time. At initial times, the behavior is close to an uncorrelated growth and the growth exponent is . At intermediate times, the surface roughness grows more slowly with another growth exponent rangs . And eventually, at long times, surface reaches to a saturation regime which is characterized by the roughness exponent rangs and as a result, the dynamical critical exponent rangs . The results certify that, the present deposition model does not belong to any universality class even though it’s exponents are close to that of EW.
References
- (1) A.L. Barabasi and H. E. Stanley, “Fractal Concepts in Surface Growth”, Cambridge University Press, New York, (1995).
- (2) P. Meakin, “Fractals, Scaling and Growth far from Equilibrium“, Cambridge University Press, New, York, 1998.
- (3) Vold M J, J. Colloid Interface Sci., 14, 168 (1959). Vold M J, J. Phys. Chem. 63, 68 (1959).
- (4) Family F, J. Phys. A: Math. Gen. 19, L441 (1990).
- (5) Parisi G and Zhang Y-C, Phys. Rev. Lett. 53, 1791 (1984).
- (6) Kim J M and Kosterlitz J M, Phys. Rev. Lett. 62, 2289 (1989).
- (7) Chin C.S and Den Nijs M, Phys. Rev. E 59, 2633 (1999).
- (8) S. F. Edwards and D. R. Wilkinson, Proc. R. Soc. London, Ser. A 381, 17 (1982).
- (9) M. Kardar, G. Parisi, and Y. C. Zhang, Phys. Rev. Lett. 56, 889 (1986).
- (10) W. Wang and H. A. Cerdeira, Phys. Rev. E 52, 6308 (1995).
- (11) H. F. El-Nashar and H. A. Cerdeira, Phys. Rev. E 61, 6149 (2000).
- (12) F. D. A. Aar o Reis, Phys. Rev. E 73, 021605 (2006).
- (13) F. L. Forgerini, W. Figueiredo, Phys. Rev. E 81, 051603 (2010).
- (14) F. L. Forgerini, W. Figueiredo, Phys. Rev. E 79, 041602 (2009).
- (15) K. Nielsch, R. B. Wehrspohn, J. Barthel, J. Kirschner, U. G sele, S. F. Fischer, and H. Kronm ller, Appl. Phys. Lett. 79, 1360 (2001).
- (16) RICHARD KARMHAG, TUQUABO TESFAMICHAEL, EWA WACKELGARD, GUNNAR, A. NIKLASSON and MATS NYGREN ,Solar Energy 68, 4 329-33 (2000).
- (17) Guangli Che, Brinda B. Lakshmi, Ellen R. Fisher and Charles R. Martin, Nature 393, 346-349 (1998).
- (18) G. Che, B. B. Lakshmi, C. R. Martin, and E. R. Fisher, Chem. Mater., 10 1, 260-267 (1998).
- (19) Yanling Li, Nam Vu, Albert S. Kim, Desalination, 249, 416-422 (2009).
- (20) R. Biswas, Gary S. Grest, C. M. Soukoulis, PRB, 38, 8154-8162 (1988).
- (21) Jeong-Won Kang, Ki-Seok Choi, Jin-Cheol Kang, Ki-Ryang Byun and Ho-Jung Hwang,Journal of the Korean Physical Society, 38, No. 2, 158-161 (2001).
- (22) H. Mizuseki1, Y. Jin1, Y. Kawazoe1, L.T.Wille, Appl. Phys. A, 73, 731-735 (2001).
- (23) F. Family and T. Vicsek, J. Phys. A 18, L75 (1985).
- (24) M. J. Vold, J. Colloid Sci. 14, 168 (1959).
- (25) F. Voigt, R. Bru ggemann, T. Unold, F. Huisken, G.H. Bauer, Materials Science and Engineering C 25, 584-589 (2005).
- (26) R. Karmakar, T. Dutta, N. Lebovka, and S. Tarafdar, Physica A 348, 236 (2005).
- (27) K. Trojan and M. Ausloos, Physica A 326, 492 (2003).
- (28) E. Caglioti, V. Loreto, H. J. Herrmann, and M. Nicodemi, Phys. Rev. Lett. 79, 1575 (1997).