Simulations of Magnetic Field Generation in Unmagnetized Plasmas via Beat Wave Current Drive
Abstract
This work describes the scientific basis and associated simulation results for the magnetization of an unmagnetized plasma via beat wave current drive. Two-dimensional electromagnetic particle-in-cell simulations have been performed for a variety of angles between the injected waves to demonstrate beat wave generation in agreement with theoretical predictions of the beat-wave wave vector and saturation time, revealing new 2D effects. The simulations clearly demonstrate electron acceleration by the beat waves and resultant current drive and magnetic field generation. The basic process depends entirely on the angle between the parent waves and the ratio of the beat-wave phase velocity to the electron thermal velocity. The wave to magnetic energy conversion efficiency of the cases examined is as high as 0.2%. The technique could enable novel plasma experiments in which the use of magnetic coils is infeasible.
pacs:
41.85.Ja, 52.38.Fz, 52.65.RrThe nonlinear mixing of electromagnetic (EM) waves in plasmas has been applied to heating, diagnostics, particle acceleration, ionospheric plasma modification, and current drive Stefan et al. (1989). This paper describes the application of beat wave current drive Cohen (1984); Cohen et al. (1988); Rogers and Hwang (1992) to magnetize an initially unmagnetized plasma. The greatest emphasis of prior beat wave studies was on accelerating electrons to relativistically high energies and not on the most effective generation of current for producing significant magnetic field in an ambient plasma. Potential applications of beat wave magnetic field generation include controlled fusion concepts such as magneto-inertial fusion (MIF) Slutz et al. (2010); Chang et al. (2011); Hsu et al. (2012), and laboratory experiments on plasma phenomena of astrophysical interest, e.g., Drake (2000). For lack of immediate applications, however, the full complexity of significant current and field generation from beat wave current drive has not been addressed. While early analyses of beat wave current drive were essentially 1D Cohen et al. (1988), more realistic modeling is now required with actual exploratory experiments underway Liu et al. (2011). For significant current drive, the beat wave phase velocity and electron thermal velocity must be comparable in order to accelerate a useful number of electrons, and thus both collisionless (Vlasov) and collisional modeling are required. The modeling must also be at least 2D in order to handle essential experimental input parameters, such as the shapes, widths, and injection angle of the overlapping EM waves. It is also required to obtain the resultant spatial distribution of extended return currents and the magnetic field. The 2D modeling also allows more realistic testing of predictions from 1D analysis Cohen et al. (1988). Using the Large Scale Plasma (Lsp) code Welch et al. (2010), we have performed such a study using a particular EM wavelength and plasma density range of relevance to MIF.
Remote magnetization has been accomplished previously by shining a laser onto foil targets with wire loops Daido et al. (1986); Woolsey et al. (2001). Beat wave magnetization, however, offers several potential advantages: (1) refraction of the injected high frequency waves is negligible and placement of the beat wave interaction region within the plasma can be precise; (2) beat waves are produced in a controllable direction depending on the angle between injected waves; and (3) current drive can be accomplished for thermal plasmas via control of the wave phase velocity which also depends on . For MIF energy applications requiring reduction of cross-field energy transport, the Hall parameter (ratio of the electron cyclotron to momentum transfer frequency) . This ratio can be achieved by seeding modest magnetic fields ( T) in lower density regions of imploding plasmas that get amplified geometrically to T at maximum compression Hsu et al. (2012).
Figure 1 shows the setup and representative simulation results using two CO2 lasers, with intensity of W/cm2 and , impinging on the center of a circular plasma with non-uniform density peaking at cm-3 and initial temperature = 50 eV. The orientation of the lasers and the subsequent beat wave are shown in Fig. 1(a), with the beat wave vector being the difference between the two laser wave vectors, i.e., . The upward- and rightward-propagating lasers have 10.4 and 10.8-m wavelengths, respectively. The combined laser electric field pattern, shown in Fig. 1(b), drives a plasma beat wave propagating to the upper left, as shown in Fig. 1(c). The beat wave modulates the plasma density by roughly 10% with 7-m wavelength. The plasma beat wave accelerates a portion of the plasma electrons to as high as 500 eV in the direction, driving a current and magnetic field structure shown in Fig. 1(d).
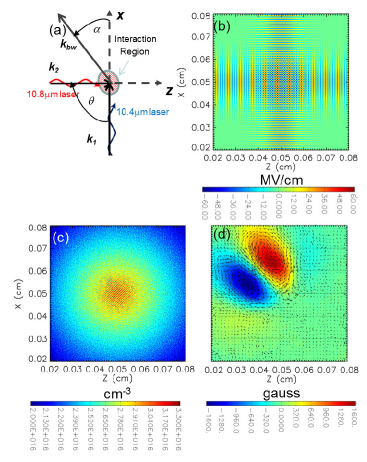
We now discuss the theory of beat wave current drive as exhibited in Fig. 1. Two waves, with frequencies , the electron plasma frequency , are launched into a plasma to generate a beat wave with frequency Cohen et al. (1972); Rosenbluth and Liu (1972). Resonant interaction between the beat wave and the electron population is exploited to accelerate electrons via Landau damping and to drive current and generate magnetic fields. Consider a beat wave generated from the ponderomotive force () of two intersecting injected waves with electric field polarization into the page and wave vector as shown in Fig. 1(a). The angle between and is . If we include the ponderomotive force in the cold electron fluid equation of motion, the magnitude of the wave vector is
| (1) |
Furthermore, the rate of increase in the beat wave amplitude is Rosenbluth and Liu (1972)
| (2) |
where , and is the individual laser electron oscillation frequency. For the case that the beat wave phase velocity , the wave will break for and saturate Rosenbluth and Liu (1972). Thus, we can estimate the saturation time of the beat wave from Eqs. (1) and (2) and obtain
| (3) |
Although the beat wave growth rate scales linearly with laser intensity [], the wave saturated amplitude is a weak function of laser intensity. For cases presented in this paper, 1 ps, providing a lower bound on the simulation duration.
As shown in Fig. 1, we model the entire beat wave interaction and current drive using Lsp, a state-of-the-art, parallel, multi-dimensional particle-in-cell (PIC) code. The simulations resolve the smallest relevant EM wavelengths ( m) and highest frequencies ( THz). The -ns duration and order mm scale length for the interaction demand time steps and cells in 2D. Hundred of particles per cell are required to adequately resolve the electron energy distribution in the high energy tail and provide a sufficiently small noise level to discern the beat wave dynamics. For these simulations, Lsp solves the relativistic Maxwell-Lorentz equations with inter-particle collisions. Particle scattering is treated with complete generality via a binary Coulombic interaction algorithm Nanbu and Yonemura (1998); Welch et al. (2010). We use an explicit, energy-conserving particle advance that sums particle currents such that charge is conserved Welch et al. (2001).
Our simulation domain is a 1-mm by 1-mm square enclosing a 0.95-mm diameter plasma cylinder (with vacuum between plasma edge and domain boundary) as shown in Fig. 1(c) with density range from 1– cm-3. From the boundaries, we inject 100-m transverse-extent lasers into the plasma. Intensities examined here are relevant for generating seed magnetic fields of order 5 kG. The resonant plasma density for the case of 10.4 and 10.8 m wavelengths is cm-3, half the peak density. We found that this difference is not significant to the resulting beat wave production although plasma heating is more efficient at the resonance. The lasers reach – W/cm2 peak intensity in 10 ps with –180∘. A range of beat wave characteristics can be obtained by varying . Much past theoretical work focused on co-linear () injection for its relevance to relativistic electron acceleration. In that case, approaches , which is suitable for a high energy accelerator, but does not easily couple to a thermal plasma electron distribution as required for current drive. Therefore, we focus most of this paper on larger .
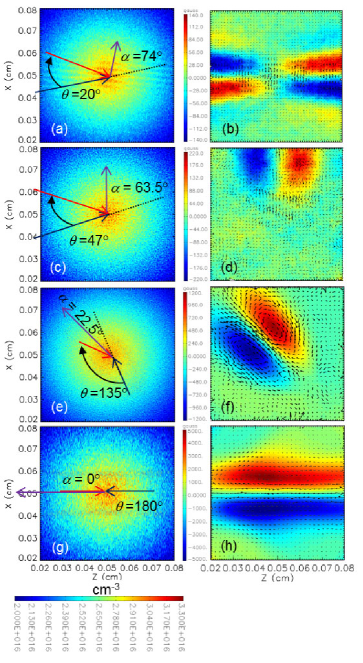
We have verified the simulations against basic theory. In all but the case, the beat wave amplitude saturates in several ps, so we present the saturated wave characteristics after 20 ps in several simulations. The beat wave characteristics including wavelength and direction are nicely exhibited by the electron density contours in Fig. 2 [and Fig. 1(c) for ]. The simulations agree closely with the theory for both and . The smallest is 1/3 that of the lasers for the case, and the largest, roughly twice that of the lasers, is found for the 180∘ case. The beat wave saturated amplitude, as measured by the wave displacement or electron density modulation, is predicted to scale inversely with . This is not obvious in the simulations largely due to the many other competing nonlinear interactions including temperature dispersion, collisionality, and current drive. The beat wave electron density modulations are all roughly 10. Peak beat wave electric field magnitudes range from 100–1000 kV/cm with only a weak dependence on intensity.
We find that current drive is higher for larger angles (Fig. 2). For = 50 eV, line currents of 8 kA/cm produce kG. The and 47∘ simulations show an order of magnitude smaller fields due to the fast of the beat waves. In all cases, the electron current is driven in the direction of . The mean electron velocity vectors in Fig. 2 reveal a closed current path surrounding magnetic islands for the –180∘ simulations. The lower- simulations have a less obvious return current path due to the finite volume of the simulation plasma. Higher energy electrons carrying the current quickly reach the plasma-vacuum interface.
Although the beat wave saturation amplitude is only a function of , the beat wave current drive is optimized by controlling (where is the electron thermal velocity), which varies in time by plasma heating observed at higher laser intensity. In Fig. 3(a), we show peak for several simulations with W/cm2 laser intensity and varying from 1.3–11 ( = 200–25 eV). The simulations show a rapid rise in within 10 ps of peak laser intensity at the interaction region. The field saturation time is consistent with the theoretical value of . An optimal value for is in the range 1.9–2.7 for which kG.
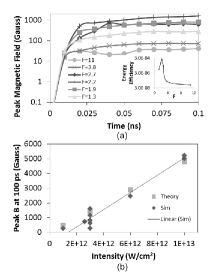
The beat wave current drive efficiency is Cohen et al. (1988)
| (4) |
where is the laser interaction length (roughly 5 cm in our case). A conservative estimate of the action transfers and of 0.1 is taken from Fig. 1 of Ref. 3, and is the electron energy associated with . Using Eq. (4) to estimate peak , we compare the theory with simulation results as a function of laser intensity for . As shown in Fig. 3(b), the 1D theory and 2D simulations follow a similar linear dependence of on intensity, although there is some variation due to varying . We also calculate the total conversion efficiency of laser to magnetic field energy which we define as the ratio of magnetic field energy at 100 ps to the total injected laser energy through 100 ps. Keeping fixed and W/cm2 intensity ( J), we find a maximum in the energy efficiency of 0.03% near = 2.2 with % for –2.7, as shown in the inset of Fig. 3(a). The efficiency falls off steeply for . The highest efficiency of 0.2% seen in all our simulations thus far correspond to and W/cm2 ( J). The efficiency can be optimized via and maximizing the overlap of injected beams.
Examining more closely the mechanism of current drive in our nominal W/cm2 intensity and simulation where , we find that beat waves with peak kV/cm can trap electrons moving in the same direction with sufficient initial speed, such that (16 eV), and accelerate them to higher energy. This velocity is determined from the total depth of the potential well of the wave in the frame of . We injected test electrons in the center of the laser interaction region ( cm) with (–0.02) velocity in the direction of the beat wave and tracked their velocity () and position () in that direction. Electrons with initial energy 18 eV exhibited oscillatory behavior with peak energy increasing to 50 eV, but little net motion. Most higher energy electrons are trapped, riding up and down on the beat wave fronts but moving with the beat wave. The electrons accelerate to (500 eV), then down to their initial values for several cycles until they are scattered or begin to leave the region of laser interaction at cm. At this time, the electrons can retain some fraction of their peak accelerated energy. These strongly-directed electrons drive current until they are scattered or reach the edge of the plasma. Some of these electrons end up carrying return current as they cycle back. The detailed relationship between beat wave fields, electron acceleration, and magnetic field extent will be explored further in a forthcoming paper.
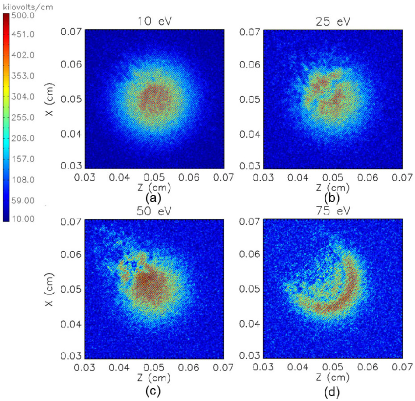
The local , in regions of highest electron acceleration and at optimal , decays due to nonlinear Landau damping. The Landau damping rate is significant as . For the simulation, 0.3. The damping effect on beat wave fields is shown in Fig. 4 for varying . For this particular beat wave excitation at a given phase velocity, at low temperature [Fig. 4(a)] when Landau damping is not strong, the structure reflects quite well the beat wave excitation with negligible loss. With higher temperature [Fig. 4(d)], significant damping is now evident in the decay of the beat wave excitation magnitude along the beat wave wavevector direction (at to the axis). Indeed at 200 eV, the beat wave is strongly damped everywhere relative to the 10-eV simulation. It is unclear whether the presence of the magnetic fields themselves, producing cyclotron radii cm, also contributes to the decay of the beat wave. The regions of stronger beat wave damping also have the highest magnetic field. The 200-eV simulation had 1/5 the peak magnetic field but faster damping of the wave than the 75-eV case. The Landau damping of the beat waves permits the accelerated electrons to escape the wave structure and drive current. Thus, the strong wave and current regions remain distinct.
In this paper, we have described the scientific basis for magnetization of an unmagnetized plasma via beat wave current drive. Specifically, we performed 2D PIC simulations to explore the scaling of beat wave production, current drive, and generation in a non-uniform density plasma using injected waves near 10-m wavelength, corresponding to CO2 lasers. Future work should include 3D simulations and exploration of lower intensity lasers ( W/cm2) for modeling of near term experiments Liu et al. (2011). The 2D simulations to 100 ps presented here made use of 64 processors run for roughly 72 hours. Simulations in 3D will be 100’s of times larger in cell number and require 1000’s of processors on a massively parallel computer.
Acknowledgements.
We acknowledge excellent code support from R. E. Clark. This work was supported by the Office of Fusion Energy Sciences of the U.S. Department of Energy.References
- Stefan et al. (1989) V. Stefan, B. I. Cohen, and C. Joshi, Science 243, 494 (1989).
- Cohen (1984) B. I. Cohen, Comm. Plasma Phys. Control. Fus. 8, 197 (1984).
- Cohen et al. (1988) B. I. Cohen, R. H. Cohen, B. G. Logan, W. M. Nevins, G. R. Smith, A. V. Kluge, and A. H. Kritz, Nucl. Fusion 28, 1519 (1988).
- Rogers and Hwang (1992) J. H. Rogers and D. Q. Hwang, Phys. Rev. Lett. 68, 3877 (1992).
- Slutz et al. (2010) S. A. Slutz, M. C. Herrmann, R. A. Vesey, A. B. Sefkow, D. B. Sinars, D. C. Rovang, K. J. Peterson, and M. E. Cuneo, Phys. Plasmas 17, 056303 (2010).
- Chang et al. (2011) P. Y. Chang, G. Fiksel, M. Hohenberger, J. P. Knauer, R. Betti, F. J. Marshall, D. D. Meyerhofer, F. H. Seguin, and R. D. Petrasso, Phys. Rev. Lett. 107, 035006 (2011).
- Hsu et al. (2012) S. C. Hsu, T. J. Awe, S. Brockington, A. Case, J. T. Cassibry, G. Kagan, S. J. Messer, M. Stanic, X. Tang, D. R. Welch, and F. D. Witherspoon, IEEE Trans. Plasma Sci. 40, 1287 (2012).
- Drake (2000) R. P. Drake, Phys. Plasmas 7, 4690 (2000).
- Liu et al. (2011) F. Liu, D. Hwang, R. Horton, R. Evans, Z. F. Huang, and S. Hong, Bull. Amer. Phys. Soc. 56, 310 (2011).
- Welch et al. (2010) D. R. Welch, D. V. Rose, C. Thoma, R. E. Clark, C. B. Mostrom, W. A. Stygar, and R. J. Leeper, Phys. Plasmas 17, 072702 (2010).
- Daido et al. (1986) H. Daido, F. Miki, K. Mima, M. Fujita, K. Sawai, H. Fujita, Y. Kitagawa, S. Nakai, and C. Yamanaka, Phys. Rev. Lett. 56, 846 (1986).
- Woolsey et al. (2001) N. C. Woolsey, Y. Abou, E. G. Evans, R. A. D. Dundy, S. J. Pestehe, P. G. Carolan, N. J. Conway, R. O. Dendy, P. Helander, K. G. McClements, J. G. Kirk, P. A. Norreys, M. M. Notley, and S. J. Rose, Phys. Plasmas 8, 2439 (2001).
- Cohen et al. (1972) B. I. Cohen, A. N. Kaufman, and K. M. Watson, Phys. Rev. Lett. 29, 581 (1972).
- Rosenbluth and Liu (1972) M. N. Rosenbluth and C. S. Liu, Phys. Rev. Lett. 29, 701 (1972).
- Nanbu and Yonemura (1998) K. Nanbu and S. Yonemura, J. Comp. Phys. 145, 639 (1998).
- Welch et al. (2001) D. R. Welch, D. V. Rose, B. V. Oliver, and R. E. Clark, Nucl. Instrum. Methods A 464, 134 (2001).