Graph Coloring Algorithms for Multi-core and Massively Multithreaded Architectures
Abstract
We explore the interplay between architectures and algorithm design in the context of shared-memory platforms and a specific graph problem of central importance in scientific and high-performance computing, distance-1 graph coloring. We introduce two different kinds of multithreaded heuristic algorithms for the stated, NP-hard, problem. The first algorithm relies on speculation and iteration, and is suitable for any shared-memory system. The second algorithm uses dataflow principles, and is targeted at the non-conventional, massively multithreaded Cray XMT system. We study the performance of the algorithms on the Cray XMT and two multi-core systems, Sun Niagara 2 and Intel Nehalem. Together, the three systems represent a spectrum of multithreading capabilities and memory structure. As testbed, we use synthetically generated large-scale graphs carefully chosen to cover a wide range of input types. The results show that the algorithms have scalable runtime performance and use nearly the same number of colors as the underlying serial algorithm, which in turn is effective in practice. The study provides insight into the design of high performance algorithms for irregular problems on many-core architectures.
Key words: Multi-core/Multithreaded Computing; Parallel Graph Algorithms; Combinatorial Scientific Computing; Graph Coloring
1 Introduction
Graph problems frequently arise in many practical applications, including computational science and engineering, data mining, and data analysis. When the applications are large-scale, solutions need to be obtained on parallel computing platforms. High performance and good scalability are hard-to-achieve on graph algorithms, for a number of well-recognized reasons [27]: Runtime is dominated by memory latency rather than processor speed, and typically there is little (or no) computation involved to hide memory access costs. Access patterns are irregular and are determined by the structure of the input graph, rendering prefetching techniques inapplicable. Data locality is poor, making it difficult to obtain good memory system performance. While concurrency can be abundant, it is often fine-grained, requiring concurrent processes to synchronize at individual vertices or edges.
For these reasons, graph algorithms that perform and scale well on distributed memory machines are relatively small in number and kind. More success stories have been reported on shared memory platforms, and interest in these platforms is growing with the increasing preponderance, popularity, and sophistication of multi-core architectures [25, 3, 28].
The primary mechanism for tolerating memory latencies on most shared memory systems is the use of caches, but caches have been found rather ineffective for many graph algorithms. A more effective mechanism is multithreading. By maintaining multiple threads per core and switching among them in the event of a long latency operation, a multithreaded processor uses parallelism to hide latencies. Whereas caches “hide” only memory latencies, thread parallelism can hide both memory and synchronization overheads. Thus, multithreaded, shared memory systems are more suitable platforms for many graph algorithms than either distributed memory machines or single-threaded, multi-core shared memory systems.
We explore in this paper the interplay between architectures and algorithm design in the context of shared-memory multithreaded systems and a specific graph problem, distance-1 graph coloring.
Graph coloring in a generic sense is an abstraction for partitioning a set of binary-related objects into subsets of independent objects. A need for such a partitioning arises in many situations where there is a scarce resource that needs to be utilized optimally. One example of a broad area of application is in discovering concurrency in parallel computing, where coloring is used to identify subtasks that can be carried out or data elements that can be updated simultaneously [24, 31, 22]. On emerging heterogenous architectures, coloring algorithms on certain “interface-graphs” are used at runtime to decompose computation into concurrent tasks that can be mapped to different processing units [13]. Another example of a broad application area of coloring is the efficient computation of sparse derivative matrices [10, 11, 18].
Distance-1 coloring is known to be NP-hard not only to solve optimally but also in an approximate sense [35]. However, greedy algorithms, which run in linear time in the size of the graph, often yield near optimal solutions on graphs that arise in practice, especially when the greedy algorithm is initialized with careful vertex ordering techniques [10, 19]. In contexts where coloring is used as a step to enable some overarching computation, rather than being an end in itself, greedy coloring algorithms are attractive alternatives to slower, local-improvement type heuristics because they yield sufficiently small number of colors while using run times that are much shorter than the computations they enable.
Contributions. This paper is concerned with the effective parallelization of greedy distance-1 coloring algorithms on multithreaded architectures. To that end, we introduce two different kinds of multithreaded algorithms targeted at two different classes of architectures.
The first multithreaded algorithm is suitable for any shared memory system, including the emerging and rapidly evolving multi-core platforms. The algorithm relies on speculation and iteration, and is derived from the parallelization framework for graph coloring on distributed memory architectures developed in Bozdağ et al. [6, 5]. We study the performance of the algorithm on three different platforms, an Intel Nehalem, a Sun Niagara 2, and a Cray XMT. These three systems employ multithreading—in varying degrees—to hide latencies; the former two additionally rely on cache hierarchies to hide latency. The amount of concurrency explored in the study ranges from small (16 threads on the Nehalem) to medium (128 threads on the Niagara) to massive (16,384 threads on the XMT). We find that the limited parallelism and coarse synchronization of the iterative algorithm fit well with the limited mulithreading capabilities of the Intel and Sun systems.
The iterative algorithm runs equally well on the XMT, but it does not take advantage of the system’s massively multithreaded processors and hardware support for fast synchronization. To better exploit the XMT’s unique hardware features, we developed a fine-grained, dataflow algorithm making use of the single-word synchronization mechanisms available on the XMT. The dataflow algorithm is the second algorithm presented in this paper.
The performance study is conducted using a set of carefully chosen synthetic graphs representing a wide spectrum of input types. The results show that the algorithms perform and scale well on massive graphs containing as many as a billion edges. This is true of the dataflow algorithm on the Cray XMT and of the iterative algorithm on all three of the platforms considered; on the XMT, the dataflow algorithm runs faster and scales better than the iterative algorithm. The number of colors the algorithms use is nearly the same as that used by the underlying serial algorithm.
In the remainder of this section, we briefly discuss related work. The rest of the paper is organized as follows. To establish background, especially for the design of the dataflow algorithm, we review in Section 2 basic architectural features of the three platforms used in the study. We describe the coloring algorithms in detail and discuss their relationship with previous work in Section 3. In Section 4, we discuss the rationale for, the generation of, and the characteristics of the synthetic graphs used in the study. The experimental results are presented and analyzed in detail in Section 5. We end by drawing broader conclusions in Section 6.
Related work. Graph coloring has a vast literature, and various approaches have been taken to solve coloring problems on computers. Exact algorithms include those based on integer programming, semidefinite programming, and constraint programming. Heuristic approaches include the greedy algorithms mentioned earlier, local search algorithms, population-based methods, and methods based on successively finding independent sets in the graph [12]. There have been two DIMACS implementation challenges on coloring [14], where the focus was on obtaining the smallest number of colors possible for any problem instance; algorithms merely focused on this objective typically have large running times, and as a result they can handle only small instances of graphs, often with at most a thousand vertices.
A different approach has been taken by Turner [33], who analyzes a heuristic algorithm due to Brélaz [7]. Turner considers random graphs that have the property that they can be colored with colors, where is a constant, and shows that Brélaz’s algorithm colors such graphs with high probability using colors. Further analysis of this phenomenon is provided by Coja-Oghlan, Krivelevich, and Vilenchik [9]. An experimental study we conducted in a related work [19] has shown that on many graphs from various application areas, a greedy coloring algorithm, initialized with appropriate vertex ordering techniques, yields fewer colors than Brélaz’s algorithm, while running faster. A survey of several graph coloring problems (e.g., distance-, distance-, star, and acyclic coloring on general graphs; and partial distance- coloring on bipartite graphs) as they arise in the context of automatic differentiation is provided in Gebremedhin et al. [18]. Effective heuristic algorithms for the star and acyclic coloring problems and case studies demonstrating the use of those coloring algorithms in sparse Hessian computation have been presented in subsequent works [21, 20].
2 Architectures
The three platforms considered in this study—an Intel Nehalem, a Sun Niagara 2, and a Cray XMT—represent a broad spectrum of multithreading capabilities and memory structure. The Intel Nehalem relies primarily on a cache-based hierarchical memory system as a means for hiding latencies, supporting just two threads per core. The Cray XMT has a flat, cache-less memory system and uses massive multithreading as the sole mechanism for tolerating latencies in data access. The Sun Niagara 2 offers a middle path by using a moderate number of hardware-threads along with a hierarchical memory system. We review in the remainder of this section some of the specific architectural features and programming abstractions available in the three systems, focusing on aspects relevant to our work on algorithm design and performance evaluation.
2.1 The Intel Nehalem
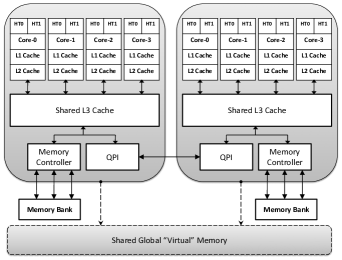
The Intel system we considered, Nehalem EP (Xeon E5540), consists of two quad-core Gainestown processors running at GHz base core frequency. See Figure 1 for a block diagram. Each core supports two threads and has one instruction pipeline. The multithreading variant on this platform is simultaneous, which means multiple instructions from ready threads are executed in a given cycle.
The system has GB total memory. The memory system per core consists of: KB, -way associative I1 (Instruction) cache; KB, -way associative L1 cache; MB, -way associative L2 cache; and MB L3 cache shared by the four cores. The maximum memory bandwidth of the system is GB/s, the on-chip latency is 65 cycles, and the latency between processors is cycles.
On Nehalem, the quest for good performance is addressed not only via caching, that is, exploitation of spatial and temporal locality, but also through various advanced architectural features. The advanced features include: loop stream detection (recognizing instructions belonging to loops and avoiding branch prediction in this context); a new MESIF cache coherency protocol that reduces coherency control traffic; two branch-target buffers for improved branch prediction; and out-of-order execution. In MESIF, the states are Modified, Exclusive, Shared, Invalid, and a new Forward state; only one instance of a cache line can be in the Forward state, and it is responsible for responding to read requests for the cache line, while the cache lines in the Shared state remain silent, reducing coherency traffic. For further architectural details on the Nehalem, see, for example, the paper [29].
2.2 The Sun Niagara 2
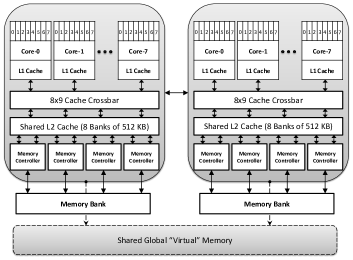
The Sun UltraSPARC T2 platform, Niagara 2, has two -core sockets with each core supporting hardware threads. Figure 2 shows a block diagram. Similar to the Nehalem, multithreading on the Niagara 2 is simultaneous. The system has a shallow instruction pipeline (in contrast to the XMT), and each core has two integer execution units, a load/store unit, and a floating-point unit. The pipeline is capable of issuing two instructions per cycle, either from the same thread or from different threads. Threads are divided into two groups of four, and one instruction from each group may be selected based on the least-recently fetched policy on ready threads. The clock frequency of the processor is GHz.
The total size of the memory system is GB. Each core has an KB, -way associative L1 cache for data and a KB, -way associative I1 cache for instructions. Unlike Nehalem, where L2 cache is private, Niagara 2 has a shared, -way associative L2 cache of size MB . The cache is arranged in banks and is shared using a crossbar switch between CPUs. The latency is cycles for local memory accesses and cycles for remote memory accesses. The peak memory bandwidth is GB/s for reads and GB/s for writes. See [32] for additional details.
2.3 The Cray XMT
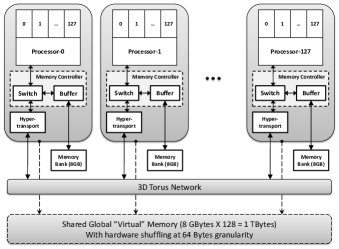
The Cray XMT platform used in this study is comprised of Cray Threadstorm (MTA-2) processors interconnected via a D torus. Figure 3 shows a block diagram of the platform from a programmer’s point of view. Each processor has hardware thread-streams and one instruction pipeline. Each thread-stream is equipped with general purpose registers, target registers, a status word, and a program counter. Consequently, each processor can maintain up to separate software threads. In every cycle, a processor context switches among threads with ready instructions in a fair manner choosing one of the threads to issue its next instruction. In other words, the multithreading variant on the XMT, in contrast to Nehalem and Niagara 2, is interleaved. A processor stalls only if no thread has a ready instruction. There are three functional units, M, A, and C for executing the instructions. On every cycle, the M-unit can issue a read or write operation, the A-unit can execute a fused multiply-add, and the C-unit can execute either a control or an add operation. Instruction execution on the XMT is deeply pipelined, with a -stage pipeline. The clock frequency is MHz.
Memory system
The memory system of the XMT is cache-less, and is globally accessible by all processors. The system supports a shared memory programming model. The global address space is built from physically distributed memory modules of GB per processor, yielding a total memory size of TB. Further, the address space is built using a hardware hashing mechanism that maps the data randomly to the memory modules, in blocks of size bytes, to minimize conflicts and hot-spots. All memory words are bytes wide and the memory is byte-addressable. The worst-case memory latency is approximately cycles, and the average value is around cycles. The sustainable minimum remote memory reference rate is GB/s per processor for random reads and GB/s per processor for random writes. Memory access rates scale with the number of processors.
Fine-grained synchronization
Associated with every word are several additional bits—a full/empty bit, a pointer forwarding bit, and two trap bits. These are used for fine-grained synchronization. The XMT provides many efficient extended memory semantic operations for manipulating the full/empty bits in one clock cycle. Listed below are examples of functions effecting such semantic operations—many of these functions are used in the XMT-specific coloring algorithms we have developed:
- purge
-
sets the full/empty bit to empty and assigns a zero value to the memory location of the associated word.
- readff
-
reads a memory location only when the full/empty bit is full and leaves the bit full when the read completes.
- readfe
-
reads a memory location only when the full/empty bit is full and leaves the bit empty when the read completes.
- writeef
-
writes to a variable only if the full/empty bit is empty and leaves the bit full when the write completes.
If any extended memory semantic operation finds the full/empty bit in the wrong state, the operation waits. The request returns to the issuing processor and is placed in a queue to be retried. Note that the instruction is issued only once, and while the instruction is being retried, the processor continues to issue instructions from other threads. See [15, 30] for further details about the XMT platform.
2.4 Quick comparison
| Nehalem | Niagara 2 | Cray XMT | |
| Clock (GHz) | 2.53 | 1.165 | 0.5 |
| Sockets | 2 | 2 | 128 |
| Cores/socket | 4 | 8 | - |
| Threads/core | 2 | 8 | 128 |
| Threads total | 16 | 128 | 16,384 |
| Multithreading | simultaneous | simultaneous | interleaved |
| Memory (GB) | 24 | 32 | 1,024 |
| Cache | L1/L2, shared L3 | L1, shared L2 | cache-less, flat |
| Bandwidth | max: | peak: | remote: |
| 25.6 GB/s | 50 GB/s (read), | 0.52 GB/s/proc (read), | |
| 26 GB/s (write) | 0.26 GB/s/proc (write) | ||
| Latency | 65 cycles (on-chip), | 129 cycles (local), | 600 cycles (average), |
| 106 cycles (b/n proc) | 193 cycles (remote) | 1,000 cycles (worst-case) |
Table 1 provides a quick comparative summary of some of the key architectural features of the three platforms discussed in Sections 2.1 to 2.3. Note that the bandwidth and latency numbers listed in Table 1 are peak values. With quick experiments on the Nehalem and Niagara 2 systems using the benchmarking tool libmicro, the bandwidth and latency numbers we observed were roughly about a factor of two worse than those listed in Table 1.
3 The algorithms
We describe in this section the multithreaded distance-1 coloring algorithms we developed for architectures such as those discussed in Section 2. We begin the section with a quick review of the problem, the underlying serial algorithm we use to solve it, and prior work on parallelization.
3.1 Background
The problem
Graph coloring problems come in several variations [18]. The variant considered in this paper is distance-1 coloring, an assignment of positive integers (called colors) to vertices such that adjacent vertices receive different colors. The objective of the associated problem is to minimize the number of colors used. The problem has long been known to be NP-hard to solve optimally. Recently, it has been shown that, for all , the problem remains NP-hard to approximate to within , where is the number of vertices in the graph [35].
An effective algorithm
Despite these pessimistic theoretical results, for many graphs or classes of graphs that occur in practice, solutions that are provably optimal or near-optimal can be obtained using a greedy (aka sequential) algorithm. The greedy algorithm runs through the set of vertices in some order, at each step assigning a vertex the smallest permissible color. We give a formal presentation of an efficient formulation of the greedy algorithm in procedure Greedy (Algorithm 1). The formal presentation is needed since the procedure forms the foundation for the parallel algorithms presented in this paper.
In Algorithm 1, and in other algorithms specified later in this paper, denotes the set of vertices adjacent to the vertex , color is a vertex-indexed array that stores the color of each vertex, and forbiddenColors is a color-indexed array used to mark the colors that are impermissible to a particular vertex. The array color is initialized at the beginning of the procedure with each entry color[] set to zero, to indicate that vertex is not yet colored. Each entry of the array forbiddenColors is initialized once at the beginning of the procedure with some value . By the end of the inner for-loop in Algorithm 1, all of the colors that are impermissible to the vertex are recorded in the array forbiddenColors. In Line 6, the array forbiddenColors is scanned from left to right in search of the lowest positive index at which a value different from , the vertex being colored, is encountered; this index corresponds to the smallest permissible color to the vertex . The color assignment is done in Line 7.
Note that since the colors impermissible to the vertex are marked in the array forbiddenColors using as a label, rather than say a boolean flag, the array forbiddenColors does not need to be re-initialized in every iteration of the loop over the vertex set . Further, the search for color in Line 6 terminates after at most attempts, where is the degree of vertex . Therefore, the work done while coloring a vertex is proportional to its degree, independent of the size of the array forbiddenColors. Thus the time complexity of Greedy is , or simply if the graph is connected. It can also be seen that the number of colors used by the algorithm is never larger—and often significantly smaller—than , where is the maximum degree in the graph. With good vertex ordering techniques, the number of colors used by Greedy is in fact often near-optimal for practical graph structures and always bounded by , where is the maximum back degree—number of already colored neighbors of a vertex—in the vertex ordering used by Greedy [19]. A consequence of the fact that the number of colors used by Greedy is bounded by is that the array forbiddenColors need not be of size larger than that bound.
Parallelizing the greedy algorithm
Because of its sequential nature, Greedy is challenging to parallelize, when one also wants to keep the number of colors used close to the serial case. A number of approaches have been investigated in the past to tackle this issue. One class of the investigated approaches relies on iteratively finding a maximal independent set of vertices in a progressively shrinking graph and coloring the vertices in the independent set in parallel. In many of the methods in this class, the independent set itself is computed in parallel using some variant of Luby’s algorithm [26]. An example of a method developed along this direction is the work of Jones and Plassmann [23]. Finocchi, Panconesi, and Silvestri [16] also follow this direction, but enhance their algorithm in many other ways as well.
Gebremedhin and Manne [17] proposed speculation as an alternative strategy for coping with the inherent sequentiality of the greedy algorithm. The idea here is to abandon the requirement that vertices that are colored concurrently form an independent set, and instead color as many vertices as possible concurrently, tentatively tolerating potential conflicts, and detect and resolve conflicts afterwards. A basic shared-memory algorithm based on this strategy is given in [17]. The main steps of the algorithm are to distribute the vertex set equally among the available processors, let each processor speculatively color its vertices using information about already colored vertices (Phase 1), detect eventual conflicts in parallel (Phase 2), and finally re-color vertices involved in conflicts sequentially (Phase 3).
Bozdağ et al. [6] extended the algorithm in [17] in a variety of ways to make it suitable for and well-performing on distributed memory architectures. One of the extensions is replacing the sequential re-coloring phase with a parallel iterative procedure. Many of the other extensions are driven by performance needs in a distributed-memory setting: the graph needs to be partitioned among processors in a manner that minimizes communication cost and maximizes concurrency; the speculative coloring phase is better when organized in a bulk synchronous fashion where computation and communication are coarse-grained; etc. In addition, they investigate a variety of techniques for choosing colors for vertices and relative ordering of interior and boundary vertices, a distinction that arises due to the partitioning among processors. When all the ingredients are put together, it was shown that the approach based on speculation and iteration outperforms independent set-based approaches. The framework of [6] is used for the design of a distributed-memory parallel algorithm for distance-2 coloring in [5].
3.2 Iterative parallel coloring algorithm
In this paper, we adapt the distributed-memory iterative parallel coloring algorithm developed in [6] to the context of multithreaded, shared-memory platforms. In the distributed-memory setting, the parallel coloring algorithm relies on graph partitioning to distribute and statically map the vertices and coloring tasks to the processors, whereas in the multithreaded case the vertex coloring tasks are scheduled on processors from a pool of threads created with appropriate programming constructs.
The algorithm we use here, formally outlined in Algorithm 2, proceeds in rounds. Each round has two phases, a tentative coloring phase and a conflict detection phase, and each phase is executed in parallel over a relevant set of vertices (see lines 5 and 11). In our implementation, the loops in lines 5 and 11 are parallelized using the OpenMP directive #pragma omp parallel for, and those parallel loops can be scheduled in any manner. The tentative coloring (first) phase is essentially the same as Algorithm 1, except that it is concurrently run by multiple threads; in Algorithm 2, the array forbiddenColors is private to each thread. In the conflict-detection (second) phase, each thread examines a relevant subset of vertices that are colored in the current round for consistency and identifies a set of vertices that needs to be re-colored in the next round to resolve any detected conflicts— a conflict is said to have occurred when two adjacent vertices get the same color. Given a pair of adjacent vertices involved in a conflict, it suffices to recolor only one of the two to resolve the conflict. In Algorithm 2, as can be seen in Line 13, the vertex with the higher index value is chosen to be re-colored in the event of a conflict. Algorithm 2 terminates when no more vertices to be re-colored are left.
3.3 Cray XMT-specific algorithms
We implemented Algorithm 2 on the Cray XMT by replacing the OpenMP directive #pragma omp parallel for used to parallelize lines 5 and 11 with the XMT directive #pragma mta assert parallel. Typically, parallel algorithms written for conventional processors are too coarse-grained to effectively use the massive multithreading capability provided by the XMT; hence, we were motivated to explore the potential of an alternative algorithm that employs fine-grained synchronization of threads and avoids the occurrence of conflicts (hence the need for re-coloring) in greedy coloring.
3.3.1 A dataflow algorithm
Using the extended memory semantic operations of the XMT functions discussed in Section 2.3 for fine-grained synchronization of threads, we developed a dataflow algorithm for coloring, which is formally outlined in Dataflow (Algorithm 3). The algorithm consists of two parallel loops. The first loop purges the array used to store the color of each vertex. The second loop runs over all vertices with thread responsible for coloring vertex . It has two steps. First, the thread reads the color chosen by the neighbors of with higher precedence. We use the indices of the vertices to define the precedence order such that vertices with smaller indices will have higher precedence. Second, having read the colors, the thread chooses the smallest permissible color and assigns it to the vertex . Because a readff is used to read the colors of neighbors of and a writeef to write the color of , the algorithm is race-free. Leaving the XMT-specific mechanism in which concurrent execution is made possible aside, note that this algorithm is conceptually the same as the Jones-Plassmann algorithm [23].
3.3.2 A recursive dataflow algorithm
As written, the algorithm Dataflow may deadlock on a system with fewer compute resources than vertices, since only a subset of the threads can start; the others need to wait for resources to become available. If all active threads read vertices whose threads are waiting, deadlock occurs.
The deadlock can be eliminated in one of three ways: 1) preemption, 2) ordering, or 3) recursion. Preempting blocked threads is expensive, and is a poor choice when high-performance and scalability are important goals. Ordering the threads to ensure progress may not be possible in all cases, and in many cases, computing a correct order is expensive. Using recursion is a simple and often efficient way to eliminate deadlock in dataflow algorithms executing on systems with limited compute resources.
We outline the deadlock-free recursive variant of the dataflow coloring algorithm in procedure DataflowRecursive (Algorithm 4). The function ProcessVertex (Algorithm 5) is now responsible for coloring vertex . Its code is similar to the body of the second loop of Dataflow (Algorithm 3). Before reading a neighbor’s color, the procedure checks whether or not the neighbor is processed. If the neighbor is processed, the procedure issues a readff to read its color; if the neighbor is not processed, the procedure processes the neighbor itself. The recursive algorithm stores the state of each vertex in a new array named state; a value of zero indicates that a vertex is unprocessed. The algorithm also utilizes the XMT intrinsic function int_fetch_add to manipulate the state of each vertex. The function is an atomic operation that increments the value of a given memory location with a given constant and returns the original value. Note that the procedure ProcessVertex is called only once per vertex—when its state is zero. Hence the overall work performed by the algorithm is linear in the input size.
4 Test Graphs
We studied the performance of algorithms Iterative and DataflowRecursive on the three platforms discussed in Section 2 using a set of synthetically generated graphs. The test graphs are designed to represent a wide spectrum of input types. We briefly discuss in this section the algorithm used to generate the test graphs and the key structural properties (relevant to the performance of the coloring algorithms) of the generated graphs.
4.1 The graph generator
The test graphs were created using the R-MAT graph generator [8]. Let the graph to be generated consist of vertices and edges. The R-MAT algorithm works by recursively subdividing the adjacency matrix of the graph to be generated (a by matrix) into four quadrants , , , and , and distributing the edges within the quadrants with specified probabilities. The distribution is determined by four non-negative parameters (, , , ) whose sum equals one. Initially every entry of the adjacency matrix is zero (no edges added). The algorithm places an edge in the matrix by choosing one of the four quadrants , , , or, with probabilities , , , or, , respectively. The chosen quadrant is then subdivided into four smaller partitions and the procedure is repeated until a quadrant is reached, where the entry is incremented (that is, the edge is placed). The algorithm repeats the edge generation process times to create the desired graph .
By choosing the four parameters appropriately, graphs of varying characteristics can be generated.
We generated three graphs of the same size but widely varying structures by
using the following set of parameters:
; ; .
We call the three graphs RMAT-ER, RMAT-G, and RMAT-B, respectively. (The suffix ER stands for “Erdős-Rényi,” G and B stand for “good” and “bad” for reasons that will be apparent shortly.) Table 2 provides basic statistics on the structures of the three graphs. The graphs were generated on the XMT using an implementation of the R-MAT algorithm similar to the one described in [2]. The graphs were then saved on disk for reuse on other platforms. Duplicate edges and self loops were removed; the small variation in the number of edges is due to such removals. The sizes of the graphs were chosen so that they would fit on all three of the platforms we consider. For scalability study on the XMT, however, we generated larger graphs using the same three sets of four parameters; we shall encounter these in Section 5, Table 4.
| Graph | No. | No. | Avg. | Max. | Variance |
|---|---|---|---|---|---|
| Vertices | Edges | Deg. | Deg. | ||
| RMAT-ER | 16,777,216 | 134,217,654 | 16 | 42 | 16.01 |
| RMAT-G | 16,777,216 | 134,181,095 | 16 | 1,278 | 415.72 |
| RMAT-B | 16,777,216 | 133,658,229 | 16 | 38,143 | 8,085.64 |
4.2 Characteristics of the test graphs
The test graphs are designed to represent instances posing varying levels of difficulty for the performance of the multithreaded coloring algorithms. The three graphs in Table 2 are nearly identical in size, implying that the serial work involved in the algorithms is the same, but they vary widely in degree distribution of the vertices and density of local subgraphs. Both of these have implications on available concurrency in algorithms Iterative and DataflowRecursive: large-degree vertices and dense subgraphs would increase the likelihood for conflicts to occur in Iterative and would cause more “serialization” in DataflowRecursive, thereby impacting parallel performance.
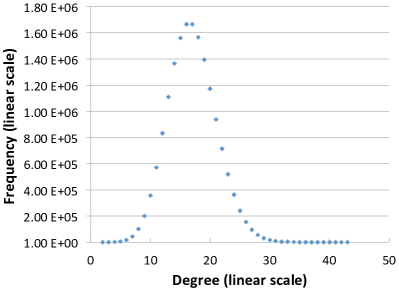
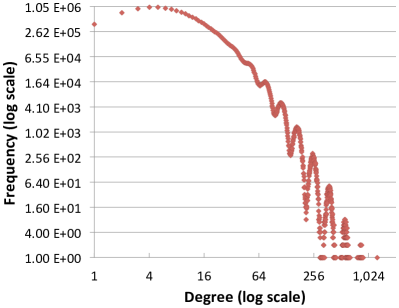
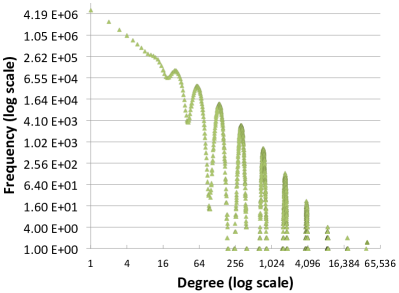
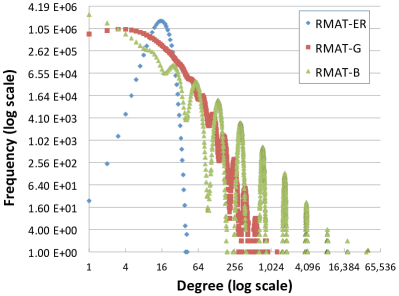
Figure 4 summarizes the vertex degree distributions in the three graphs. The graph RMAT-ER belongs to the class of Erdős-Rényi random graphs, since . Its degree distribution is expected to be normal. The single local maximum observed in the corresponding curve in the degree distribution plot depicted in Figure 4(a) is consistent with this expectation. In the graphs RMAT-G and RMAT-B, “subcommunities” (dense local subgraphs) are expected to form because of the larger values of and compared to and ; the subcommunities are coupled together in accordance with the values of and . The multiple local maxima observed in the degree distributions of these two graphs, shown in Figures 4(b) and 4(c), correlate with the existence of such communities.
Besides degree distribution, the three test graphs also vary highly in terms of maximum degrees and degree variances (see Table 2). As an additional measure for the structural variation represented by the three graphs, we computed the clustering coefficients of vertices in these graphs using the tool GraphCT666Available at http://trac.research.cc.gatech.edu/graphs/wiki/GraphCT. The local clustering coefficient of a vertex is the ratio between the actual number of edges among the neighbors of to the total possible number of edges among [34]. The average clustering coefficient in the graph is the sum of all local clustering coefficients of vertices divided by the number of vertices.
| Avg. CC | |
|---|---|
| RMAT-ER | |
| RMAT-G | |
| RMAT-B |
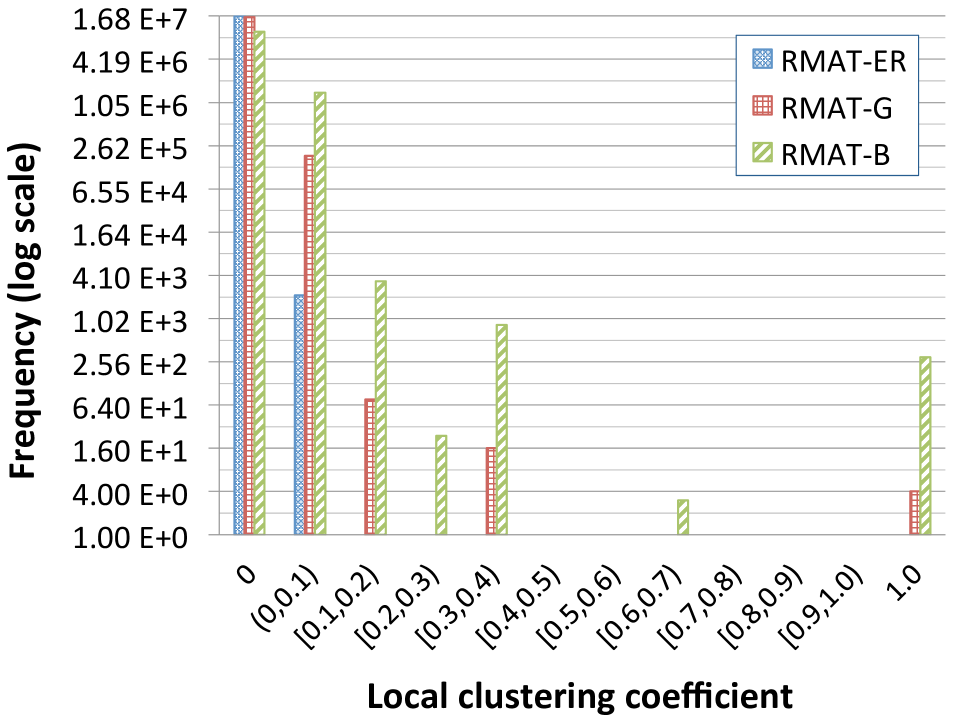
Tabulated in Figure 5(a) is the average clustering coefficient in each of the three test graphs. The numbers there show orders of magnitude progression as one goes from RMAT-ER to RMAT-G to RMAT-B. Figure 5(b) shows the distribution of local clustering coefficients, categorized in blocks of values. For the RMAT-ER graph, the local clustering coefficient of any vertex is found to be either 0, or between 0 and 0.1, whereas the values are spread over a wider range for the RMAT-G graph and even wider range for the RMAT-B graph. Larger local clustering coefficients in general indicate the presence of relatively dense local subgraphs, or subcommunities, as referred to earlier.
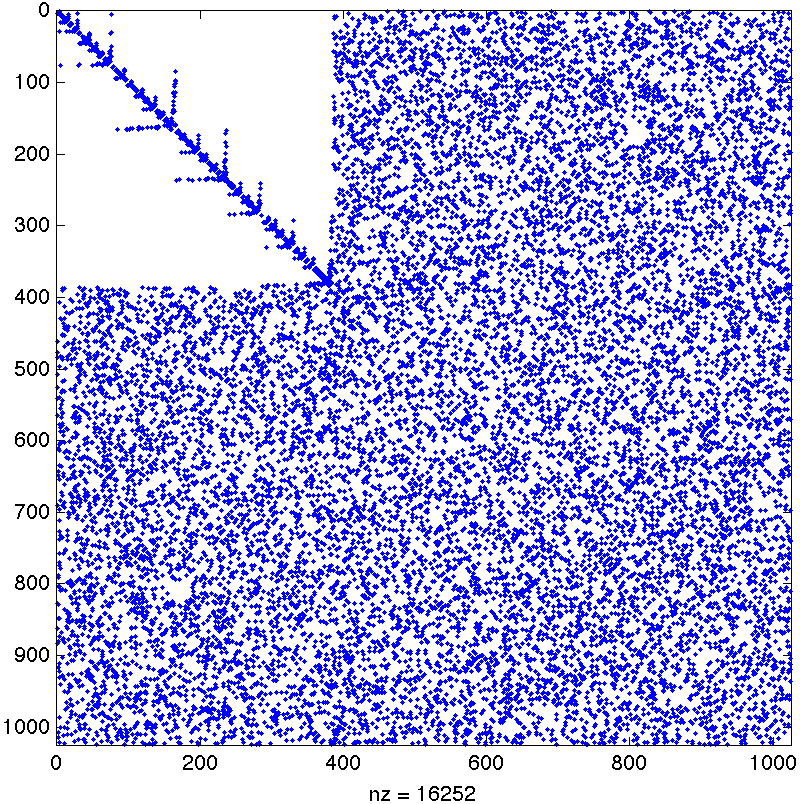
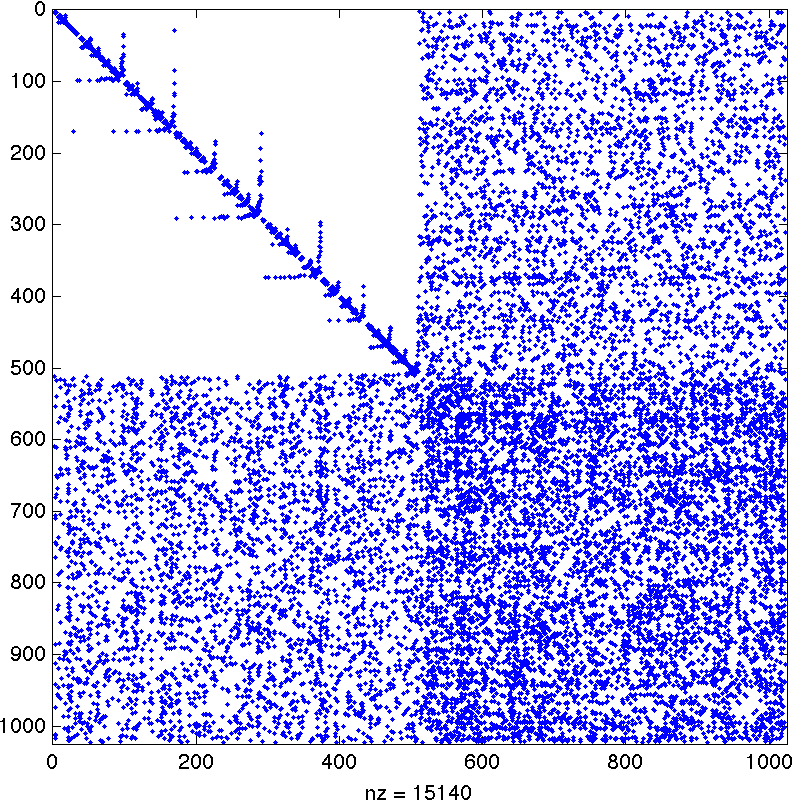
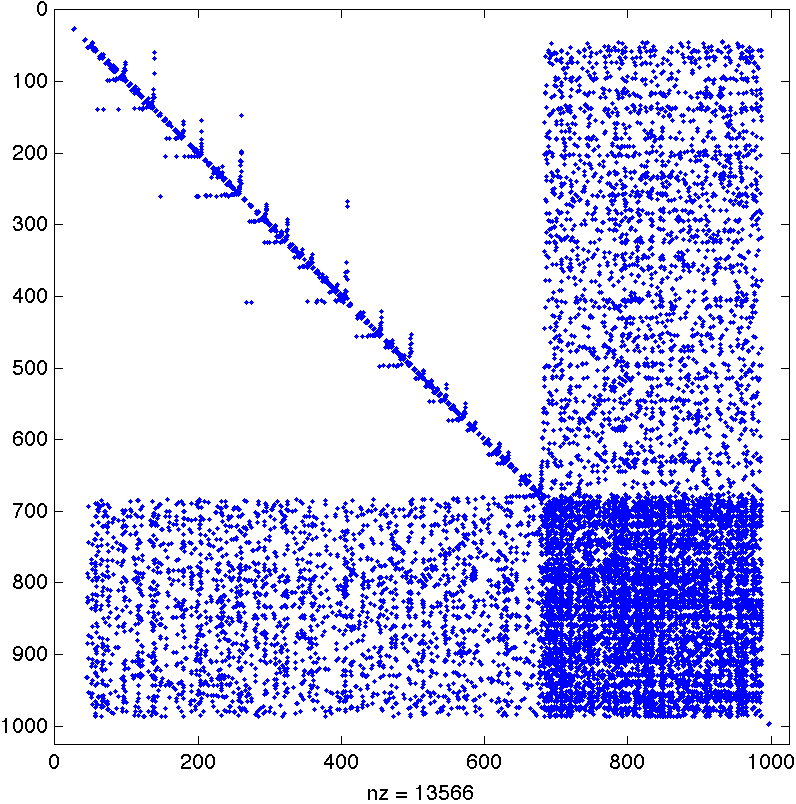
Finally, to visualize the difference in the structure represented by the three graphs, we include in Figure 6 plots generated with MATLAB’s spy function of the adjacency matrices of scaled-down versions of the three test graphs (1,024 vertices and 16,252 edges). To aid visual appeal, in the spy-plots, the columns have been re-ordered using the Approximate Minimum Degree (AMD) routine in MATLAB; loosely speaking, AMD orders lower degree vertices (columns) before higher degree vertices in a graph model of sparse Gaussian elimination that updates the degrees of vertices dynamically [1].
Based on the variation in maximum degree value, degree distribution, and clustering coefficient values the three test graphs represent, one can see that a fairly wide spectrum of input types is covered in the experimental study.
5 Experimental Results
With the test graphs discussed in Section 4 serving as inputs, we present in this section experimental results on the scalability of and the number of colors used by the algorithms Iterative and DataflowRecursive when they are run on the three platforms described in Section 2. We begin the section by discussing various matters on experimental setup in Sections 5.1 through 5.4. The scalability results are presented in Sections 5.5, 5.6, and 5.7, and the results on the number of colors used are presented in Section 5.8. The purpose of Section 5.5 is to discuss the scalability results on each of the three platforms separately while that of Section 5.6 is to draw comparisons. Section 5.7 shows results analyzing the performance of Iterative in more detail.
5.1 Locality Not Exploited
The R-MAT algorithm tends to generate graphs where most high-degree vertices are of low indices. In the tests we run, we randomly shuffled vertex indices in order to reduce the benefits of this artifact on architectures with caches and to minimize memory-hotspotting. The vertices were then colored in the resulting numerical order in both algorithms.
5.2 Compilers Used
Algorithm Iterative was implemented on the Nehalem and Niagara 2 platforms using OpenMP. On the Cray XMT, both Iterative and DataflowRecursive were implemented using the XMT programming model. Table 3 summarizes the compilers and flags used on each platform.
| Compiler | Flag | |
|---|---|---|
| Nehalem | Intel 11.1 | -fast |
| Niagara 2 | Sun Studio 5.9 | -fast -xopenmp -m64 |
| XMT | Cray Native C/C++ | -par |
5.3 Thread Scheduling
In both Iterative and DataflowRecursive, there is a degree of freedom in the choice of thread scheduling policy for parallel execution. Both the OpenMP and the XMT programming models offer directives supporting different kinds of policies. We experimented with various policies (static, dynamic, and guided with different block sizes) on the three platforms to assess the impact of the policies on performance. We observed no major difference in performance for the experimental setup we have, that is, RMAT-generated graphs with vertex indices randomly shuffled. Note, however, that for vertex orderings that exhibit some locality (e.g., some high degree vertices are clustered together) scheduling policies could affect performance due to cache effects. In the results reported in this paper, we have used the default static scheduling on all platforms.
5.4 Thread Binding
In the experiments on scalability, we used various platform-specific thread binding mechanisms.
On the Nehalem, binding was achieved using a high-level affinity interface,
the environment variable KMP_AFFINITY from the Intel compiler.
Recall that the Nehalem has two sockets with four cores per socket, and
two threads per core, amounting to threads in total.
The eight threads on the four cores of the first socket are
numbered (procID) as
,
where the first pair corresponds to the threads
on the first core, the second pair to the threads on the second core, etc.
Similarly the remaining eight threads on the second socket are numbered as
.
With such topology in place, we bound the OpenMP threads to the cores by
assigning the procID to KMP_AFFINITY. For example,
to run a job with four OpenMP threads on four cores (one thread per core), we set
KMP_AFFINITY="verbose,proclist=[9,8,15,14]"
and OMP_NUM_THREADS=4.
Notice here that threads from the two sockets, rather than from
only one, are engaged. Note also that the threads are bound to cores that are as far apart as possible.
These seemingly counter-intuitive choices are made to maximize bandwidth.
Recall that the memory banks in the Nehalem system (see Figure 1)
are associated with sockets, and each socket has independent channels to its memory bank.
Engaging the two sockets would thus increase the effective memory bandwidth available.
Such a choice could, however, be counter-productive for small problems that fit in a single bank,
or for cache reuse between threads.
Niagara 2 provides a mechanism for binding the threads to processors using SUNW_MP_PROCBIND. This was exploited in the experiments by binding , , , or threads to each core to get results from to threads.
5.5 Scalability Results
5.5.1 Scalability of Iterative on Nehalem and Niagara 2
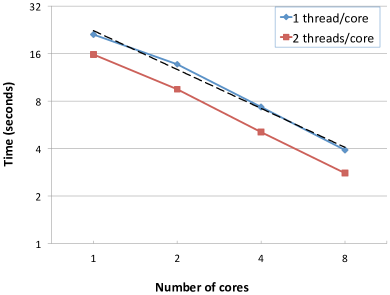
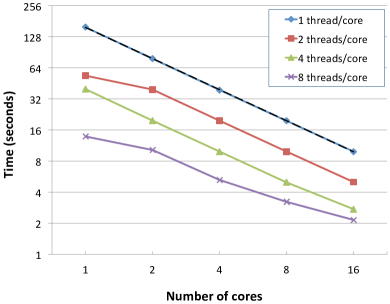
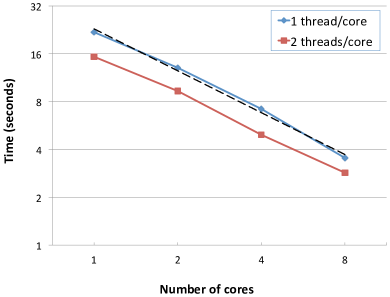
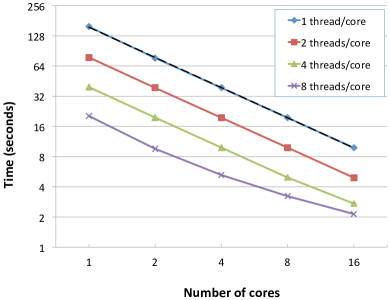
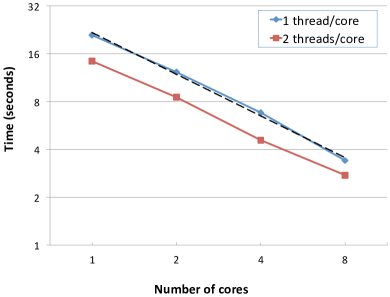
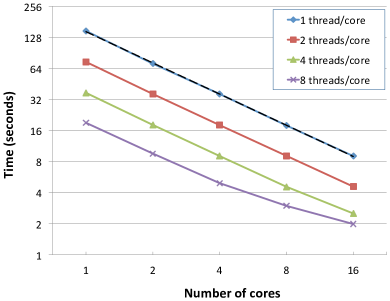
Figure 7 gives a summary of strong scaling results of algorithm Iterative on the three test graphs RMAT-ER, RMAT-G, and RMAT-B listed in Table 2. The left column shows results on the Nehalem platform, and the right column shows results on the Niagara 2 platform. On each platform, different numbers of threads per core were utilized via thread binding. In the sets of results on both architectures, the curve represented by the dashed line corresponds to ideal speedup in the case where one thread per core is used. It can be seen that the strong scaling behavior of algorithm Iterative is near-ideal on both architectures across all three input types considered, when one thread per core is used.
The results in Figure 7 corresponding to the use of multiple threads per core on both the Nehalem and Niagara 2 show the benefit of exploiting simultaneous multithreading (SMT). On the Nehalem, by using two threads per core, instead of one, we obtained relative speedups ranging from to , depending on the number of cores used and the type of input graph considered. The observed speedup due to SMT is less than the ideal factor of two, and the difference is more pronounced when the number of cores increases to eight. Note that the speedup is greater for the RMAT-ER graph than for the RMAT-B and RMAT-G graphs. This is because the memory accesses in the RMAT-ER graphs pose less performance challenges than the accesses in the RMAT-B and RMAT-G graphs, due to the presence of a larger number of dense subgraphs in the latter two. The speedup we obtained via the use of SMT on the Nehalem is consistent with the results reported in [4], where the authors measured the runtime reduction (speedup) obtained by employing SMT on the Nehalem on seven application codes. The authors found only a 50 percent reduction in the best case, and for four of the codes, they observed an increase in runtime (slowdown), instead of decrease (speedup).
The speedup due to SMT we obtained on the Niagara 2 (the right column in Figure 7) is more impressive than that on the Nehalem. By and large, we observed that the runtime of Iterative using threads on cores is about the same as the runtime using threads on cores, except when is , in which case the relative gain due to SMT is smaller.
5.5.2 Scalability of Iterative and DataflowRecursive on the XMT
| Graph | Scale | No. | No. | Max. | Variance | % Isolated |
| Vertices | Edges | Deg. | vertices | |||
| RMAT-ER | 24 | 16,777,216 | 134,217,654 | 42 | 16.00 | 0 |
| 25 | 33,554,432 | 268,435,385 | 41 | 16.00 | 0 | |
| 26 | 67,108,864 | 536,870,837 | 48 | 16.00 | 0 | |
| 27 | 134,217,728 | 1,073,741,753 | 43 | 16.00 | 0 | |
| RMAT-G | 24 | 16,777,216 | 134,181,095 | 1,278 | 415.72 | 2.33 |
| 25 | 33,554,432 | 268,385,483 | 1,489 | 441.99 | 2.56 | |
| 26 | 67,108,864 | 536,803,101 | 1,800 | 469.43 | 2.81 | |
| 27 | 134,217,728 | 1,073,650,024 | 2,160 | 497.88 | 3.06 | |
| RMAT-B | 24 | 16,777,216 | 133,658,229 | 38,143 | 8,085.64 | 30.81 |
| 25 | 33,554,432 | 267,592,474 | 54,974 | 9,539.17 | 32.34 | |
| 26 | 67,108,864 | 535,599,280 | 77,844 | 11,213.79 | 33.87 | |
| 27 | 134,217,728 | 1,071,833,624 | 111,702 | 13,165.52 | 35.37 |
Larger test graphs. The Cray XMT provides about TB of global shared memory and massive concurrency ( 16,384-way interleaved multithreading). Both capabilities are much larger than what is available on the other two platforms. To make use of this huge resource and assess scalability, we experimented with larger RMAT graphs generated using the same parameters as in the experiments thus far but with different scales. The characteristics of these graphs are summarized in Table 4. In the table, the number of vertices (third column) is equal to , where is the scale shown in the second column.
Thread allocation. In contrast to the Niagara 2 and Nehalem, where thread allocation and binding is static, the corresponding tasks on the XMT are dynamic. However, one can place a system request for a maximum number of streams (the XMT term for threads) for a given execution on the XMT. In our experiments, we requested streams, an empirically determined optimal number for keeping all processors busy. The runtime system then decides as to how many will actually get allocated. We observed that at the beginning of the execution of the coloring algorithms, we do get close to streams. Then, the number drastically decreases and gets to around towards the end of the execution, when little computational work is left.
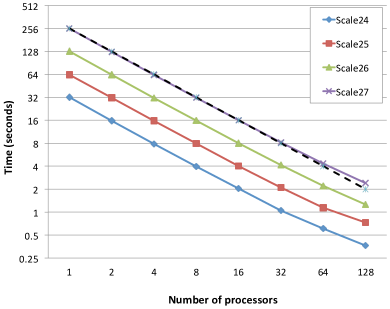
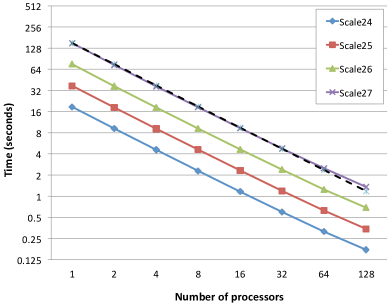
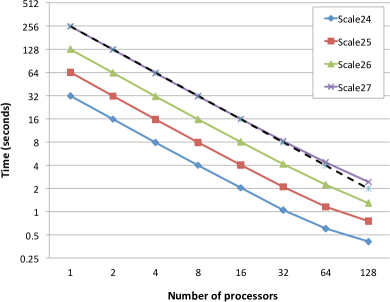
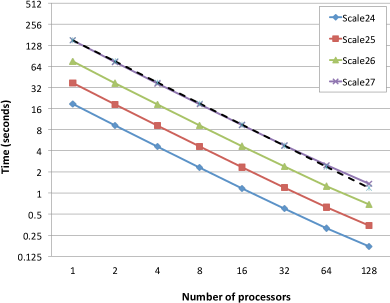
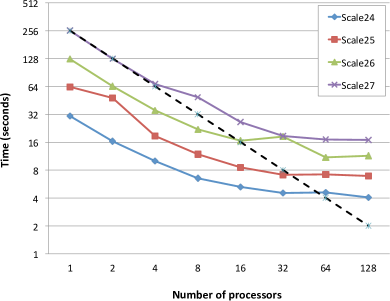
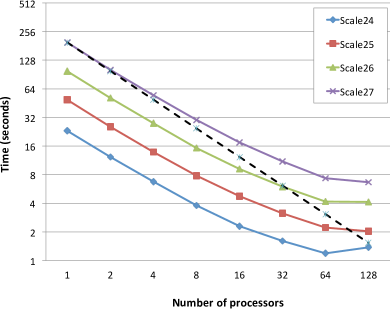
Scalability results. The scalability results we obtained on the XMT with the maximum streams system request and using the large test graphs listed in Table 4 are summarized in Figure 8; the left set of figures shows results on algorithm Iterative and the right set of figures shows results on algorithm DataflowRecursive. In each case the ideal (linear) scaling of the largest (scale 27) graph is depicted by the dashed line.
It can be seen that both Iterative and DataflowRecursive scale well to the maximum number of available processors (128) on the RMAT-ER and RMAT-G graphs; on the RMAT-B graph, DataflowRecursive scales to 64 processors and Iterative to 16 processors. The poorer scalability of Iterative is likely due to the relatively large number of conflicts generated (and consequently, the relatively large number of iterations required) as a result of the massive concurrency utilized on the XMT in coloring the vertices. It can also be seen that the runtime of Iterative is about twice that of DataflowRecursive. This is mainly because of the conflict-detection phase in Iterative, which entails a second pass through the (sub)graph data structure, a phase that is absent in DataflowRecursive.
Note that Figure 8 also shows weak scaling results. In each subfigure, observe that the input size is doubled as one goes from one input size (say 24) to the next (say 25) and the number of processors is doubled as one goes from one data point on the horizontal axis to the next. Imagine running a horizontal line cutting through the four curves in each subfigure. In most of the figures such a line will intersect the four curves at points that correspond to a near-ideal weak scaling behavior.
5.6 Scalability Comparison on the Three Architectures
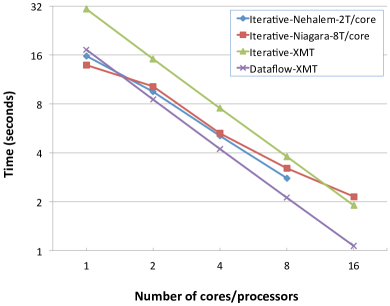
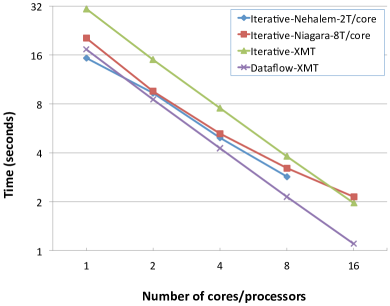
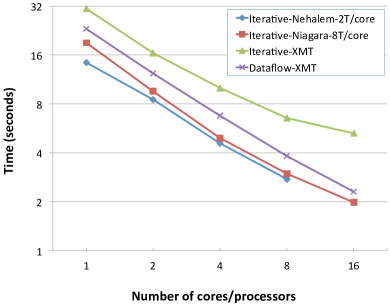
Figures 7 and 8 have already shown some of the differences in performance observed on the three architectures. For further cross-platform comparison, we provide in Figure 9 a condensed summary of strong scaling results on all three platforms at once. The three subfigures show results corresponding to runtimes in seconds on the three test graphs of Table 2. In each subfigure four runtime plots are shown, three corresponding to the performance of Iterative on the three platforms and one corresponding to the performance of DataflowRecursive on the XMT.
To enable a common presentation on all three platforms, we have shown in Figure 9 results on fewer processing units than what is available on the Cray XMT. In particular, we show results when up to cores on the Nehalem, cores on the Niagara 2, and processors on the XMT are used. Note also that for a given number of cores (or processors in the case of XMT), the amount of concurrency utilized and the type of multithreading (MT) employed varies from platform to platform. On the XMT, out of the threads available per processor, a system request for a maximum of was placed. On the Niagara 2, the maximum eight threads available per core were used, and on Nehalem the two available threads per core were used. This means the total amount of concurrency involved is a possible maximum of 12,800 threads (with interleaved MT) on the XMT, exactly threads (with simultaneous MT) on the Niagara 2, and exactly threads (with simultaneous MT) on the Nehalem.
On the XMT, it can again be seen that DataflowRecursive scales nearly ideally on RMAT-ER and RMAT-G, and quite decently on RMAT-B, the most difficult input. Algorithm Iterative scales in an analogous fashion on the same platform. It can also be seen that Iterative scales well not only on the XMT, but also on the Niagara 2 and Nehalem platforms, in that relative ordering. The relative ordering is in part due to the difference in the amount of thread concurrency exploited, which is the highest on the XMT and the lowest on the Nehalem.
5.7 Iterative and degree of concurrency
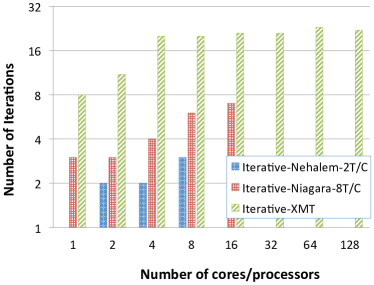
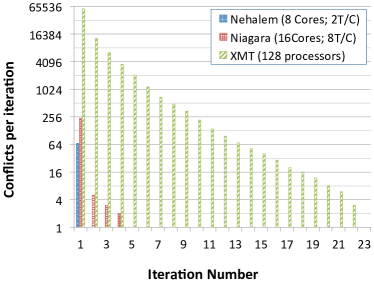
For Iterative, higher concurrency would also mean higher likelihood for the occurrence of conflicts and, as a result, increase in the number of iterations involved. Figure 10(a) shows the total number of conflicts generated during the course of algorithm Iterative on the three platforms for the most hostile of the three input types, the RMAT-B graph. As expected, the relative ordering in terms of number of conflicts is Nehalem followed by Niagara 2 followed by the XMT. The number of these conflicts is seen to be small relative to the number of vertices (16 million) in the graph. As Figure 10(b) shows, the total number of iterations the algorithm needed to resolve these conflicts is quite modest, even on the XMT, where the number of conflicts is relatively large. Figure 10(c) shows how the total number of conflicts is divided across the iterations when processors on the XMT, cores of the Niagara 2 (with threads per core) and cores of the Nehalem (with threads per core) are used. As this figure shows, about 90% of the conflicts occur in the first iteration and the number of conflicts drops drastically in subsequent iterations. This suggests that it might be worthwhile to switch to a sequential computation once a small enough number of conflicts is reached, rather than proceed iteratively in parallel. We will investigate this in future work.
5.8 Number of colors
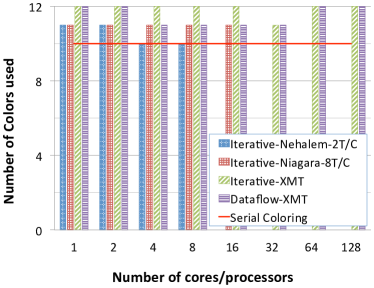
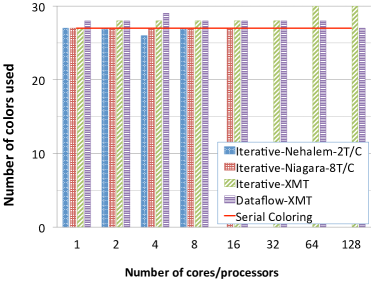
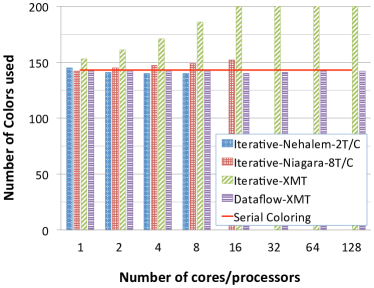
The serial greedy coloring algorithm used , , and colors on the three graphs RMAT-ER, RMAT-G, and RMAT-B listed in Table 2, respectively. These numbers are much smaller than the maximum degrees (42; 1,278; and 38,143) in these graphs, which are upper bounds on the number of colors the greedy algorithm uses. Clearly, the gap between the upper bounds and the actual number of colors used is very large, which suggests that the serial greedy algorithm is providing reasonably good quality solutions. Indeed experiments have shown that the greedy algorithm often uses near-optimal numbers of colors on many classes of graphs [10, 19].
Figure 11 summarizes the number of colors the multithreaded algorithms Iterative and DataflowRecursive use on the three test graphs as the number of cores/processors on the various platforms is varied. It can be seen that both algorithms use about the same number of colors as the serial greedy algorithm and the increase in number of colors with an increase in concurrency is none to modest—only for Iterative on the XMT (where concurrency is massive) and the graph RMAT-B do we see a modest increase in number of colors as the number of processors is increased.
6 Conclusion
We presented a heuristic multithreaded algorithm for graph coloring that is suitable for any shared-memory system, including multi-core platforms. The key ideas in the design of the algorithm are speculation and iteration. We also presented a massively multithreaded algorithm for coloring designed using dataflow principles exploiting the fine-grain, hardware-supported synchronization mechanisms available on the Cray XMT. Using a carefully chosen set of input graphs, covering a wide range of problem types, we evaluated the performance of the algorithms on three different platforms—Intel Nehalem, Sun Niagara 2, and Cray XMT—that feature varying degrees of multithreading and caching capabilities to tolerate latency. The iterative algorithm (across all three architectures) and the dataflow algorithm (on the Cray XMT) achieved near-linear speedup on two of the three input graph classes considered and moderate speedup on the third, most difficult, input type. These runtime performances were achieved without compromising the quality of the solution (i.e., the number of colors) produced by the underlying serial algorithm. We also characterized the input graphs and provided insight on bottlenecks for performance.
Backed by experimental results, some of the more general conclusions we draw about parallel graph algorithms include:
-
•
simultaneous multithreading provides an effective way to tolerate latency, as can be seen from the experiments on the Nehalem and Niagara 2 platforms where the runtime using threads on one core is found to be similar to the runtime using one thread on cores,
-
•
the impact of lower clock frequency and smaller cache memories can be ameliorated with a greater thread concurrency, as can be seen in the better performance obtained on the XMT and the Niagara 2 relative to the Nehalem,
-
•
when supported by light-weight synchronization mechanisms in hardware, parallelism should be exploited at fine grain, and
-
•
graph structure critically influences the performance of parallel graph algorithms.
We expect these insights to be helpful in the design of high performance algorithms for irregular problems on the impending many-core architectures.
Acknowledgments
We thank the anonymous referees and Fredrik Manne for their valuable comments on an earlier version of the manuscript. This research was supported by the U.S. Department of Energy through the CSCAPES Institute (grants DE-FC02-08ER25864 and DE-FC02-06ER2775), by the National Science Foundation through grants CCF-0830645, CNS-0643969, OCI-0904809, and OCI-0904802, and by the Center for Adaptive Supercomputing Software (CASS) at the Pacific Northwest National Laboratory. The Pacific Northwest National Laboratory is operated by Battelle for the U. S. Department of Energy under Contract DE-AC06-76L01830.
References
- [1] Patrick R. Amestoy, Timothy A. Davis, and Iain S. Duff. An approximate minimum degree ordering algorithm. SIAM Journal on Matrix Analysis and Applications, 17(4):886–905, 1996.
- [2] David Bader, John Feo, John Gilbert, Jeremy Kepner, David Keoster, E Loh, Kamesh Madduri, B Mann, and T Meuse. HPCS scalable synthetic compact applications 2. http://www.graphanalysis.org/benchmark/HPCS-SSCA2_Graph-Theory_v2.1.doc, 2007.
- [3] David A. Bader and Guojing Cong. Efficient graph algorithms for multicore and multiprocessors. In Sanguthekar Rajasekaran and John Reif, editors, Handbook of Parallel Computing, pages 1–44. Chapman and Hall/CRC Press, 2008. Chapter 26.
- [4] Kevin J. Barker, Kei Davis, Adolfy Hoisie, Darren J. Kerbyson, Mike Lang, Scott Pakin, and Jose Carlos Sancho. A performance evaluation of the Nehalem quad-core processor for scientific computing. Parallel Processing Letters, 18(4):453–469, 2008.
- [5] D. Bozdağ, Ü. V. Çatalyürek, A. H. Gebremedhin, F. Manne, E. G. Boman, and F. Özgünner. Distributed-memory parallel algorithms for distance-2 coloring and related problems in derivative computation. SIAM Journal on Scientific Computing, 32(4):2418–2446, 2010.
- [6] D. Bozdağ, A. H. Gebremedhin, F. Manne, E. G. Boman, and Ü. V. Çatalyürek. A framework for scalable greedy coloring on distributed-memory parallel computers. Journal of Parallel and Distributed Computing, 68(4):515–535, 2008.
- [7] D. Brélaz. New methods to color the vertices of a graph. Communications of the ACM, 22(4):251–256, 1979.
- [8] Deepayan Chakrabarti and Christos Faloutsos. Graph mining: Laws, generators, and algorithms. ACM Computing Surveys, 38(1):2, 2006.
- [9] Amin Coja-Oghlan, Michael Krivelevich, and Dan Vilenchik. Why almost all -colorable graphs are easy to color. Theory of Computing Systems, 46:523–565, 2010.
- [10] T. F. Coleman and J. J. Moré. Estimation of sparse Jacobian matrices and graph coloring problems. SIAM Journal on Numerical Analysis, 20(1):187–209, 1983.
- [11] T. F. Coleman and J. J. Moré. Estimation of sparse Hessian matrices and graph coloring problems. Mathematical Programming, 28:243–270, 1984.
- [12] COLOR02/03/04: Graph coloring and its generalizations. URL:http://mat.gsia.cmu.edu/COLOR03/.
- [13] Z. DeVito, N. Joubert, F. Palacios, S. Oakley, M. Medina, M. Barrientos, E. Elsen, F. Ham, A. Aiken, K. Duraisamy, E. Darve, J. Alonso, and P. Hanrahan. Liszt: A domain specific language for building portable mesh-based PDE solvers. Supercomputing 2011.
- [14] DIMACS implementation challenges. URL:http://dimacs.rutgers.edu/Challenges/.
- [15] John Feo, David Harper, Simon Kahan, and Petr Konecny. Eldorado. In Proceedings of the 2nd Conference on Computing Frontiers, pages 28–34, New York, NY, USA, 2005. ACM.
- [16] I. Finocchi, A. Panconesi, and R. Silvestri. Experimental analysis of simple, distributed vertex coloring algorithms. Algorithmica, 41(1):1–23, 2004.
- [17] A. H. Gebremedhin and F. Manne. Scalable parallel graph coloring algorithms. Concurrency: Practice and Experience, 12:1131–1146, 2000.
- [18] A. H. Gebremedhin, F. Manne, and A. Pothen. What color is your Jacobian? Graph coloring for computing derivatives. SIAM Review, 47(4):629–705, 2005.
- [19] A. H. Gebremedhin, D. Nguyen, M. M. A Patwary, and A. Pothen. ColPack: Software for graph coloring and related problems in scientific computing. Submitted, 2012.
- [20] A. H. Gebremedhin, A. Pothen, A. Tarafdar, and A. Walther. Efficient computation of sparse Hessians using coloring and automatic differentiation. INFORMS Journal on Computing, 21(2):209–223, 2009.
- [21] A. H. Gebremedhin, A. Tarafdar, F. Manne, and A. Pothen. New acyclic and star coloring algorithms with application to computing Hessians. SIAM Journal on Scientific Computing, 29:1042–1072, 2007.
- [22] D. Hysom and A. Pothen. A scalable parallel algorithm for incomplete factor preconditioning. SIAM Journal on Scientific Computing, 22:2194–2215, 2001.
- [23] M. T. Jones and P. Plassmann. A parallel graph coloring heuristic. SIAM Journal on Scientific Computing, 14(3):654–669, 1993.
- [24] M.T. Jones and P.E. Plassmann. Scalable iterative solution of sparse linear systems. Parallel Computing, 20(5):753–773, 1994.
- [25] Jakub Kurzak, David A. Bader, and Jack Dongarra, editors. Scientific Computing with Multicore and Accelerators. Computational Science Series. Chapman and Hall/CRC Press, 2011.
- [26] M. Luby. A simple parallel algorithm for the maximal independent set problem. SIAM Journal on Computing, 15(4):1036–1053, 1986.
- [27] Andrew Lumsdaine, Douglas Gregor, Bruce Hendrickson, and Jonathan W. Berry. Challenges in parallel graph processing. Parallel Processing Letters, 17(1):5–20, 2007.
- [28] Kamesh Madduri, David A. Bader, Jonathan W. Berry, Jospeh R. Crobak, and Bruce Hendrickson. Multithreaded algorithms for processing massive graphs. In David A. Bader, editor, Petascale Computing: Algorithms and Applications, pages 237–258. Chapman and Hall/CRC Press, 2008.
- [29] Daniel Molka, Daniel Hackenberg, Robert Schone, and Matthias S. Muller. Memory performance and cache coherency effects on an Intel Nehalem multiprocessor system. In Proceedings of the 2009 18th International Conference on Parallel Architectures and Compilation Techniques, pages 261–270, Washington, DC, USA, 2009. IEEE Computer Society.
- [30] Jarek Nieplocha, Andrès Márquez, John Feo, Daniel Chavarría-Miranda, George Chin, Chad Scherrer, and Nathaniel Beagley. Evaluating the potential of multithreaded platforms for irregular scientific computations. In Proceedings of the 4th Conference on Computing Frontiers, pages 47–58, New York, NY, USA, 2007. ACM.
- [31] Y. Saad. ILUM: A multi-elimination ILU preconditioner for general sparse matrices. SIAM Journal on Scientific Computing, 17:830–847, 1996.
- [32] M. Shah, J. Barren, J. Brooks, R. Golla, G. Grohoski, N. Gura, R. Hetherington, P. Jordan, M. Luttrell, C. Olson, B. Sana, D. Sheahan, L. Spracklen, and A. Wynn. UltraSPARC T2: A highly-threaded, power-efficient, SPARC SOC. In Solid-State Circuits Conference, 2007. ASSCC ’07. IEEE Asian, pages 22 –25, 12-14 2007.
- [33] Jonathan S. Turner. Almost all -colorable graphs are easy to color. Journal of Algorithms, 9(1):63–82, 1988.
- [34] D. J. Watts and S. H. Strogatz. Collective dynamics of “small-world” networks. Nature, 393(6684):440–442, June 1998.
- [35] David Zuckerman. Linear degree extractors and the inapproximability of max clique and chromatic number. Theory of Computing, 3:103–128, 2007.