IDCS J1426.5+3508: Cosmological Implications of a Massive, Strong Lensing Cluster at
Abstract
The galaxy cluster IDCS J1426.5+3508 at is the most massive galaxy cluster yet discovered at and the first cluster at this epoch for which the Sunyaev-Zel’Dovich effect has been observed. In this paper we report on the discovery with HST imaging of a giant arc associated with this cluster. The curvature of the arc suggests that the lensing mass is nearly coincident with the brightest cluster galaxy, and the color is consistent with the arc being a star-forming galaxy. We compare the constraint on M200 based upon strong lensing with Sunyaev-Zel’Dovich results, finding that the two are consistent if the redshift of the arc is . Finally, we explore the cosmological implications of this system, considering the likelihood of the existence of a strongly lensing galaxy cluster at this epoch in a CDM universe. While the existence of the cluster itself can potentially be accomodated if one considers the entire volume covered at this redshift by all current high-redshift cluster surveys, the existence of this strongly lensed galaxy greatly exacerbates the long-standing giant arc problem. For standard CDM structure formation and observed background field galaxy counts this lens system should not exist. Specifically, there should be no giant arcs in the entire sky as bright in F814W as the observed arc for clusters at , and only as bright in F160W as the observed arc. If we relax the redshift constraint to consider all clusters at , the expected number of giant arcs rises to in F160W, but the number of giant arcs of this brightness in F814W remains zero. These arc statistic results are independent of the mass of IDCS J1426.5+3508. We consider possible explanations for this discrepancy.
Subject headings:
galaxies: clusters: IDCS J1426.5+3508 – gravitational lensing: strong – cosmology: observations, cosmological parameters1. Introduction
Galaxy clusters have historically played a central role in cosmology, with the most massive and distant systems providing the most profound insights. For example, observations of the Coma cluster provided the first evidence for dark matter (Zwicky, 1933), while the existence of exceptionally massive clusters at early times was an important argument for (e.g., Carlberg et al., 1996; Donahue et al., 1998, and references therein). In recent years much attention has been given to the question of whether the most distant, highest mass clusters are consistent with a standard Gaussian CDM cosmology, or whether one must invoke non-Gaussianity of the initial density fluctuations from inflation that seed structure formation. While these analyses have yielded divergent results (Hoyle et al., 2011; Enqvist et al., 2011; Cayón et al., 2011; Williamson et al., 2011), it is clear that the most massive, distant clusters remain valuable cosmological probes.
The galaxy cluster that is the focus of this paper was detected as part of the IRAC Distant Cluster Survey (IDCS), an ongoing 8.82 deg2 survey within the Spitzer Deep, Wide-Field Survey (SDWFS Ashby et al., 2009) region that employs full photometric redshift probability distributions for a 4.5m-selected galaxy catalog to identify galaxy clusters at . This program extends the IRAC Shallow Cluster Survey (ISCS; Eisenhardt et al. 2008), which has yielded the largest sample of spectroscopically confirmed clusters at by pushing both to lower mass and higher redshift. The cluster IDCS J1426.5+3508 was identified as a strong candidate for a high mass, cluster in this program and targeted for detailed follow-up. Spectroscopic observations with the HST WFC3 grism and LRIS on Keck, described in detail in Stanford et al. (2012), confirm that this cluster lies at .
While the existence of a cluster at this redshift is not surprising, multiple lines of evidence now suggest that this is a truly massive cluster. Stanford et al. (2012) report a Chandra X-ray mass estimate of M200 M⊙, while Sunyaev-Zel’Dovich imaging from Brodwin et al. (2012) implies that the mass contained within a region overdense by a factor of 500 relative to critical density is M500 M⊙, (M200 M⊙ for a typical halo concentration). For comparison, this Sunyaev-Zel’Dovich mass is only % lower than that of XMMU J2235.3-2557 at (Mullis et al., 2005; Rosati et al., 2009), which is the only published cluster at more massive than IDCS J1426.5+3508. Meanwhile, the one spectroscopically confirmed galaxy cluster at higher redshift (, Gobat et al., 2011) has an estimated total mass of M⊙ – a factor of five to ten lower than IDCS J1426.5+3508.
In this paper we focus upon the discovery of a giant arc associated with this cluster and the implications of its existence in the context of CDM structure formation. The layout of this paper is as follows. In §2 and 3 we present the discovery and attempted spectroscopy of the giant arc. In §4 we derive strong lensing constraints on the cluster mass, and discuss the redshift regime over which these constraints are consistent with the SZ mass. We then extend our discussion in §5 to consider the probability for the discovery of a giant arc associated with this cluster. Finally, in §6 we summarize our results and consider potential theoretical modifications that may resolve the arc statistic discrepancy. Throughout this paper we use cosmological parameters consistent with the seven year WMAP results (, km s-1, ; Komatsu et al., 2011).
2. Detection of a Giant Arc
We obtained HST imaging with the Advanced Camera for Surveys (ACS; Ford et al., 2003) and Wide-Field Camera 3 (WFC3; Kimble et al., 2008) as part of Cycle 17 program 11663 (PI: Brodwin) between 08 July 2010 and 07 November 2010. The total exposure times in F814W and F160W were 4.5 ks and 2.6 ks, respectively. Further details are provided in Stanford et al. (2012). Subsequent grism observations in Cycle 18, coupled with Keck spectroscopy, confirm that the galaxy cluster is real and at (Stanford et al., 2012).
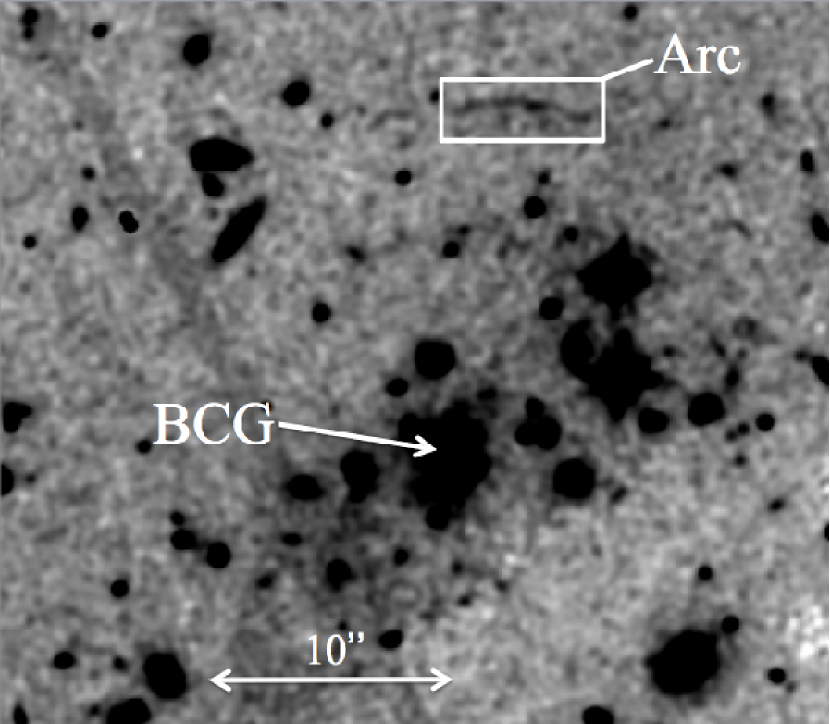
Within the HST/ACS and WFC3 imaging we identify a highly elongated object which we interpret as a strong arc lensed by the cluster. We present a composite F814W+F160W image of the cluster field in Fig. 1, highlighting this object. The length is 48 but the width is unresolved in the HST photometry, and hence it easily satisfies the standard length-to-width criteria for a giant arc (; Wu & Hammer, 1993). The curvature of the object is consistent with lensing by the cluster potential, and the color can be used to further constrain the nature of the object.
2.1. Arc Photometry
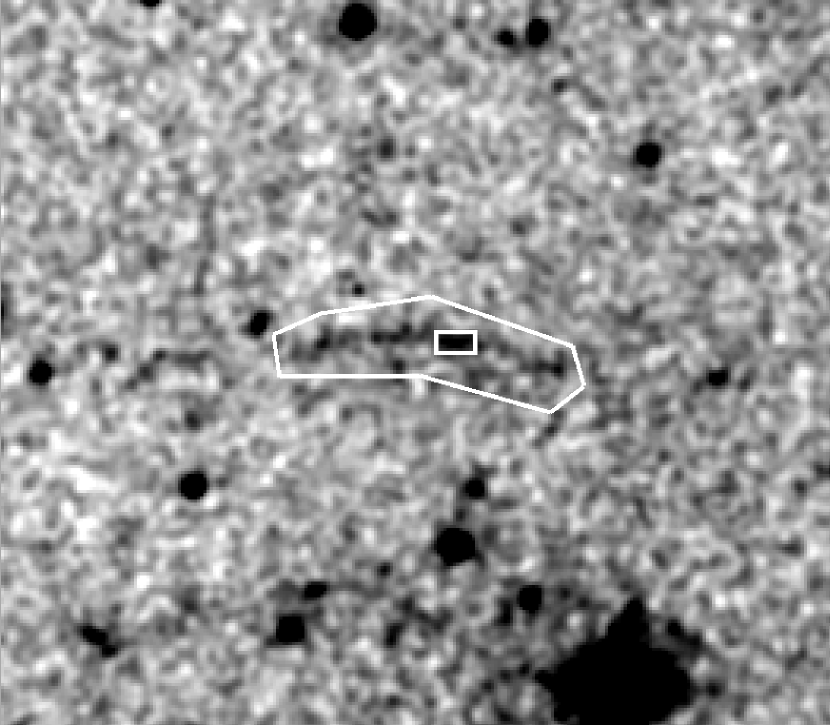
We extract the magnitude of the arc within a polygonal aperture constructed to enclose the full extent of the arc. The enclosed area within the aperture is 9.0 arcsec2, and the extent along the major axis is 67 (Fig. 1). As part of this procedure we first use Source Extractor (Bertin & Arnouts, 1996) to generate a background map. The flux and background are measured both within the source aperture and for an ensemble of blank-sky apertures surrounding the arc, from which we can calculate the aperture-to-aperture photometric variance. We measure F814W mag and F160W mag (AB). Given the large uncertainties in the total magnitude, the integrated color of the arc, F814WF160W mag, is only modestly constrained. To obtain an improved estimate of the color, we recompute the color within a smaller, rectangular aperture that includes the region with the highest signal-to-noise ratio (Fig. 1). Within this aperture we obtain a more precise, statistically consistent color, F814WF160W mag. As expected for an arc, we see no evidence for color changes along its length that might be indicative of a chance superposition of sources.
What does this color imply about the source galaxy? The fact that the source is not a drop-out in F814W constrains the redshift to be . The observed color is similar to that of band dropouts (Gonzalez et al., 2011). For a somewhat more complete picture of plausible redshifts, we consider the predicted colors from a suite of Bruzual & Charlot (2003) stellar population models. For a Chabrier (2003) mass function and solar metallicity, the observed color is inconsistent with passively evolving stellar populations at all redshifts. To be precise, single burst models in which star formation has ceased more than 100 Myrs earlier uniformly predict F814F160W colors that are significantly redder than observed regardless of the formation redshift. Conversely, models with an exponentially declining star-formation rate (models) can successfully reproduce the observed color at higher redshifts. These models place a lower bound on the redshift as a function of and the assumed formation redshift. For Gyr, consistency with the observed color requires (2.5) for (3). Smaller values of increase the minimum redshift.
2.2. Arc Geometry
The location of the arc is such that no nearby individual galaxies appear to be contributing significantly to the lensing, and the curvature is consistent with the centroid being nearly coincident with the brightest cluster galaxy (BCG). If we make the assumption that the lensing is indeed centered upon the BCG, then the radius of the arc is . There is however no guarantee that the BCG lies directly at the bottom of the potential in the absence of a detailed lensing model, so for the analysis below we assume an uncertainty of 30 kpc in the centroid, which corresponds to a 3 uncertainty in the radius of the arc. For local clusters from the LoCuSS program roughly 68% of clusters have offsets between the BCG and X-ray peak less than this value (Sanderson et al., 2009).
3. Gemini and HST Spectroscopy
We attempted to obtain a redshift for the giant arc using Gemini North. We targeted Ly emission during 6.5 hr of Director’s Discretionary Time, using GMOS for long slit spectroscopy. The data were acquired between 26 June 2011 and 06 July 2011 (UT) using the B600 grism, which is blazed at 4610 . We observed with a central wavelength of 5150 and two pixel binning in both the spatial and spectral directions using a 10 slit. The resultant spatial and spectral resolutions are 0146 pix-1 and 0.9 pix-1, respectively, and the slit was positioned to lie along the long axis of the arc at a position angle of 270.85 degrees. We obtained 13 1780 s exposures, dithered in both the spatial and the spectral dimensions, for a total on-source exposure time of 6.43 hr. The seeing during these observations ranged from 067 to 108, with a median seeing of 077 based on an early M-type star which was serendipitously observed in the majority of the observations. Conditions during the observations were mostly photometric, but included some data taken during 70th percentile (patchy cloud) conditions.
The redshift constraints arising from the cluster redshift (i.e., ) and the fact that the arc is detected in the F814W imaging (i.e., ) provide a first bound on the redshift. Within this range we focused upon and designed the observations to be sensitive to strong Ly emission (comparable to a Lyman Alpha Emitter), if present for . We reduced the data using standard long slit procedures within IRAF. Unfortunately, we detect neither any continuum nor any emission lines at 3590 6660 ( for Ly).
We also attempted to obtain a redshift for the arc using HST/WFC3 grism data from program 12203 (PI Stanford). The data and reduction procedure are both described in Stanford et al. (2012). Neither continuum nor emission lines for the arc were detected with either the G102 or G141 grisms, which together cover the wavelength range m m. Using simulations run with the aXeSIM software, we calculate that the corresponding emission line detection threshold corresponds to erg s-1 cm-2 at 0.95m and erg s-1 cm-2 at 1.35m (5 ).111http://axe.stsci.edu/axesim/ Given the non-detection of Ly with either GMOS or HST/WFC3 spectroscopy, HST narrow- or medium-band imaging may be the most promising avenue for refining the redshift estimate for this arc.
4. Cluster Mass from Strong Lensing
4.1. Enclosed Mass within the Arc
Under the assumption of circular symmetry for the cluster lens, we calculate the total mass enclosed by the giant arc as a function of the source redshift. In this case the arc radius ( kpc at ) identifies the radius of the tangential critical curve, which can be easily related to the enclosed mass through the relation,
| (1) |
where is the lensing surface critical density, which reads
| (2) |
In this equation , , and are the angular diameter distances to the lens, to the source, and from the lens to the source, respectively.222We refer the reader to Meylan et al. (2006) for a detailed review of gravitational lensing.
We emphasize that this enclosed mass is independent of the specific density profile assumed for the lens. One important caveat in this estimate, however, is that the assumption of circular symmetry is known to yield an overestimate of the enclosed mass for more realistic systems with intrinsic ellipticity. To approximately account for this effect, we assume that the circular model results in a factor of overestimate of the mass, consistent with Bartelmann (1995), and quote values below that include this correction.
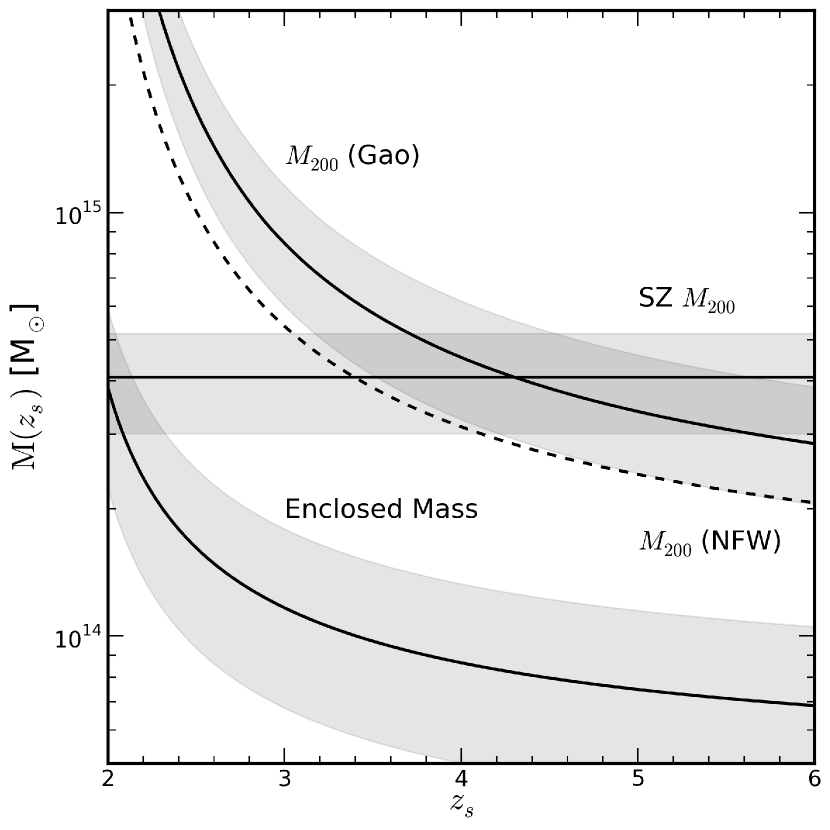
In Figure 2 we show the resulting enclosed mass as a function of the source redshift. The closer the source is to the deflector, the larger the enclosed mass needs to be due to the geometric suppression of the lensing efficiency. The uncertainty in the enclosed mass shown in the Figure corresponds to the uncertainty in the arc radius, for which we adopt the nominal value of kpc (see §2). The value for the enclosed mass reaches a lower limit of M M⊙ for . The enclosed mass in this central 125 kpc region, which contains minimal assumptions, already is comparable to the total mass inferred for the only spectroscopically confirmed cluster at higher redshift (Gobat et al., 2011).
4.2. M200
The next step is to estimate the total mass within for the cluster. This problem is underconstrained, necessitating several simplifying assumptions. We initially assume that the density profile of the cluster is well represented by a spherical NFW model (Navarro et al., 1996, 1997). For a given virial mass, we compute the concentration of the dark matter halo according to the prescription of Gao et al. (2008), which is in turn a modified version of the original NFW prescription. The Gao et al. (2008) formula has been extensively tested against numerical simulations, including the high redshift regime relevant to the current analysis, and is expected to provide improvement over the prescriptions of Eke et al. (2001) and Bullock et al. (2001).
To account for asymmetries in the cluster mass distribution, we next assign a non-vanishing ellipticity to the lensing potential, according to the procedure summarized in Meneghetti et al. (2003). Finally, we assume that the arc is produced by a source lying near one of the caustic cusps situated along the major axis of the lens, so that the arc radius corresponds to the maximum elongation of the critical curve. Thus, we vary M200 until we find a match between this maximum elongation and .
In Figure 2 we show the resulting M200 as a function of the source redshift. We assume an ellipticity, , consistent with the mean of the ellipticity distribution presented in Figure 7 of Fedeli & Berciano Alba (2009), and use the standard deviation of this distribution to define the uncertainty shown by the shaded region. A caveat to this assumption is that this ellipticity distribution is derived at low redshift. Lee et al. (2005) however demonstrated that evolution of the ellipticity distribution is expected to be negligible for , and sufficiently small at as to not impact our calculations. From this analysis the derived value for M200 approaches a lower limit of M200 M⊙ as , where the quoted uncertainty reflects the uncertainty in the ellipticity. For reference, we also show the results obtained with the same fiducial ellipticity , but assuming the original NFW prescription for the concentration (dashed curve). Since at high redshift the NFW concentration is always higher than other prescriptions, the required M200 of the cluster is 35% smaller. Conversely, use of either the Bullock et al. (2001) or Eke et al. (2001) prescriptions would lead to a larger value of M200.
It should be noted that strong cluster lenses are usually a biased subsample of the whole cluster population, in the sense that they tend to be intrinsically more concentrated, and to be prolated with the major axis aligned along the line of sight (Hennawi et al., 2007; Meneghetti et al., 2010). This bias is expected to be even more severe in redshift and/or mass ranges where strong lensing is particularly rare, such as the case under consideration. It has also recently been observed that there may be a stronger than expected correlation between concentration and cluster mass, with lower mass systems having higher than expected concentrations (e.g., Schmidt & Allen, 2007; Ettori et al., 2010; Oguri et al., 2012). Therefore, a concentration higher than that provided by the Gao et al. (2008) prescription, which is a mean over the entire cluster population, might actually be more realistic in this circumstance. As an example, for a sample of lensing clusters at Oguri et al. (2009) found concentrations a factor of higher than would be predicted by the Gao et al. (2008) distribution. Simulations by Meneghetti et al. (2010) also indicate that projection effects may yield observed concentrations that are enhanced by up to a factor of two. In the current case, if we assume that the concentration is a factor of two above the Gao et al. (2008) prescription, then the derived M200 would decrease by roughly a factor of 2.2.
In Figure 2 and Table 1 we also present the masses and associated uncertainties derived from the Sunyaev-Zel’Dovich analysis (Brodwin et al., 2012). The two approaches appear to yield consistent estimates for M200 if the source redshift lies at , or more conservatively if one includes the potential for reducing the lensing mass by up to a factor of 2 if the halo concentration is larger than for a typical cluster. Coupled with the color of the arc, these factors together argue that the most plausible redshift is .
5. Cosmological Implications
The redshift of this cluster makes it a unique and interesting test for cosmological structure formation. To be specific, the most distant clusters known to host giant arcs prior to this study lie at (e.g., Gladders et al., 2003; Huang et al., 2009). IDCS J1426.5+3508 significantly extends the redshift baseline over which arcs are known to exist. In this section we consider the probability for this massive, strong lensing cluster to exist and be detected in our survey. Specifically, given a standard CDM cosmology with the seven year WMAP cosmological parameters, what is the probability of detecting a giant arc of this brightness behind a cluster at ?
In order to estimate how rare the observed gravitational arc is, we evaluate the number of arcs in the whole sky that are expected to be produced by galaxy clusters at redshift larger than . We first estimate, for a fixed source redshift , the contribution to the optical depth by structures in the desired redshift range,
| (3) |
In the previous equation is the mass function of cosmic structures, represents the comoving volume of space per unit redshift, and stands for the cross section of individual clusters for images having the morphological property . In what follows we assume that is a length-to-width ratio , as customary in arc statistics studies, and employ the Tinker et al. (2008) mass function.
The total number of arcs with the property that are observed in the sky with a magnitude brighter than then simply reads
| (4) |
where is the source redshift distribution, while represents the observed number density of sources with magnitude lower than , i.e., the cumulative number counts. We adopt the redshift distribution and number counts for sources in the Hubble UDF provided by Coe et al. (2006) for F775W and F160W, and correct the number counts for the lensing magnification bias using the same procedure detailed in Fedeli et al. (2008) and Fedeli & Berciano Alba (2009).
For the practical computation of the optical depth, we use the strategy detailed in Fedeli et al. (2008) and references therein. Briefly, merger trees are constructed based on the extended Press & Schechter (1974) theory, which represent a model of the cluster population. A lensing potential ellipticity is assigned to each cluster, extracted from the distribution shown in Fedeli & Berciano Alba (2009), and cluster dynamical activity occurring at the knots of the merger trees is suitably modeled. Individual clusters are modeled as NFW profiles with the assigned potential ellipticity, and the concentration is linked to the mass through the Gao et al. (2008) prescription for the concentration, consistent with §4.2. We include a lognormal scatter in the concentration with , as in Fedeli et al. (2007). Finally, the cluster cross sections for giant arcs are computed using the fast and semi-analytic prescription of Fedeli et al. (2006), and the optical depth integrals are approximated by using a Monte-Carlo scheme.
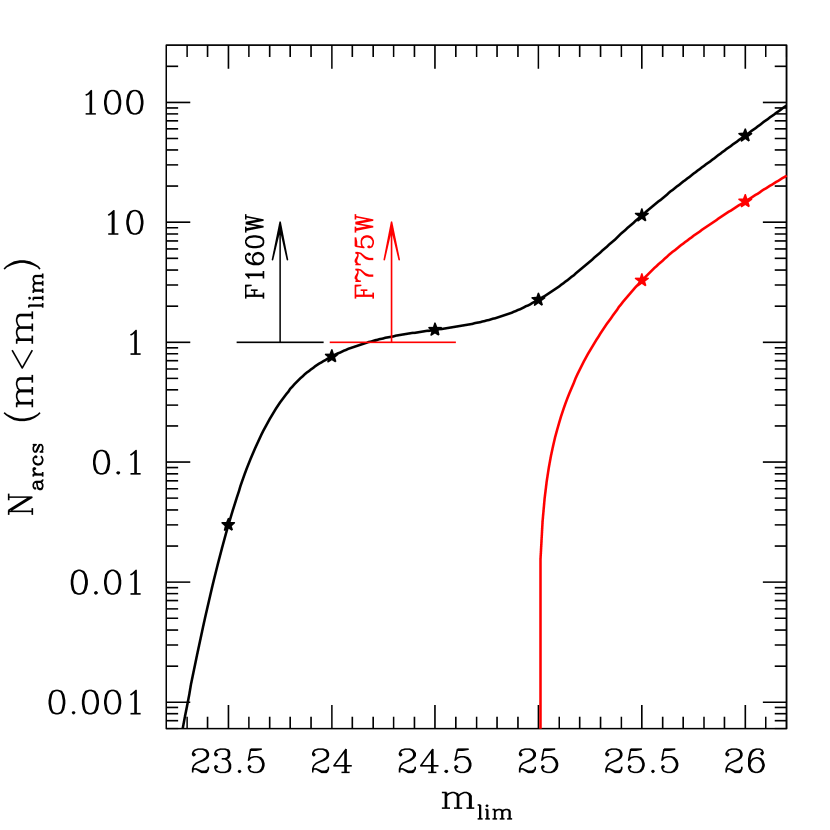
Figure 3 shows the resulting number of arcs expected across the full sky as a function of magnitude in F775W and F160W. For our observed arc we assume a color correction F775WF814W (AB), consistent with the expected color of a star-forming galaxy at this epoch. For the observed magnitudes we expect to find no arcs over the entire sky as bright in F814W as the one we observe and only as bright in F160W. Indeed, none are expected within 0.5 magnitudes of the brightness of the arc in F814W. Given that the area of our survey is only 8.82 deg2 ( of the full sky), the detection of an arc is highly implausible. For reference, we test the sensitivity of this result to the redshift of the lensing cluster. Even if one were to consider the entire cluster population at rather than setting the observed cluster redshift as the minimum permitted redshift, then the expected number of arcs detected remains zero in F814W and all-sky in F160W. The latter still leaves only a probability of that we would have detected such an arc in this survey. Note that the specific mass of IDCS J1426.5+3508 does not enter into our calculations – we posed the question of how many arcs should be produced by all clusters.
At lower redshifts the excess of giant arcs behind clusters relative to predictions has been realized for well over a decade (e.g., Bartelmann et al., 1998) and is known as the arc statistics problem. While significant effort has been devoted to reconcile the observations with improved models that incorporate more detailed physics and improved constraints on the source redshift distribution (e.g., Bartelmann et al., 2003; Wambsganss et al., 2004; Dalal et al., 2004; Li et al., 2006; Fedeli et al., 2008; Wambsganss et al., 2008; D’Aloisio & Natarajan, 2011), the issue is not wholly resolved (e.g., Meneghetti et al., 2011). The current cluster greatly exacerbates the situation – this arc simply should not exist.
It is interesting to break down the above calculation of the number of arcs (Equation 4) to ascertain the dominant factor that drives the expected number of arcs to zero. The two fundamental physical quantities that determine the total number of arcs are the total lensing optical depth of all clusters and the number density of background sources to be lensed.
The lensing optical depth depends upon the products of the cluster mass function and the lensing efficiency of individual clusters, which is a strong function of cluster mass. An obvious explanation would be if IDCS J1426.5+3508 exceeds the mass of clusters expected to exist in a CDM universe at this redshift. If lensing requires reaching a critical mass threshold that is exceeded in reality but not in our model, then the observed number of arcs would clearly exceed expectations. In that case, a plausible solution would be to invoke non-Gaussianity to enhance the number of extremely massive clusters. It is however argued in Brodwin et al. (2012) that IDCS J1426.5+3508 is consistent with CDM, indicating that invoking non-Gaussianity is not necessarily the appropriate solution.
A more subtle solution would be if the lensing cross-sections of individual clusters systematically exceed the calculated theoretical cross-sections. There is evidence that this lensing efficiency is indeed systematically underestimated. Several papers have argued that including the impact of baryonic contraction can raise the lensing cross-section by between 25% and a factor of two (Li et al., 2006; Wambsganss et al., 2008). Meneghetti et al. (2011) also find that simulated clusters produce % fewer arcs than X-ray clusters at . While these corrections work in the proper direction, it appears that even if one imposes reasonable physical tweaks to account for the impact of baryonic infall on the density profile, the change remains insufficient to account for the arc in IDCS J1426.5+3508. Moreover, as demonstrated by Mead et al. (2010), inclusion of AGN feedback acts to counteract the impact of baryonic infall, resulting in a smaller enhancement to the cross-section. Even ignoring the mitigating effect of feedback, the discrepancy is simply too large. Specifically, doubling the predicted number of arcs would imply arc all-sky with the observed F160W magnitude, and would still imply none with the observed F775W magnitude.
Another means of boosting the effective cross-section for an individual system is via the presence of additional structures along the line of sight. Puchwein & Hilbert (2009) used the Millenium simulations to quantify the impact of such secondary structures. These authors found that the typical impact is to enhance the cross section by %, with enhancements of 50% not uncommon for individual systems. Again, this factor alone is insufficient to explain the discrepancy.
The final factor that can drive the prediction of zero arcs is underestimation of the surface density of galaxies sufficiently bright to yield a source similar to the observed arc after magnification by the cluster potential. One concern here is that we have used results from the UDF to inform our redshift distribution for background sources, yet this region is sufficiently small that cosmic variance is a concern. As an alternate test, we also try an analytic prescription for the background number counts based upon the luminosity function of Reddy et al. (2008) to model the background distribution. We find however that this approach does not qualitatively alter the results of our analysis. It therefore seems unlikely that error in the source distribution is the origin of the discrepancy.
We therefore identify no obvious physical solution to explain the existence of this arc, though exceptionally high concentrations seems like the most promising avenue to explore. Finally, a last possible solution would be if the observed source is not a background arc. Given the combination of color, curvature, , and lack of color variation, this possibility also seems unlikely.
| Method | Radius | Mass ( M⊙) |
|---|---|---|
| Lensing | 125 kpc | |
| Lensing | ||
| SZ | ||
| SZ |
Note. — The lensing limiting masses correspond to the maximum possible source redshift, . Both M200 masses presume a concentration consistent with the Gao et al. (2008) relation. If the projected concentration is a factor of two higher then the lensing and SZ masses drop by factors of 2.1 and 1.2, respectively. As noted in the text, and are defined relative to critical density.
6. Conclusions
We have presented evidence for the existence of a giant arc behind the massive galaxy cluster IDCS J1426.5+3508 at . This unique system constitutes the highest redshift cluster known to host a giant arc. From the strong lensing we derive an enclosed lensing mass within the central 125 kpc of M⊙, which is comparable to (or exceeds) the total masses of most other known clusters at , confirming that IDCS J1426.5+3508 is an exceptionally massive cluster at this epoch. Having derived the enclosed mass, we next provide a comparison with the Sunyaev-Zel’Dovich-derived value of M200 from Brodwin et al. (2012). We find that the two are consistent if the arc lies at , and derive a lower bound on the mass of M⊙.
Finally, we investigate the cosmological implications of this system. The greatest challenge posed by this cluster is explaining the existence of the giant arc at all. In §5 we demonstrate that under realistic assumptions for the lensing cross-section, cluster mass function, and background galaxy distribution, the total number of giant arcs behind clusters at that are at least as bright as the observed arc is zero in F814W and in F160W. Very simply, the arc we have discovered behind IDCS J1426.5+3508 is not predicted to exist. If one considers an ensemble of lensing clusters extending to somewhat lower redshift, , the tension with theoretical expectations decreases slightly for F160W, but in F814W the number of predicted arcs remains zero. We briefly discuss possible explanations for this discrepancy, but find no obvious solution. A tendency of higher concentrations in observed clusters than simulated systems has the greatest potential to decrease the disparity, but is unlikely to be sufficient to reconcile theoretical models for arc statistics with the existence of a lensing cluster at .
Looking towards the future, a statistical sample of the most massive clusters in the Universe at will provide the means with which to ascertain the true frequency of arcs behind high-redshift clusters. Much as the frequency of strong lensing clusters at was a surprise a decade ago, it appears that this higher redshift regime is poised to yield further unexpected discoveries.
References
- Ashby et al. (2009) Ashby, M. L. N., Stern, D., Brodwin, M., Griffith, R., Eisenhardt, P., Kozłowski, S., Kochanek, C. S., Bock, J. J., Borys, C., Brand, K., Brown, M. J. I., Cool, R., Cooray, A., Croft, S., Dey, A., Eisenstein, D., Gonzalez, A. H., Gorjian, V., Grogin, N. A., Ivison, R. J., Jacob, J., Jannuzi, B. T., Mainzer, A., Moustakas, L. A., Röttgering, H. J. A., Seymour, N., Smith, H. A., Stanford, S. A., Stauffer, J. R., Sullivan, I., van Breugel, W., Willner, S. P., & Wright, E. L. 2009, ApJ, 701, 428
- Bartelmann (1995) Bartelmann, M. 1995, A&A, 299, 11
- Bartelmann et al. (1998) Bartelmann, M., Huss, A., Colberg, J. M., Jenkins, A., & Pearce, F. R. 1998, A&A, 330, 1
- Bartelmann et al. (2003) Bartelmann, M., Meneghetti, M., Perrotta, F., Baccigalupi, C., & Moscardini, L. 2003, A&A, 409, 449
- Bertin & Arnouts (1996) Bertin, E. & Arnouts, S. 1996, A&AS, 117, 393
- Brodwin et al. (2012) Brodwin, M., Gonzalez, A. H., Stanford, S. A., Stern, D., Dey, A., Zeimann, G., Eisenhardt, P. R., Mancone, C., Plagge, T., & Carlstrom, J. 2012, ApJ
- Bruzual & Charlot (2003) Bruzual, G. & Charlot, S. 2003, MNRAS, 344, 1000
- Bullock et al. (2001) Bullock, J. S., Kolatt, T. S., Sigad, Y., Somerville, R. S., Kravtsov, A. V., Klypin, A. A., Primack, J. R., & Dekel, A. 2001, MNRAS, 321, 559
- Carlberg et al. (1996) Carlberg, R. G., Yee, H. K. C., Ellingson, E., Abraham, R., Gravel, P., Morris, S., & Pritchet, C. J. 1996, ApJ, 462, 32
- Cayón et al. (2011) Cayón, L., Gordon, C., & Silk, J. 2011, MNRAS, 415, 849
- Chabrier (2003) Chabrier, G. 2003, PASP, 115, 763
- Coe et al. (2006) Coe, D., Benítez, N., Sánchez, S. F., Jee, M., Bouwens, R., & Ford, H. 2006, AJ, 132, 926
- Dalal et al. (2004) Dalal, N., Holder, G., & Hennawi, J. F. 2004, ApJ, 609, 50
- D’Aloisio & Natarajan (2011) D’Aloisio, A. & Natarajan, P. 2011, MNRAS, 415, 1913
- Donahue et al. (1998) Donahue, M., Voit, G. M., Gioia, I., Lupino, G., Hughes, J. P., & Stocke, J. T. 1998, ApJ, 502, 550
- Eke et al. (2001) Eke, V. R., Navarro, J. F., & Steinmetz, M. 2001, ApJ, 554, 114
- Enqvist et al. (2011) Enqvist, K., Hotchkiss, S., & Taanila, O. 2011, JCAP, 4, 17
- Ettori et al. (2010) Ettori, S., Gastaldello, F., Leccardi, A., Molendi, S., Rossetti, M., Buote, D., & Meneghetti, M. 2010, A&A, 524, A68
- Fedeli et al. (2007) Fedeli, C., Bartelmann, M., Meneghetti, M., & Moscardini, L. 2007, A&A, 473, 715
- Fedeli et al. (2008) —. 2008, A&A, 486, 35
- Fedeli & Berciano Alba (2009) Fedeli, C. & Berciano Alba, A. 2009, A&A, 508, 141
- Fedeli et al. (2006) Fedeli, C., Meneghetti, M., Bartelmann, M., Dolag, K., & Moscardini, L. 2006, A&A, 447, 419
- Ford et al. (2003) Ford, H. C., Clampin, M., Hartig, G. F., Illingworth, G. D., Sirianni, M., Martel, A. R., Meurer, G. R., McCann, W. J., Sullivan, P. C., Bartko, F., Benitez, N., Blakeslee, J., Bouwens, R., Broadhurst, T., Brown, R. A., Burrows, C. J., Campbell, D., Cheng, E. S., Feldman, P. D., Franx, M., Golimowski, D. A., Gronwall, C., Kimble, R. A., Krist, J. E., Lesser, M. P., Magee, D., Miley, G., Postman, M., Rafal, M. D., Rosati, P., Sparks, W. B., Tran, H. D., Tsvetanov, Z. I., Volmer, P., White, R. L., & Woodruff, R. A. 2003, in Presented at the Society of Photo-Optical Instrumentation Engineers (SPIE) Conference, Vol. 4854, Future EUV/UV and Visible Space Astrophysics Missions and Instrumentation. Edited by J. Chris Blades, Oswald H. W. Siegmund. Proceedings of the SPIE, Volume 4854, pp. 81-94 (2003)., ed. J. C. Blades & O. H. W. Siegmund, 81–94
- Gao et al. (2008) Gao, L., Navarro, J. F., Cole, S., Frenk, C. S., White, S. D. M., Springel, V., Jenkins, A., & Neto, A. F. 2008, MNRAS, 387, 536
- Gladders et al. (2003) Gladders, M. D., Hoekstra, H., Yee, H. K. C., Hall, P. B., & Barrientos, L. F. 2003, ApJ, 593, 48
- Gobat et al. (2011) Gobat, R., Daddi, E., Onodera, M., Finoguenov, A., Renzini, A., Arimoto, N., Bouwens, R., Brusa, M., Chary, R.-R., Cimatti, A., Dickinson, M., Kong, X., & Mignoli, M. 2011, A&A, 526, A133+
- Gonzalez et al. (2011) Gonzalez, V., Bouwens, R., Labbe, I., Illingworth, G., Oesch, P., Franx, M., & Magee, D. 2011, ArXiv e-prints
- Hennawi et al. (2007) Hennawi, J. F., Dalal, N., Bode, P., & Ostriker, J. P. 2007, ApJ, 654, 714
- Hoyle et al. (2011) Hoyle, B., Jimenez, R., & Verde, L. 2011, Phys. Rev. D, 83, 103502
- Huang et al. (2009) Huang, X., Morokuma, T., Fakhouri, H. K., Aldering, G., Amanullah, R., Barbary, K., Brodwin, M., Connolly, N. V., Dawson, K. S., Doi, M., Faccioli, L., Fadeyev, V., Fruchter, A. S., Goldhaber, G., Gladders, M. D., Hennawi, J. F., Ihara, Y., Jee, M. J., Kowalski, M., Konishi, K., Lidman, C., Meyers, J., Moustakas, L. A., Perlmutter, S., Rubin, D., Schlegel, D. J., Spadafora, A. L., Suzuki, N., Takanashi, N., & Yasuda, N. 2009, ApJ, 707, L12
- Kimble et al. (2008) Kimble, R. A., MacKenty, J. W., O’Connell, R. W., & Townsend, J. A. 2008, in Presented at the Society of Photo-Optical Instrumentation Engineers (SPIE) Conference, Vol. 7010, Society of Photo-Optical Instrumentation Engineers (SPIE) Conference Series
- Komatsu et al. (2011) Komatsu, E., Smith, K. M., Dunkley, J., Bennett, C. L., Gold, B., Hinshaw, G., Jarosik, N., Larson, D., Nolta, M. R., Page, L., Spergel, D. N., Halpern, M., Hill, R. S., Kogut, A., Limon, M., Meyer, S. S., Odegard, N., Tucker, G. S., Weiland, J. L., Wollack, E., & Wright, E. L. 2011, ApJS, 192, 18
- Lee et al. (2005) Lee, J., Jing, Y. P., & Suto, Y. 2005, ApJ, 632, 706
- Li et al. (2006) Li, G. L., Mao, S., Jing, Y. P., Mo, H. J., Gao, L., & Lin, W. P. 2006, MNRAS, 372, L73
- Mead et al. (2010) Mead, J. M. G., King, L. J., Sijacki, D., Leonard, A., Puchwein, E., & McCarthy, I. G. 2010, MNRAS, 406, 434
- Meneghetti et al. (2003) Meneghetti, M., Bartelmann, M., & Moscardini, L. 2003, MNRAS, 340, 105
- Meneghetti et al. (2010) Meneghetti, M., Fedeli, C., Pace, F., Gottlöber, S., & Yepes, G. 2010, A&A, 519, A90+
- Meneghetti et al. (2011) Meneghetti, M., Fedeli, C., Zitrin, A., Bartelmann, M., Broadhurst, T., Gottlöber, S., Moscardini, L., & Yepes, G. 2011, A&A, 530, A17
- Meylan et al. (2006) Meylan, G., Jetzer, P., North, P., Schneider, P., Kochanek, C. S., & Wambsganss, J., eds. 2006, Gravitational Lensing: Strong, Weak and Micro, ed. G. Meylan, P. Jetzer, P. North, P. Schneider, C. S. Kochanek, & J. Wambsganss
- Mullis et al. (2005) Mullis, C. R., Rosati, P., Lamer, G., Böhringer, H., Schwope, A., Schuecker, P., & Fassbender, R. 2005, ApJ, 623, L85
- Navarro et al. (1996) Navarro, J. F., Frenk, C. S., & White, S. D. M. 1996, ApJ, 462, 563
- Navarro et al. (1997) —. 1997, ApJ, 490, 493
- Oguri et al. (2012) Oguri, M., Bayliss, M. B., Dahle, H., Sharon, K., Gladders, M. D., Natarajan, P., Hennawi, J. F., & Koester, B. P. 2012, MNRAS, 2189
- Oguri et al. (2009) Oguri, M., Hennawi, J. F., Gladders, M. D., Dahle, H., Natarajan, P., Dalal, N., Koester, B. P., Sharon, K., & Bayliss, M. 2009, ApJ, 699, 1038
- Press & Schechter (1974) Press, W. H. & Schechter, P. 1974, ApJ, 187, 425
- Puchwein & Hilbert (2009) Puchwein, E. & Hilbert, S. 2009, MNRAS, 398, 1298
- Reddy et al. (2008) Reddy, N. A., Steidel, C. C., Pettini, M., Adelberger, K. L., Shapley, A. E., Erb, D. K., & Dickinson, M. 2008, ApJS, 175, 48
- Rosati et al. (2009) Rosati, P., Tozzi, P., Gobat, R., Santos, J. S., Nonino, M., Demarco, R., Lidman, C., Mullis, C. R., Strazzullo, V., Böhringer, H., Fassbender, R., Dawson, K., Tanaka, M., Jee, J., Ford, H., Lamer, G., & Schwope, A. 2009, A&A, 508, 583
- Sanderson et al. (2009) Sanderson, A. J. R., Edge, A. C., & Smith, G. P. 2009, MNRAS, 398, 1698
- Schmidt & Allen (2007) Schmidt, R. W. & Allen, S. W. 2007, MNRAS, 379, 209
- Stanford et al. (2012) Stanford, S. A., Brodwin, M., Gonzalez, A. H., Stern, D., Dey, A., Zeimann, G., Eisenhardt, P. R., & Mancone, C. 2012, ApJ, 000, 000
- Tinker et al. (2008) Tinker, J., Kravtsov, A. V., Klypin, A., Abazajian, K., Warren, M., Yepes, G., Gottlöber, S., & Holz, D. E. 2008, ApJ, 688, 709
- Wambsganss et al. (2004) Wambsganss, J., Bode, P., & Ostriker, J. P. 2004, ApJ, 606, L93
- Wambsganss et al. (2008) Wambsganss, J., Ostriker, J. P., & Bode, P. 2008, ApJ, 676, 753
- Williamson et al. (2011) Williamson, R., Benson, B. A., High, F. W., Vanderlinde, K., Ade, P. A. R., Aird, K. A., Andersson, K., Armstrong, R., Ashby, M. L. N., Bautz, M., Bazin, G., Bertin, E., Bleem, L. E., Bonamente, M., Brodwin, M., Carlstrom, J. E., Chang, C. L., Chapman, S. C., Clocchiatti, A., Crawford, T. M., Crites, A. T., de Haan, T., Desai, S., Dobbs, M. A., Dudley, J. P., Fazio, G. G., Foley, R. J., Forman, W. R., Garmire, G., George, E. M., Gladders, M. D., Gonzalez, A. H., Halverson, N. W., Holder, G. P., Holzapfel, W. L., Hoover, S., Hrubes, J. D., Jones, C., Joy, M., Keisler, R., Knox, L., Lee, A. T., Leitch, E. M., Lueker, M., Luong-Van, D., Marrone, D. P., McMahon, J. J., Mehl, J., Meyer, S. S., Mohr, J. J., Montroy, T. E., Murray, S. S., Padin, S., Plagge, T., Pryke, C., Reichardt, C. L., Rest, A., Ruel, J., Ruhl, J. E., Saliwanchik, B. R., Saro, A., Schaffer, K. K., Shaw, L., Shirokoff, E., Song, J., Spieler, H. G., Stalder, B., Stanford, S. A., Staniszewski, Z., Stark, A. A., Story, K., Stubbs, C. W., Vieira, J. D., Vikhlinin, A., & Zenteno, A. 2011, ApJ, 738, 139
- Wu & Hammer (1993) Wu, X.-P. & Hammer, F. 1993, MNRAS, 262, 187
- Zwicky (1933) Zwicky, F. 1933, Helvetica Physica Acta, 6, 110