Galaxy And Mass Assembly (GAMA): Galaxy environments and star formation rate variations
Abstract
We present a detailed investigation into the effects of galaxy environment on their star formation rates (SFR) using galaxies observed in the Galaxy and Mass Assembly Survey (GAMA). We use three independent volume-limited samples of galaxies within and . We investigate the known SFR-density relationship and explore in detail the dependence of SFR on stellar mass and density. We show that the SFR-density trend is only visible when we include the passive galaxy population along with the star-forming population. This SFR-density relation is absent when we consider only the star-forming population of galaxies, consistent with previous work. While there is a strong dependence of the on density we find, as in previous studies, that these trends are largely due to the passive galaxy population and this relationship is absent when considering a “star-forming” sample of galaxies. We find that stellar mass has the strongest influence on SFR and with the environment having no significant effect on the star-formation properties of the star forming population. We also show that the SFR-density relationship is absent for both early and late-type star-forming galaxies. We conclude that the stellar mass has the largest impact on the current SFR of a galaxy, and any environmental effect is not detectable. The observation that the trends with density are due to the changing morphology fraction with density implies that the timescales must be very short for any quenching of the SFR in infalling galaxies. Alternatively galaxies may in fact undergo predominantly in-situ evolution where the infall and quenching of galaxies from the field into dense environments is not the dominant evolutionary mode.
keywords:
galaxies: evolution – galaxies: environment – galaxies: general – galaxies: formation1 Introduction
The factors affecting the evolution of galaxies are unlikely to be limited to their intrinsic properties, as it has been widely reported that star formation rate (SFR) is suppressed in cluster environments compared to SFRs in field galaxies (Lewis et al., 2002; Gómez et al., 2003; van den Bosch et al., 2008; Pasquali et al., 2009). In contrast, Baldry et al. (2004), Balogh et al. (2004), Peng et al. (2010), Bolzonella et al. (2010) and Li et al. (2011), among others, have shown that the SFR-environment relation is driven largely by the changing fractions of passive galaxies and the SFR-mass relation. More recently evidence has emerged to show that not only does the changing fraction of passive galaxies indicate SFR suppression but that it can be used to constrain the time-scale of SFR-suppression (Wolf et al. 2009, Vulcani et al. 2010, Li et al. 2011, von der Linden et al. 2010, Macgee et al. 2011).
Evidence for the suppression of star-formation in galaxies at the cores of clusters is widely accepted through the work of many authors (e.g., Balogh et al., 1997; Hashimoto et al., 1998; Poggianti et al., 1999; Couch et al., 2001). Hashimoto et al. (1998) also found a continuous correlation with local galaxy density where the SFR decreases with increasing density. This is important as only a small fraction of galaxies occupy the cores of clusters, and in order to make judgments regarding the broad evolution of galaxies we must understand the effect density has on galaxies in varying positions in the clustering environment.
This idea was expanded by Lewis et al. (2002) and Gómez et al. (2003). Lewis et al. (2002), using the 2dF Galaxy Redshift Survey, found that SFR depends strongly on local density and is independent of proximity to a rich cluster. Gómez et al. (2003), using the Sloan Digital Sky Survey (SDSS) Early Data Release, showed that the SFR-density relation is most visible for galaxies with the highest SFRs. A similar conclusion was reached by Pimbblet et al. (2006) using the [Oii] line to measure the SFR for clusters at .
These results lead to proposals that the stripping of hot gas reservoirs from galaxies during hierarchical formation, where galaxies are accreted into high density regions from low density regions (Kauffmann, White & Guiderdoni, 1993; Cole et al., 2000), is the reason behind the reduction in SFRs in high density regions. There remains a large uncertainty behind the exact physical mechanisms that lead to this reduction of the gas in galaxies. Processes such as interactions between intragalactic and intergalactic media (Gunn & Gott, 1972), suppression of the accretion of gas rich materials (Larson, Tinsley & Caldwell, 1980; Bekki, Couch & Shioya, 2001, 2002; Bekki, 2009), tidal interactions (Byrd & Valtonen, 1990), galaxy harassment through high velocity encounters with other galaxies (Zabludoff et al., 1996; Moore et al., 1996), ram pressure stripping of the cold gas (Gunn & Gott, 1972; Quilis, Moore, & Bower, 2000) and in-fall and quench (also known as strangulation) have all been suggested as the underlying mechanism in SFR suppression. The significance of these processes for SFR reduction in clusters still remains speculative though, requiring more detailed analysis to uncover the fundamental processes that drive this SFR suppression.
Balogh et al. (1997) compared galaxies with similar luminosities and morphological features such as the bulge-to-disk ratio in cluster and field galaxies and found that SFRs were lower in cluster galaxies. This evidence suggests that the SFR-density relation cannot be explained using only the density-morphology relation (Dressler, 1980; van der Wel, 2008; Bamford et al., 2009). Lewis et al. (2002) reached a similar conclusion with findings that showed that the correlation between SFR and density predicted by the density-morphology relation is weaker than observed.
There has also been evidence for spirals in clusters that show SFRs similar to or even greater than spirals in the field (Gavazzi & Jaffe, 1985; Moss & Whittle, 1993; Gavazzi, 1998). The first observations of star-forming galaxies in clusters were made by Butcher & Oemler (1978) and Butcher & Oemler (1984). Dressler & Gunn (1983) concluded that an epoch of strong star-formation had recently ended in these galaxies. Gavazzi & Jaffe (1985) indicated that these galaxies may be undergoing a transient phenomenon before undergoing SFR suppression.
Interaction with the intracluster medium (Gunn & Gott, 1972), galaxy-galaxy interactions (Lavery & Henry, 1988), gas compression by ram pressure (Dressler & Gunn, 1983; Vollmer et al., 2001) and tidal interactions (Moss & Whittle, 2000) have been proposed as the root causes for a burst in SF prior to quenching it. Mateus & Sodré (2004) argue that tidal interactions are a likely candidate for this behavior as they are likely to cause both the burst and suppression in SFRs. There has also been evidence for the “pre-processing” of galaxies well before they enter the high density regions of clusters. The burst of star-formation observed in late-type galaxies as they are accreted into filaments is one such effect (Porter et al., 2008).
Elbaz et al. (2007) showed that the SFR-density relation inverts by redshift 1, consistent with the cluster galaxies having enhanced star-formation in the past compared to field galaxies, and also consistent with the idea that these galaxies form earlier and form their stars more rapidly at earlier times. Therefore, this effect is partly an evolutionary one, as implied by the Butcher-Oemler effect (Butcher & Oemler, 1978, 1984) where the blue-fraction of galaxies in clusters increases with redshift. Grützbauch et al. (2011a) and Grützbauch et al. (2011b) also show that mass and SFR are tightly coupled up to a redshift of , or even higher, with environment having a slight dependence.
Evidence has also emerged in the past few years that the apparent SFR-density relation is a result of the changing fractions of early and late-type galaxies with increasing density. One of the first to point this out was Baldry et al. (2004) who use galaxy colours to show that the colour-mass and colour-concentration index relation are not strong functions of environment. Balogh et al. (2004) also identified that the fractions of star-forming and quiescent galaxies vary strongly with density. Baldry et al. (2006) do, however, identify that the fraction of galaxies in the red sequence have a substantial dependence on stellar mass and environment.
More recently, Bolzonella et al. (2010), Wetzel et al. (2011), Deng et al. (2011) and Lu et al. (2011) use SFR and specific SFR (SSFR) to show that the SFR-density relation is largely a product of the changing fraction of passive galaxies as well as the relation between SFR and mass. Deng et al. (2011), for instance, show that the environmental dependence of SFRs and SSFRs is much stronger for red galaxies compared to blue galaxies implying that an increasing fraction of red galaxies is a primary driver for the SFR and SSFR-density relation.
The question then is whether this evidence for changing fraction of galaxy types indicates that there is no quenching of the SFR of galaxies falling into clusters or the quenching occurs on a very rapid time-scale not observed in the above analyses. Peng et al. (2010) argue that the dependence of the red fraction of galaxies on environment for fixed masses is indeed evidence for the suppression of SFRs with increasing density. They demonstrate that stellar mass and environment affect passive and star-forming galaxies in different and independent ways which they refer to as “mass quenching” and “environmental quenching”. While the “mass quenching” is a continuous process that is proportional to the SFR of the galaxies, the “environmental quenching” occurs on a very short time-frame that could possibly be a result of satellite galaxies falling into larger halos.
There is controversy regarding the timescales on which the “infall and quench” model operates. Wolf et al. (2009) and Vulcani et al. (2010) present evidence for SFR suppression in star-forming galaxies in clusters, particularly for low-mass galaxies, reasoning that the quenching process occurs over longer timescales due to the abundance of red spiral galaxies and the unchanged SFR-mass relation. Similarly, von der Linden et al. (2010) suggested that the quenching timescales are longer and comparable to the cluster-crossing time on the scale of a few Gyr. Balogh et al. (2004) and McGee et al. (2011), however, find no evidence for changes in colour or SFR with density for star-forming galaxies. McGee et al. (2011), therefore, argues that the processes that lead to the SFR suppression must be fast-acting, and propose infall and quench as a possible quenching mechanism. Bolzonella et al. (2010), Wetzel et al. (2011) and Weinmann et al. (2010) agree that the lack of SFR-density relation in star-forming galaxies means that these time-scales are likely to be short.
In our analysis, we confirm the result from recent work showing that the previously reported “suppression” in SFR with increasing local density can be explained as a consequence primarily of the changing population mix of galaxies. We further demonstrate that the range of SFRs for actively star-forming galaxies is independent of local density. To add clarity in the discussion of these effects, we will limit our use of the term “suppression” only to cases when we refer to physical mechanisms that may cause the SFR to be reduced. Otherwise we restrict ourselves to describing the distribution of SFRs independently of any implied physical mechanism promoting or retarding them.
In 2 we describe the data used in this analysis. In 3 we compare the SFR-density relation for a sample of the GAMA galaxies with the results of Gómez et al. (2003). The interplay between stellar mass, SFR, , and density is explored in detail in 4, and in 5 we illustrate the lack of density dependence in the distribution of SFR for a sample of star-forming galaxies. We quantify galaxy morphologies into early and late-types in 6, to tease apart further this lack of density dependence for SFR, before discussing our results in 7 and concluding in 8. Throughout we assume 70 km s-1 Mpc-1, and . All magnitudes are in the AB system.
2 Data
We use data from the Galaxy and Mass Assembly (GAMA) survey (Driver et al., 2009, 2011). GAMA is a multi-band imaging and spectroscopic survey covering 144 square degrees of sky in three regions (Robotham et al., 2009; Baldry et al., 2009; Driver et al., 2011). The original spectroscopy comes from the AAOmega spectrograph (Sharp et al., 2006) at the Anglo-Australian Telescope (AAT).
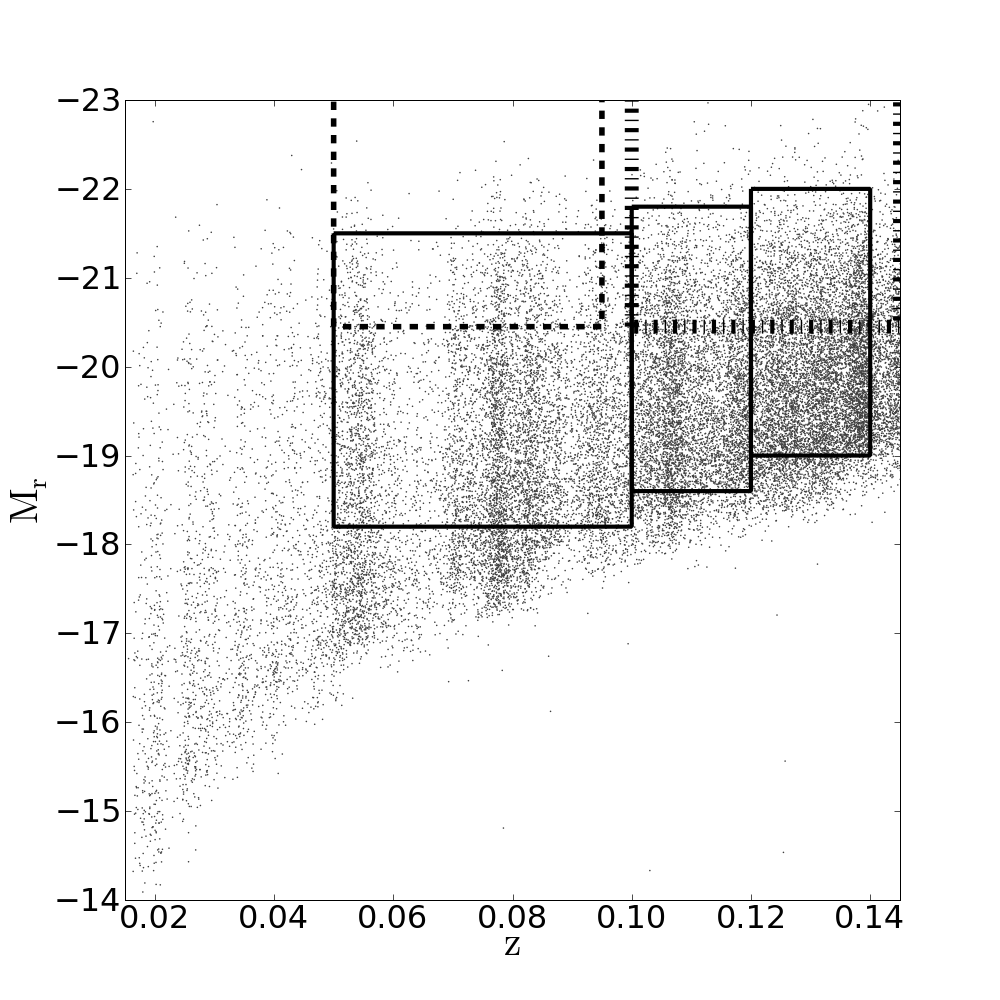
Three volume-limited samples were selected for the main analysis defined in Table 1 and as shown in Figure 1. We use multiple volume-limited samples in order to assess the effects of the SFR-density relation over a range of possible redshifts and values. The discontinuity in the redshift ranges for the volume-limited samples is to ensure that the widest range of redshifts is covered as well as to avoid effects due to sky-lines that fall on the H wavelength when it is redshifted between z = 0.145 and 0.175 (Gunawardhana et al., 2011). In order to minimise any evolutionary effects that might otherwise bias the results, each volume-limited sample was chosen to have a reasonably narrow redshift range. A fourth volume-limited sample was constructed in order to carry out an analysis comparable to that by Gómez et al. (2003). As our data does not extend to the same -band absolute magnitude () values at the redshifts investigated by Gómez et al. (2003), due to the smaller survey area of GAMA, we opt to use a similar limit in at a slightly higher redshift, with and . This limit was chosen to have the same width in redshift as Gómez et al. (2003). In comparison the Gómez et al. (2003) volume-limited sample was defined as and . Both these regions are displayed in Figure 1, but only the volume-limited sample defined as and from GAMA is used in the analysis below.
| Label | z | Sample size | |
|---|---|---|---|
| VL1 | 6036 | ||
| VL2 | 4421 | ||
| VL3 | 6133 |
The SFRs are calculated using the prescription outlined in Wijesinghe et al. (2011). The SFRs are derived using the H EW with stellar absorption corrections of 0.7Å (Gunawardhana et al., 2011; Brough et al., 2011), and the dust obscuration corrections are calculated using the Balmer decrement. Stellar masses used in the analysis were derived by Taylor et al. (2011) using the models of Bruzual & Charlot (2003) with exponentially declining SFHs, a Chabrier IMF (Chabrier, 2003), and Calzetti dust (Calzetti et al., 2001).
The galaxy environments are defined for a volume-limited sample of galaxies with and (Brough et al. in prep.; Rowlands et al. 2011). The density, , is calculated using a nearest neighbour metric which is similar to in Brough et al. (2011) and used in Prescott et al. (2011). The surface density (), in number of galaxies per , to the nearest neighbour is calculated as,
| (1) |
where is the projected comoving distance to the nearest neighbour within . Densities are calculated for galaxies with (where is the -band petrosian magnitude), and with reliable redshifts (nQ ; Driver et al. 2011). All densities are given in units of number of galaxies per . We use bins with a fixed number of galaxies when determining density bins for the Figures below. The number of galaxies per bin is given explicitly in the caption or description for each Figure as this number varies according to the overall number of galaxies available for the analysis.
Active galactic nuclei (AGN) were eliminated from the analysis using the emission line diagnostic ratio prescription of Kewley (2006). We do not expect our results to be sensitive to how we select AGNs (Bamford et al., 2008). We use two sample of galaxies, “full” and “star-forming”, neither of which include AGNs. The “full” sample only excludes galaxies with SFR . We exclude these galaxies due to their extreme SFRs that may result from overestimated obscuration or aperture corrections. Our results are not changed substantially if this extreme population is retained. The volume-limited samples, VL1, VL2 and VL3 contain only 3, 5 and 10 galaxies with SFR respectively.
The “star-forming” sample is a subset of the “full” sample. We select H equivalent width (EW) Å and / in order to eliminate low signal-to-noise (S/N) H fluxes and also galaxies with H fluxes that contained discrepancies in their measurements respectively. These selections ensure that the spectra used to measure the SFRs, EWs and dust obscuration corrections are robust. Positive EWs represent emission. We also make a further selection cut of SFR to ensure these galaxies are indeed star-forming. The three volume-limited samples, VL1, VL2 and VL3 contain 3187, 1851 and 2298 star-forming galaxies respectively which comprise the “star-forming” sample for each of these volume-limited samples.
We may still be missing a population of high SFR galaxies with faint broadband emission (fainter than the GAMA magnitude limit, see Gunawardhana et al. in prep.). This bias, however, is also true of the Gómez et al. (2003) sample, which we compare to below. We return to possible implications from this effect for our results in the discussion.
3 Suppression or Population Mix?
3.1 Suppression
The results of Lewis et al. (2002) and Gómez et al. (2003) have shaped our understanding of galaxy evolution and environmental effects over the past decade. In order to examine the relationship between density and SFR we begin by reproducing the analysis of Gómez et al. (2003). We aim to investigate a sample as close as possible to being directly comparable to this previous work in order to establish a baseline for further exploration. We compare the results of Gómez et al. (2003) to galaxies in a similar range, although at a higher redshift, in order to have a significant sample size. We compare with the Gómez et al. (2003) analysis as opposed to that of Lewis et al. (2002) simply because the density measurement of Gómez et al. (2003) is more comparable to ours.
The results of Gómez et al. (2003) were derived for a sample of 8598 galaxies with densities derived using a nearest neighbour approach. Our comparison volume-limited region contains 5019 galaxies with densities measured using the distance to the nearest neighbour approach with and . These densities, while not quantitatively comparable, are nonetheless quite similar (they probe the same local environment), and are sufficient for the comparison we present here.
For this comparison sample we derived the and the SFR in a manner similar to that of Gómez et al. (2003) and we use the “full” sample of galaxies. The values for our comparison sample are simply the observed values and no corrections have been applied. The H SFRs derived for these galaxies only include dust corrections (using the formalism of Hopkins et al. 2001) and do not include aperture corrections, again following Gómez et al. (2003). The SFRs, however, were derived using the and the -band absolute magnitude values as opposed to the as in Gómez et al. (2003).
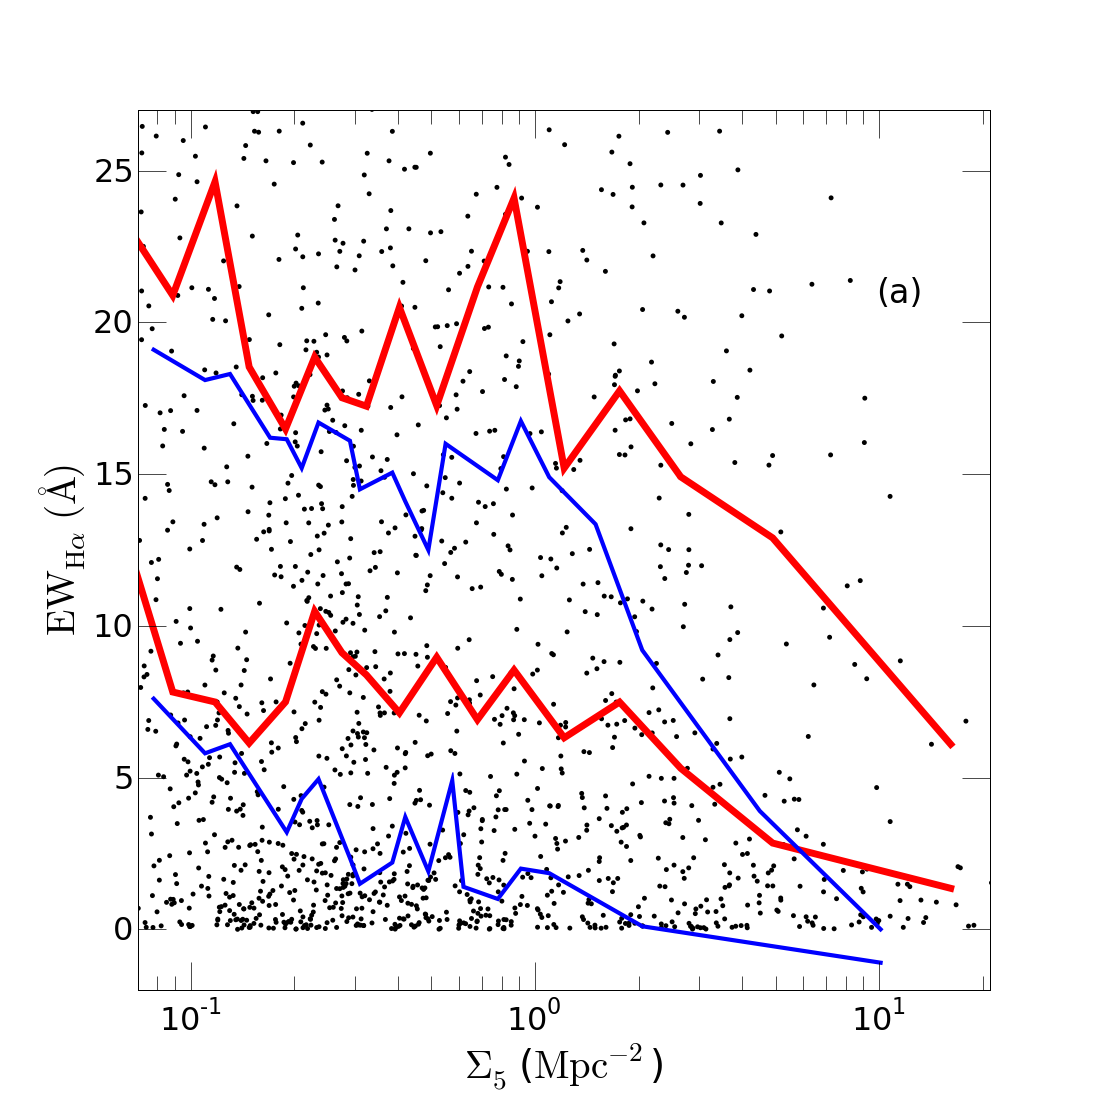
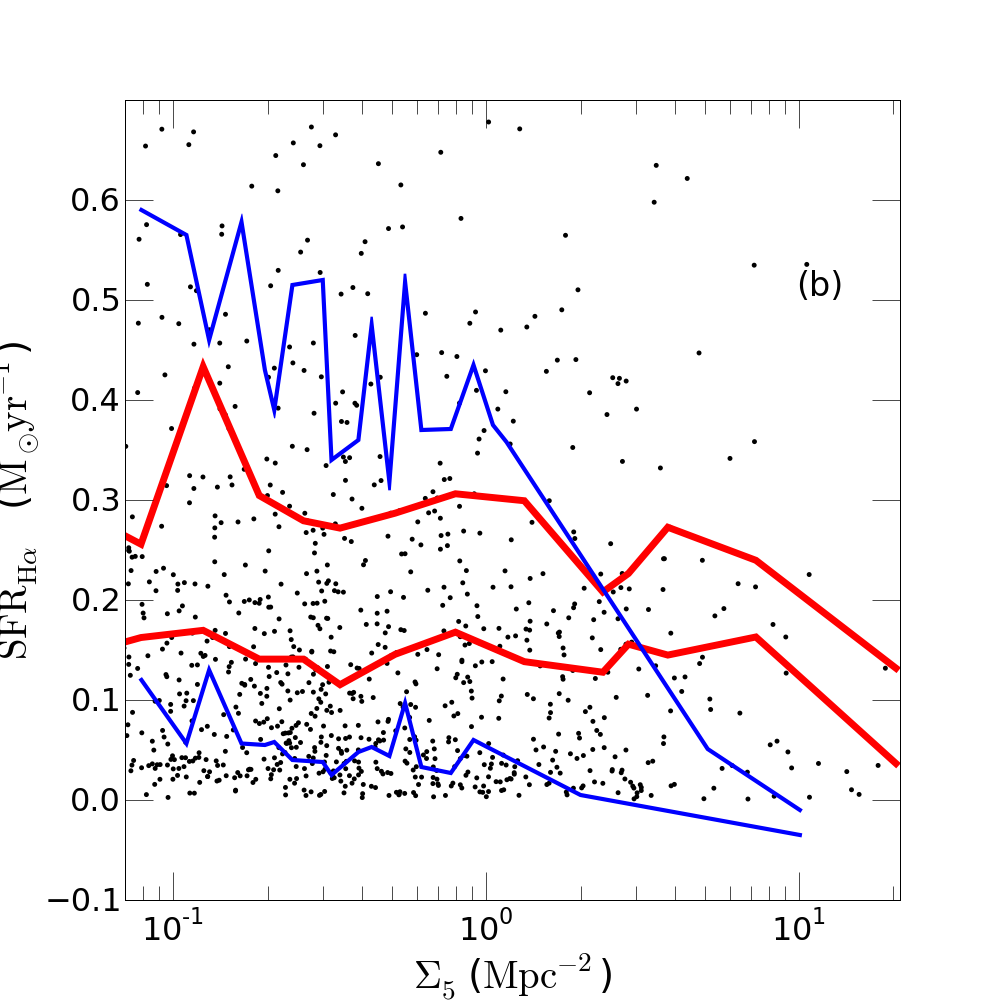
Figure 2 compares our measurements against those from Gómez et al. (2003). Lines representing the median and percentiles are shown. Figure 2 (a) shows a very similar trend between our sample (red line) and that of Gómez et al. (2003) (blue line). The of our sample, however, is consistently higher than that of the Gómez et al. (2003) sample. This is a consequence, in part, of the fact that we have measured EWs only for emission lines. Moreover, galaxies with H flux values below were excluded from the analysis, as these correspond to low signal-to-noise lines whose equivalent widths are highly uncertain.
Figure 2 (b) compares the SFR distribution. The result shows a weaker, but still significant, trend to that of Gómez et al. (2003), and our SFRs appear to be lower by about a factor of two. This may be a consequence of our different density estimator, combined with our use of EW rather than flux in the calculation of SFR here. Probably the larger effect, though, is that while we sample the brightest values in GAMA, the smaller survey area of GAMA means that with the same absolute magnitude limit as Gómez et al. (2003) we are biased towards low SFRs. As a consequence of not sampling galaxies as bright as those of Gómez et al. (2003) we expect to be dominated by lower SFRs, as seen in Figure 2 (b).
3.2 Population Mix
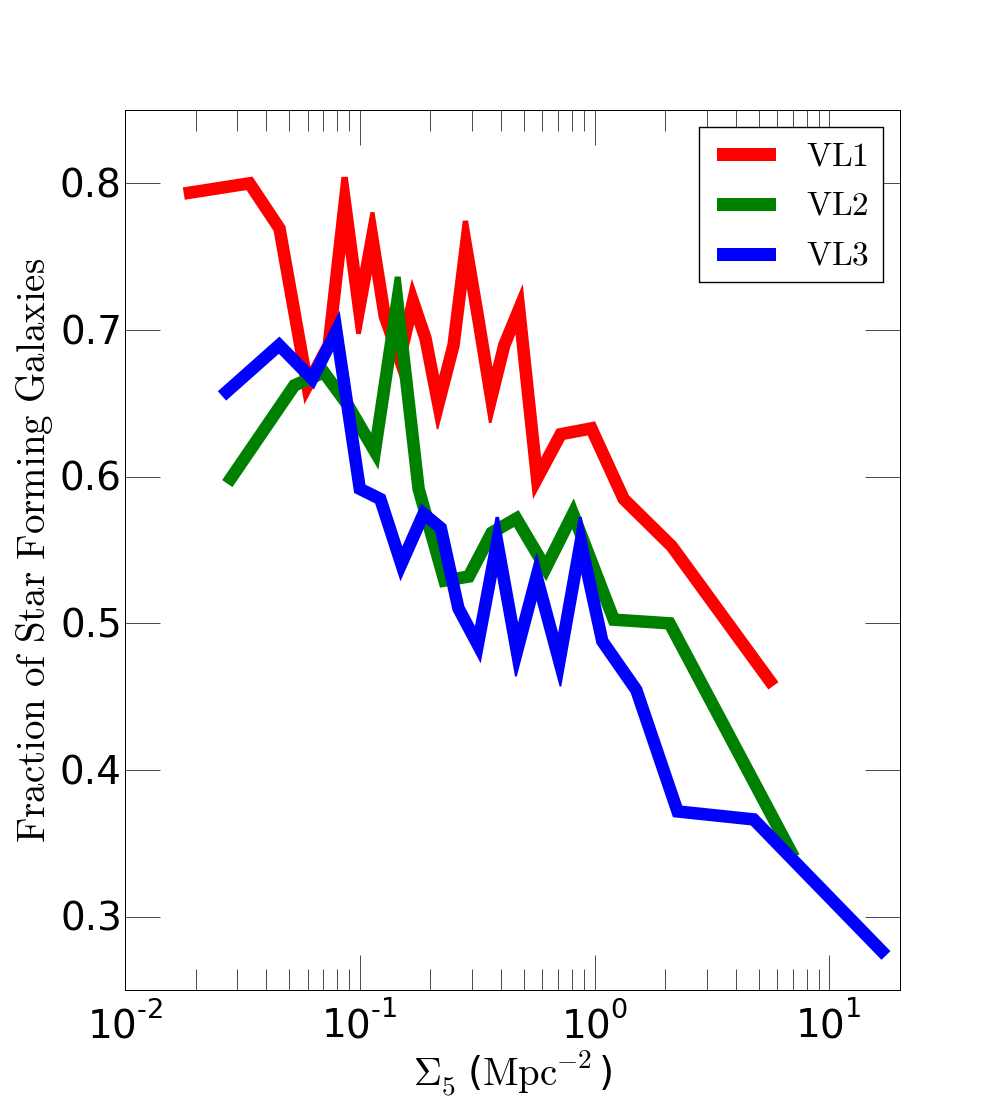
While the comparison with the analysis of Gómez et al. (2003) provides a clear indication that our sample follows the trends previously established, an analysis of the star-forming galaxy fraction of the three volume-limited samples is illuminating. We define the star-forming fraction as the ratio of the number of galaxies in the “star-forming” sample to the “full” sample. We use adaptive density bins requiring the “star-forming” sample to contain a minimum of 100 galaxies per bin. Figure 3 shows a systematic decrease in the fraction of star-forming galaxies with increasing density for the three volume-limited samples. The fraction drops from 60% to 10% over our observed density range (Figure 3). The red, green and blue lines correspond to a redshift range of , & respectively, as defined in Table 1.
The density ranges over 3 orders of magnitude for each volume limited sample from to . There is mild variation with redshift, with the overall star-forming galaxy fraction being lower with increasing redshift. This is likely to be related to galaxy stellar mass, as we are less sensitive to lower stellar mass galaxies at higher redshift. As high stellar mass galaxies are more likely to be passive, we would expect to see a lower star-forming galaxy fraction at higher redshift.
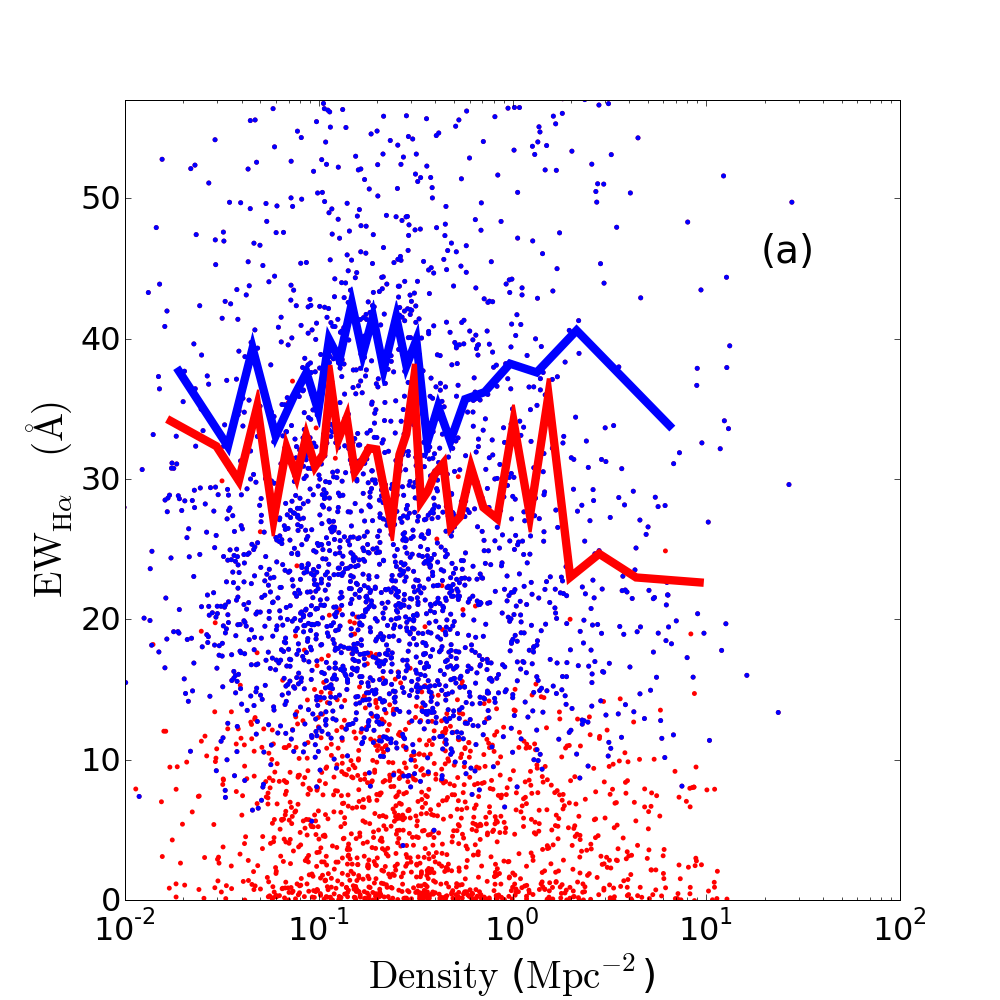
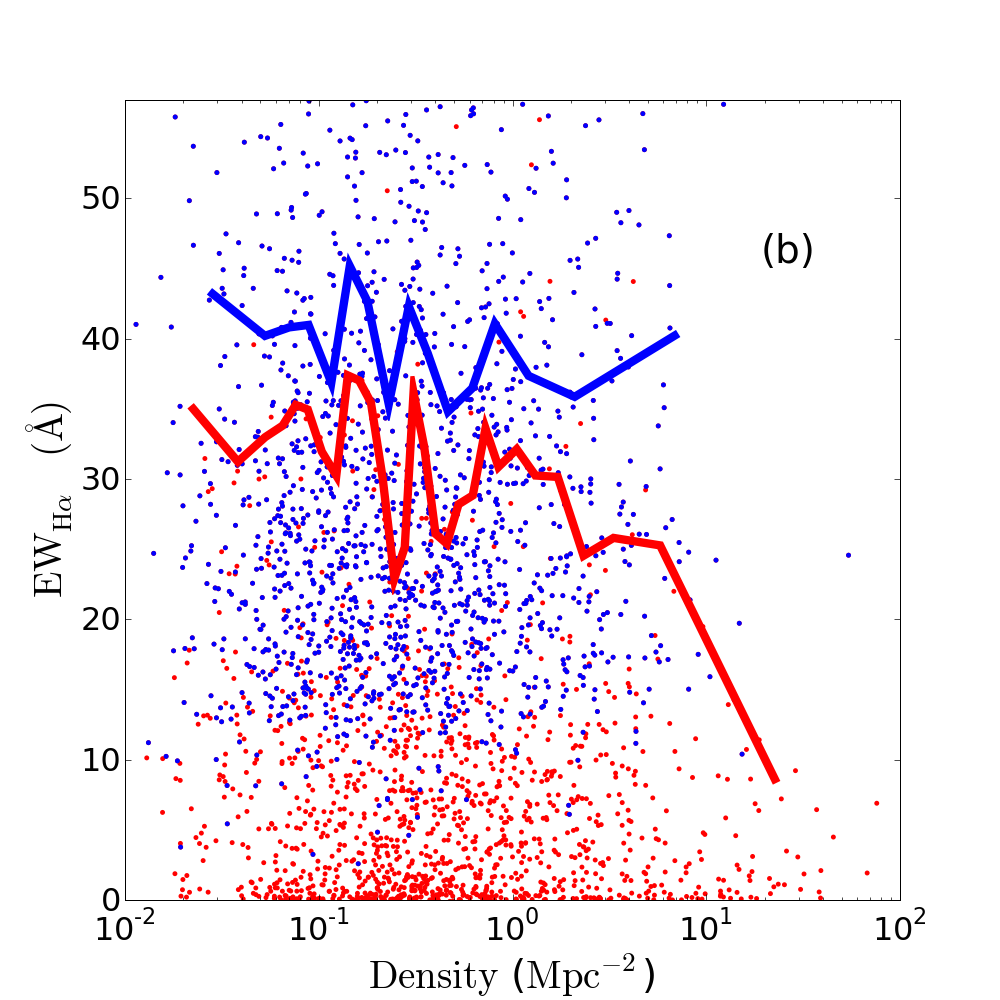
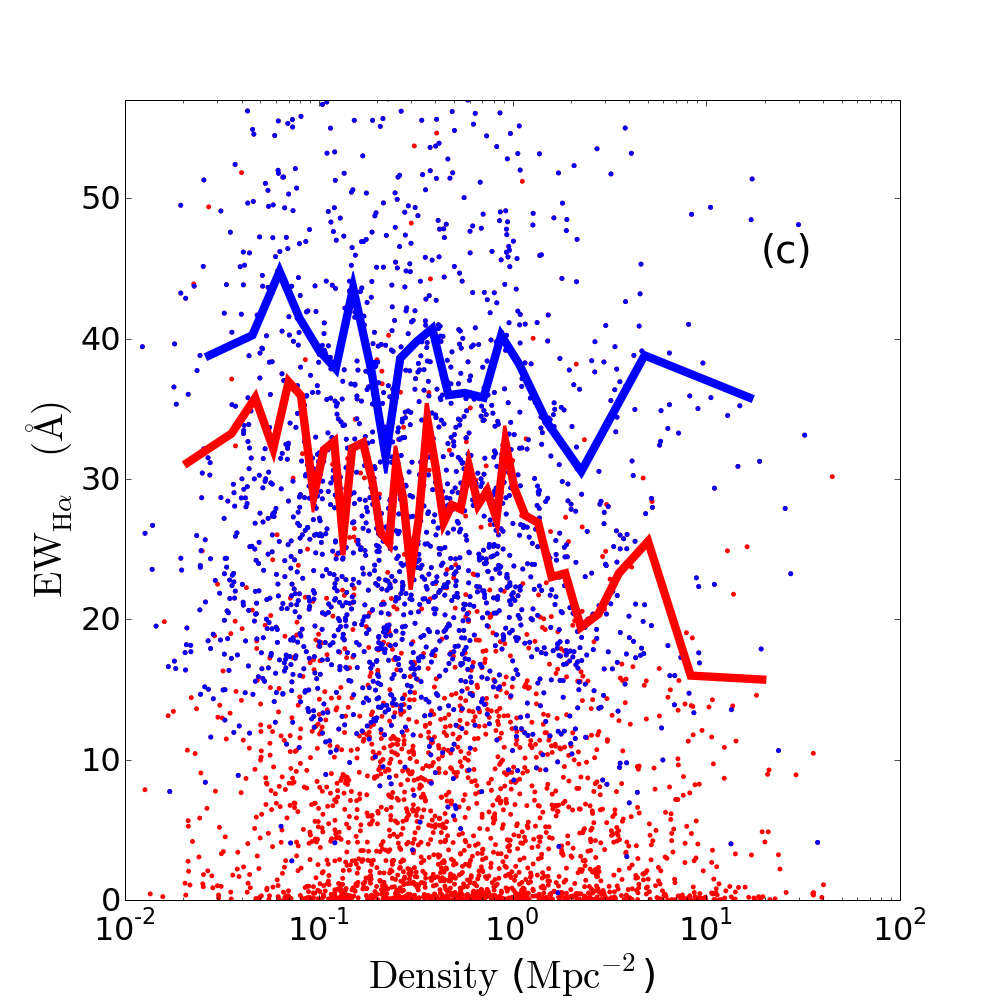
The relationship between and density for these three volume-limited samples is shown in Figure 4. Again we find that the has a strong dependence on galaxy density for the “full” sample (red line in Figure 4). For all three volume-limited samples we find that decreases from values of 35Å down to 20Å (Figure 4a), 10Å (Figure 4b) and 15Å (Figure 4c). The trends are similar across the three different volume limited samples and they also appear to be similar to the trends of Gómez et al. (2003) as shown in Figure 2. The reduction in the median with increasing density is highly significant.
Figure 3 shows that the “star-forming” sample does not uniformly sample all densities, dominating in lower densities. We expect, then, that the relationship between density and will be different for the “star-forming” sample compared to the “full” sample of galaxies. The blue line in Figure 4 represents the relationship between and density when only the “star-forming” sample of galaxies is used. The trend between and density is essentially absent for the star-forming population.
The selection of star-forming galaxies carries further significance when considering SFR as opposed to simply EW and it would be expected that SFR will also show weak trends, if any, against density. This is investigated more thoroughly in the following section. The immediate implication is that the Gómez et al. (2003) results are driven by the increasing proportion of the passive galaxy population and not necessarily by a physical suppression driven by the density of the environment.
This is consistent with the result of McGee et al. (2011) and supports the work of Balogh et al. (2004, 2006) who showed a lack of SFR dependence on the environment for the star-forming population.
4 Disentangling SFR, Stellar Mass and Density
The results of the previous section leave it unclear as to how much of an effect density has on star-forming galaxies. While a strong relationship between stellar mass and SFR in galaxies is well established (e.g., Peng et al., 2010), the above results question the extent to which a galaxy’s local density plays a role in suppressing star-formation in star-forming galaxies. In order to disentangle the three-way relationship between SFR, stellar mass and density we investigate the three parameters as functions of each other. This demonstrates the dominant effect of stellar mass, rather than environment, in governing the SFR distribution consistent with the results of Peng et al. (2010).
While we only show relationships between and density and density the same trends are observed with SSFR. This is a necessary first step, in order to eliminate any biases that might be introduced simply due to the changing population mix with density. This investigation uses only our “star-forming” sample, within each volume-limited sample.
4.1 As a function of SFR and EW
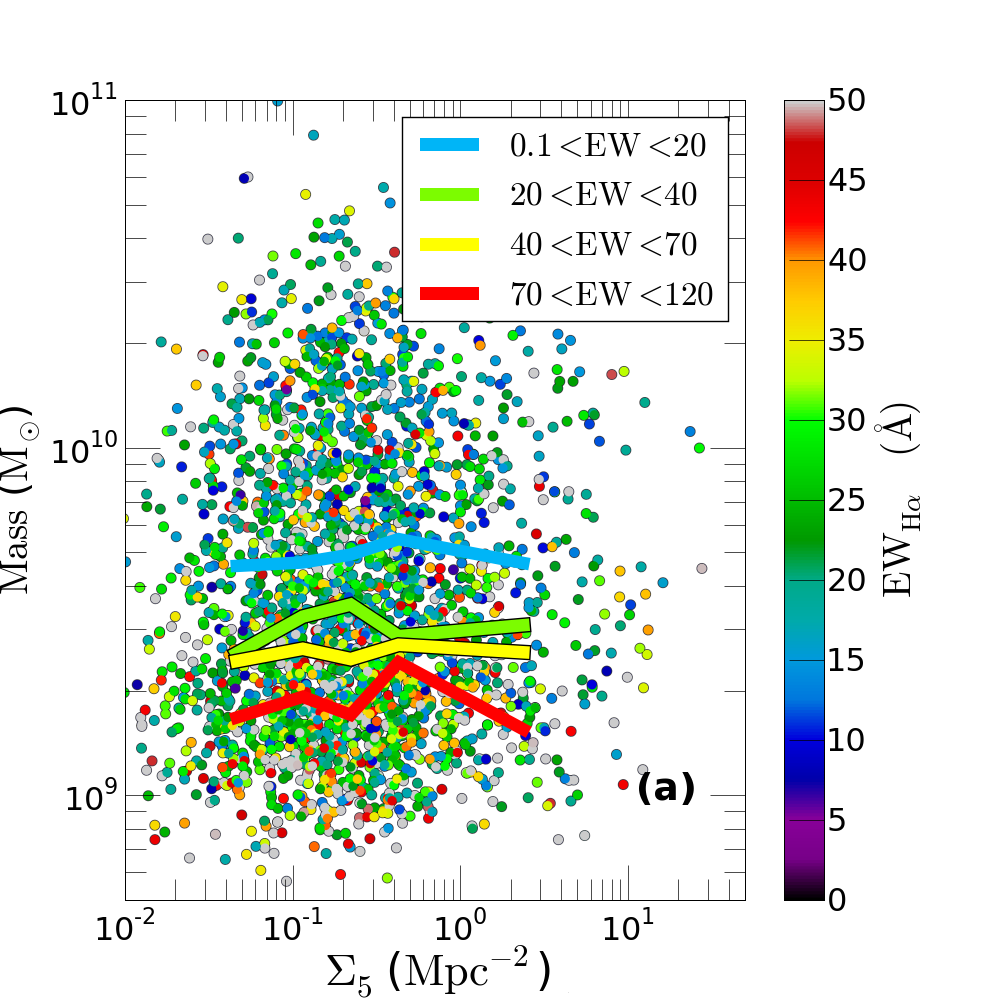
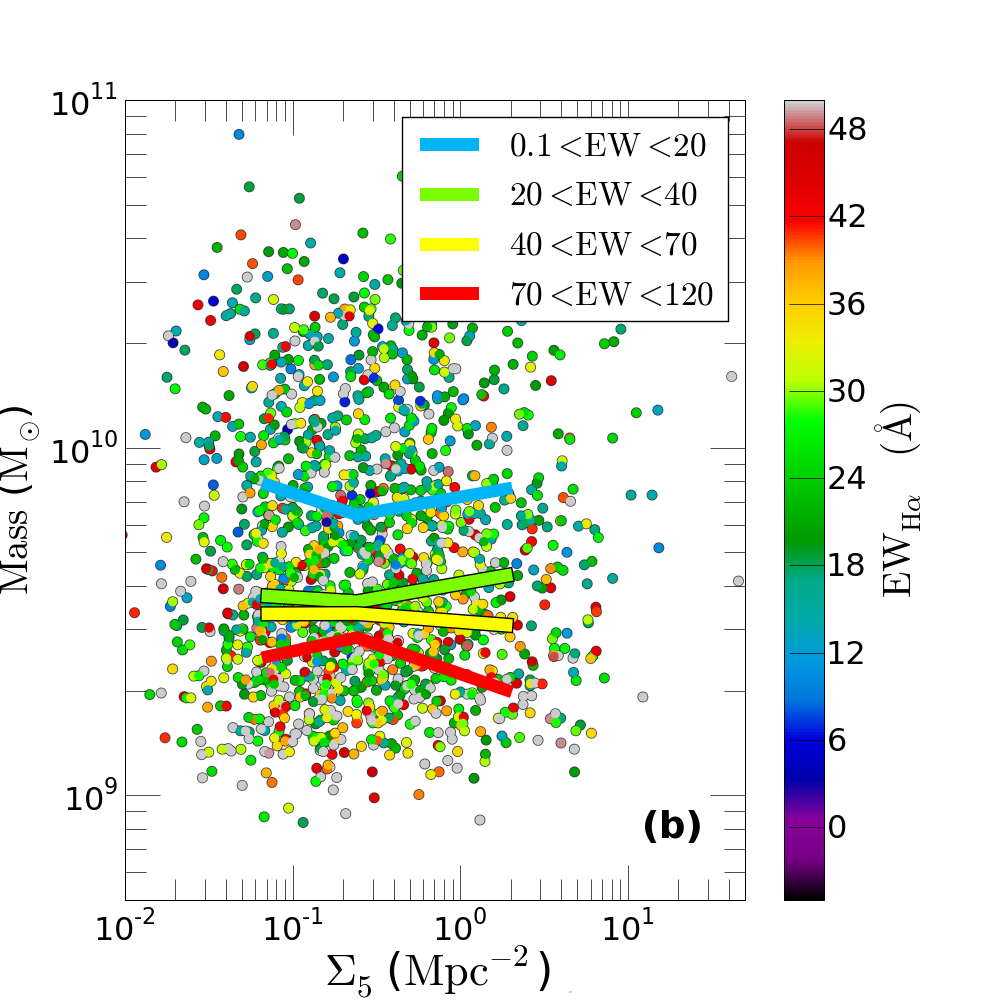
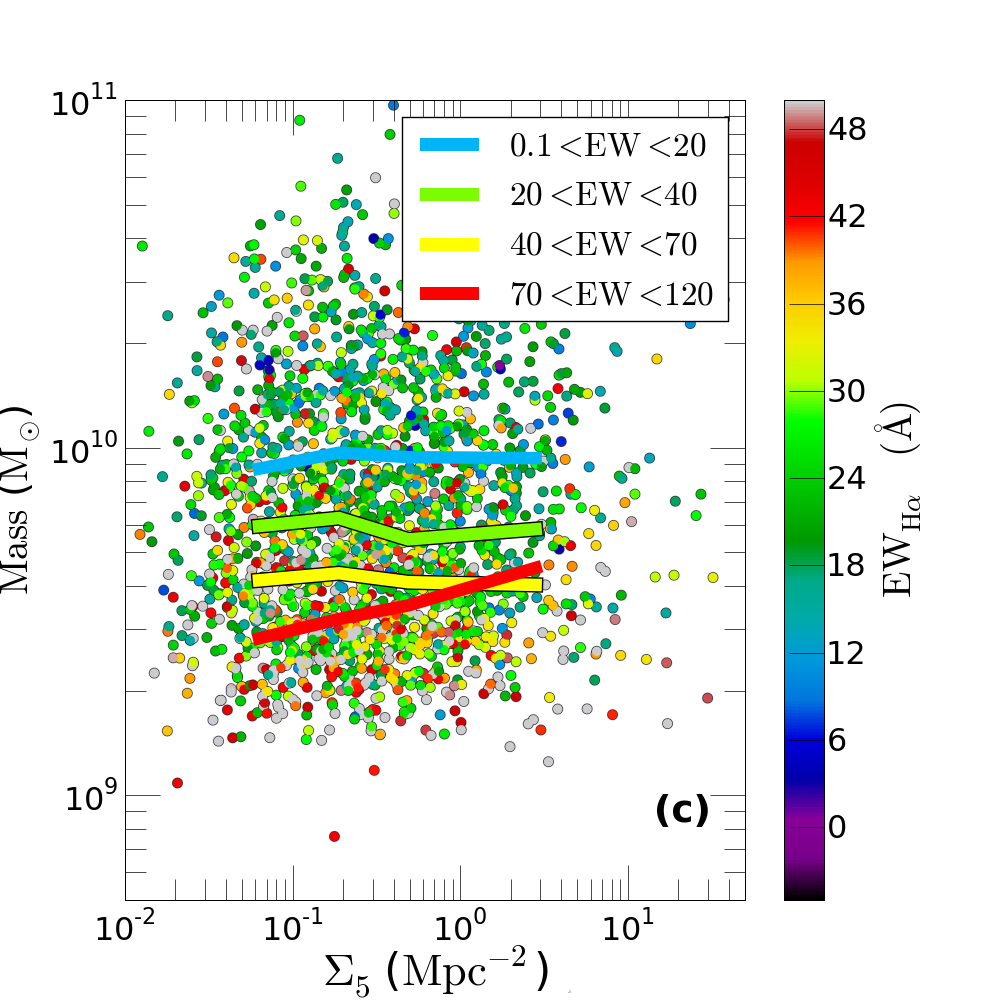
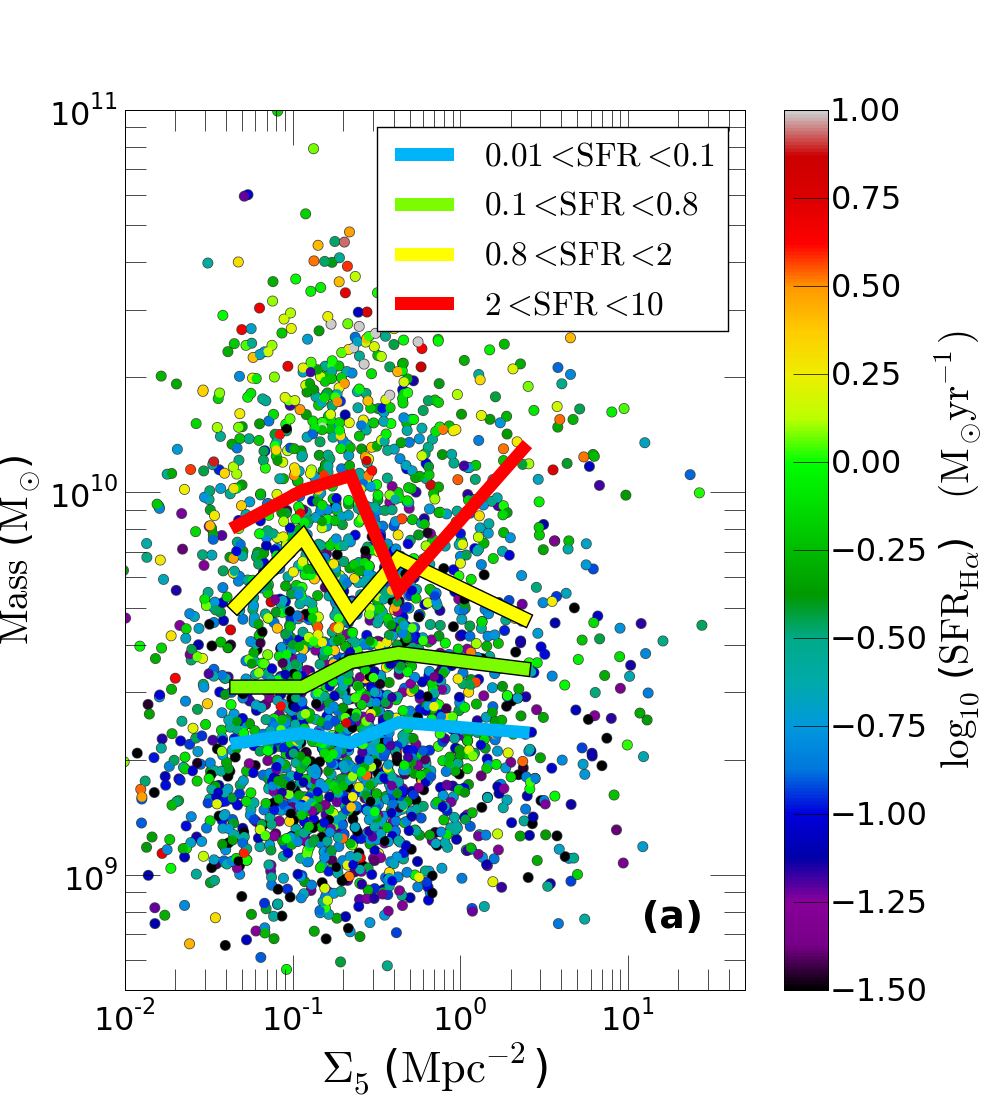
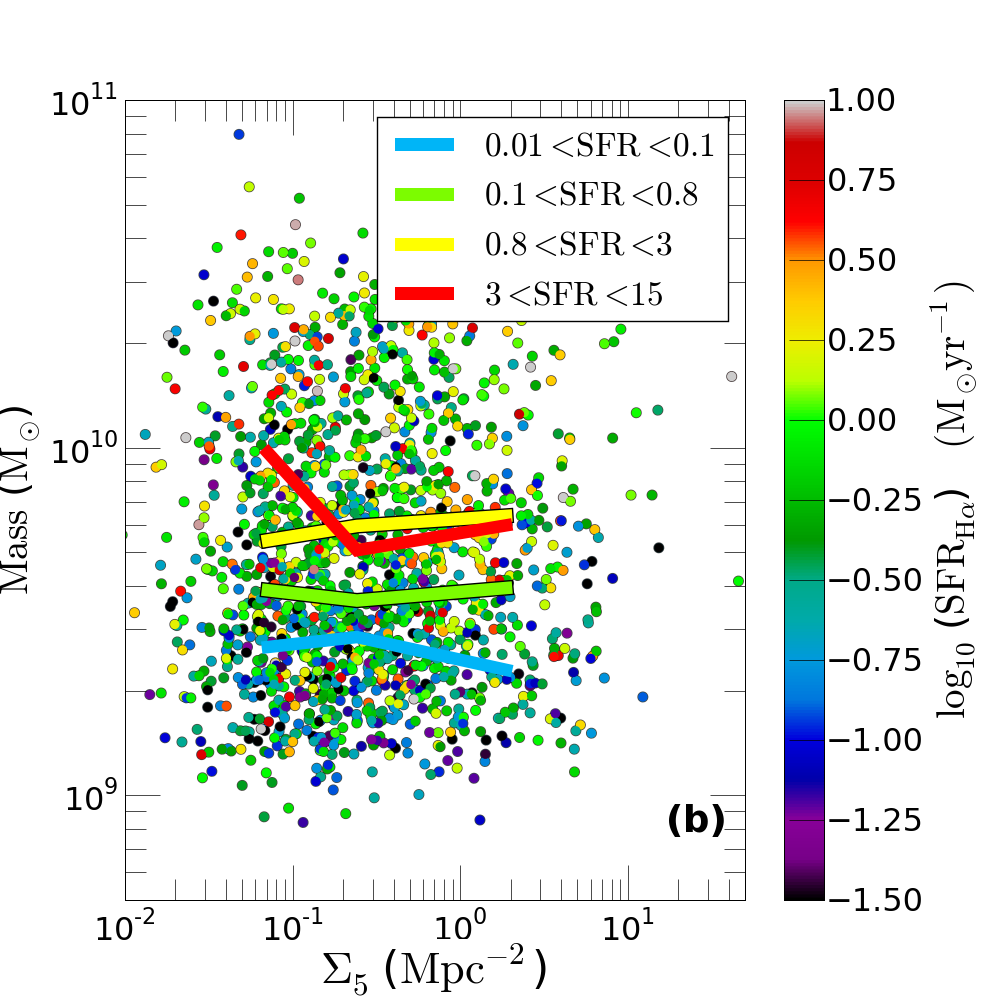
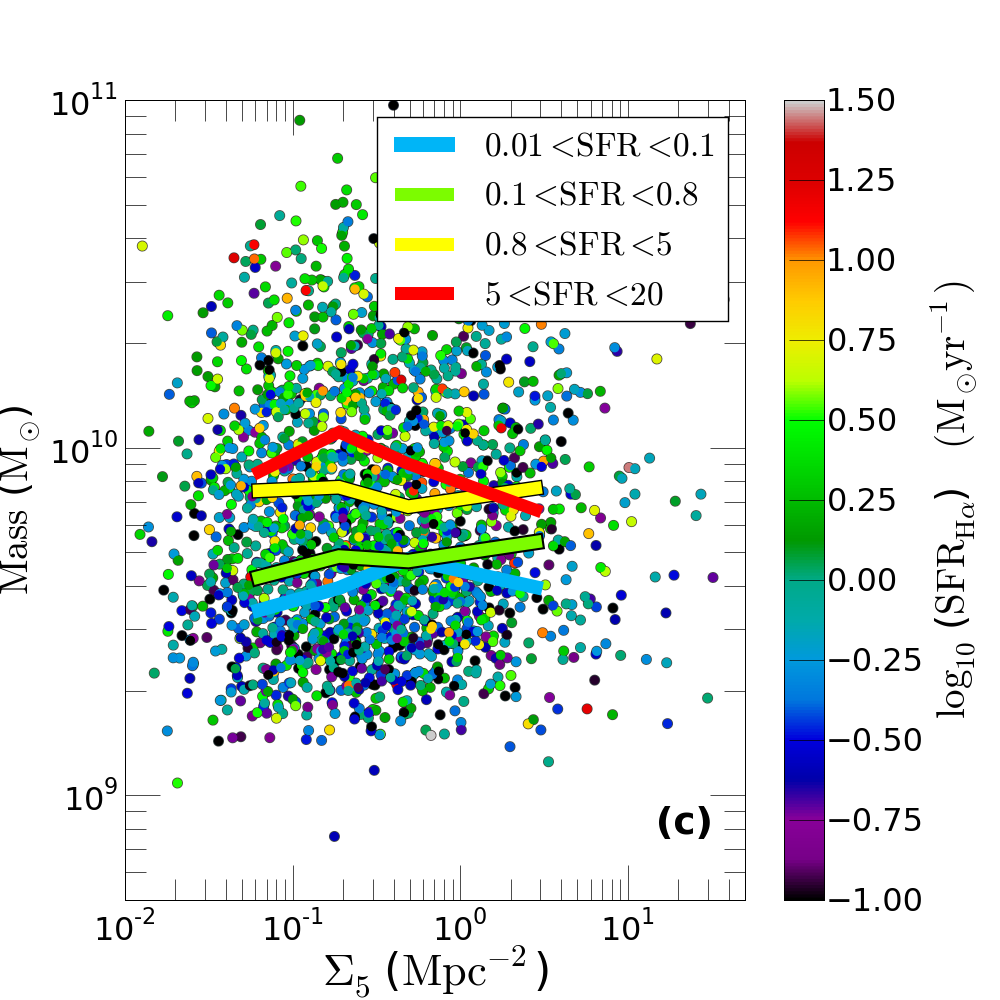
Figures 5 and 6 show galaxy stellar mass as a function of density, with medians in bins of (Figure 5) and SFR (Figure 6). These Figures do not show a strong dependence of stellar mass on density for any given EW or SFR. We do, however, observe that the EWs and SFRs are affected by stellar mass, as there is a clear separation in the median lines between EW and SFR bins.
The median lines also highlight the absence of a relationship between density and stellar mass for varying SFR and EW. In other words, the high and the low SFR and EW bins show similarly flat trends between stellar mass and density.
The sampling of higher masses at higher redshift means that the ranges of SFR and EW shown (in the “star-forming” sample) increase systematically with redshift. The median lines, though, show consistent results for each volume-limited sample. We conclude that there is no strong relationship between the stellar mass in star-forming galaxies and density, as a function either of or SFR.
4.2 As a function of stellar mass
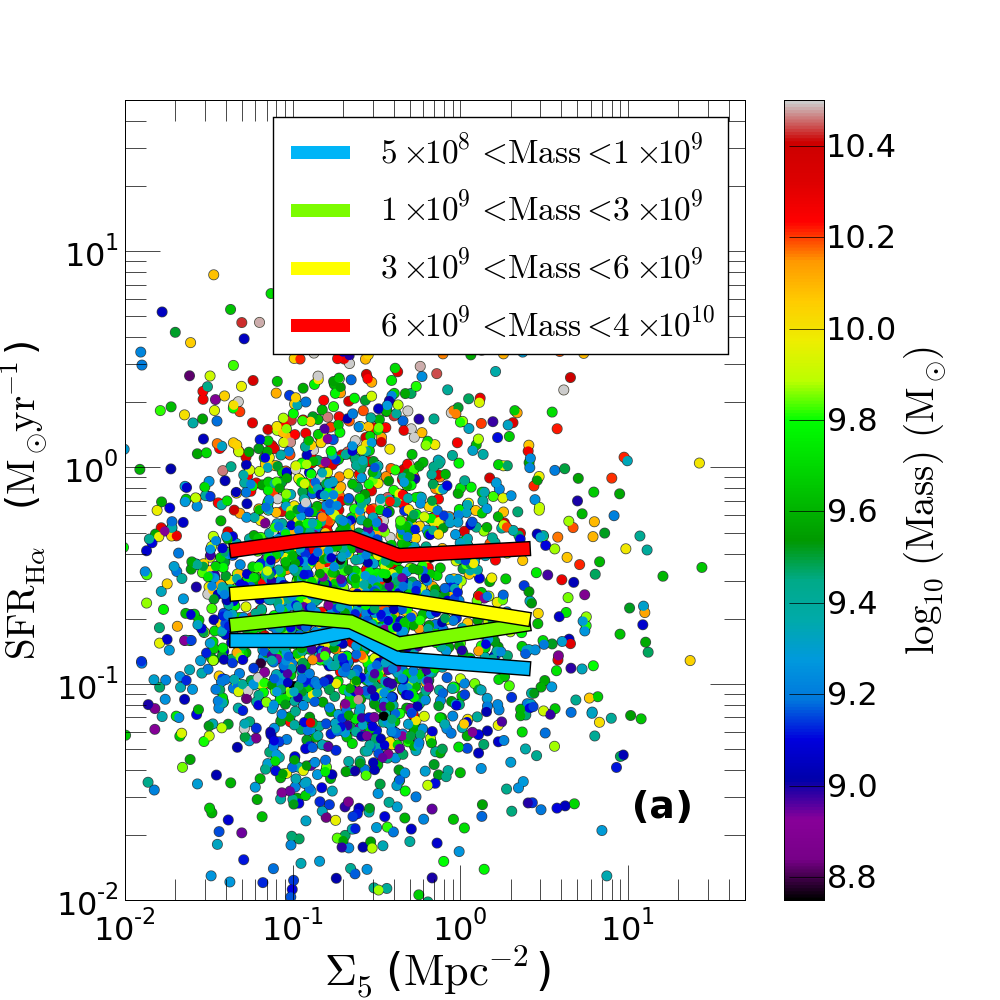
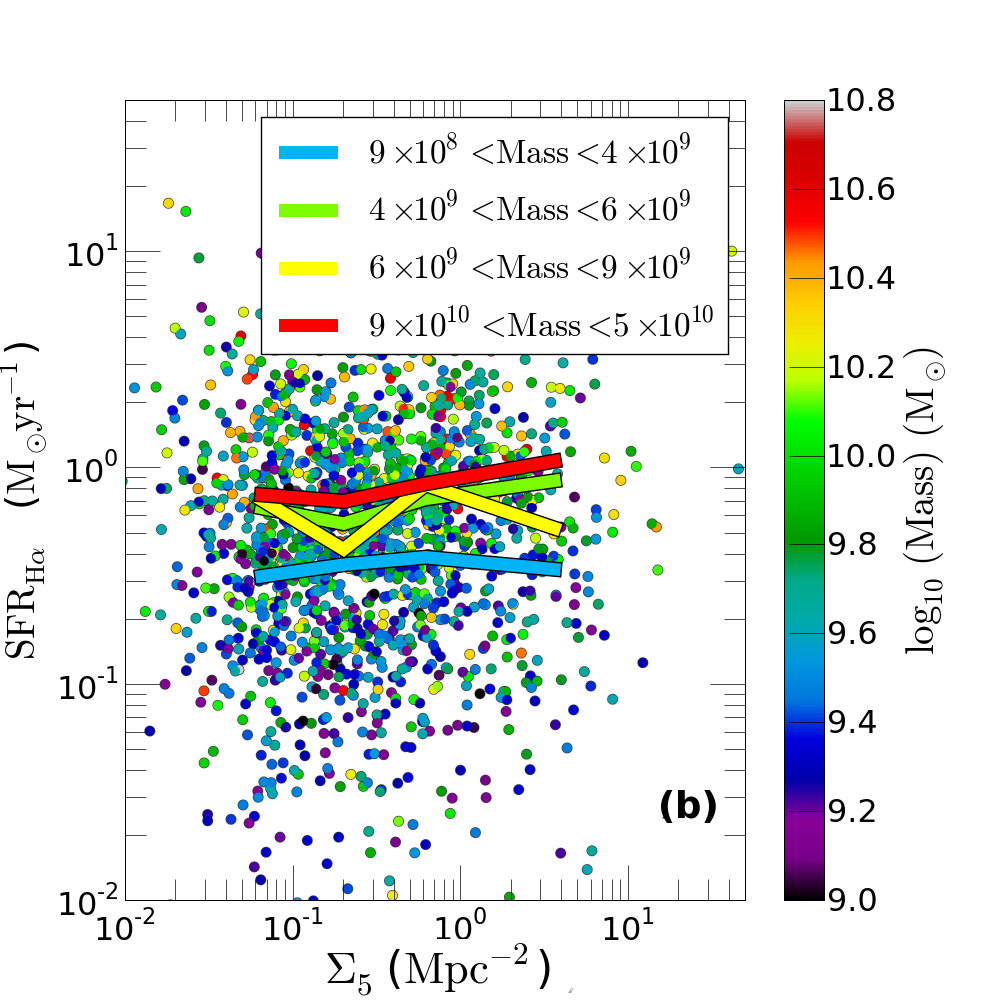
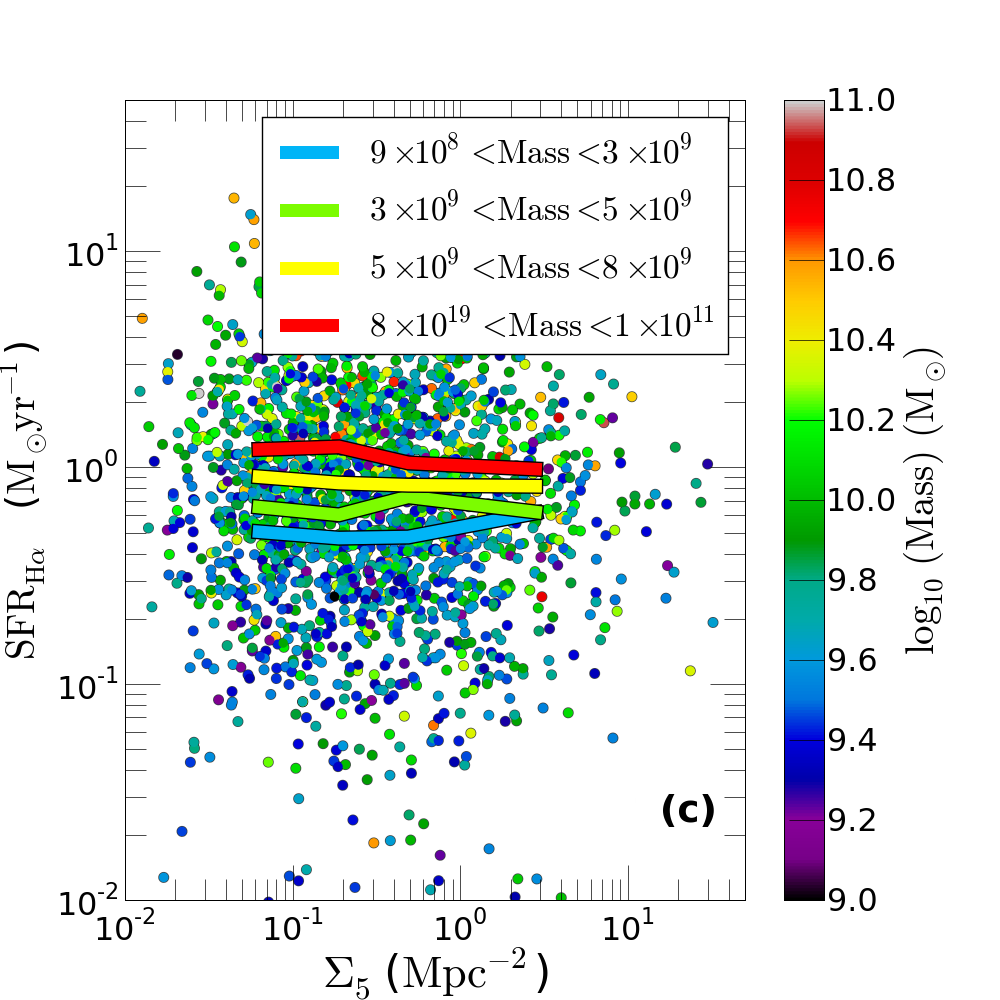
A comparable analysis exploring the relationship between SFR and EW against density as a function of stellar mass is used to investigate any dependencies between SFR and density (Figures 7 and 8). This analysis examines the consistency of the result obtained in Figures 5 and 6.
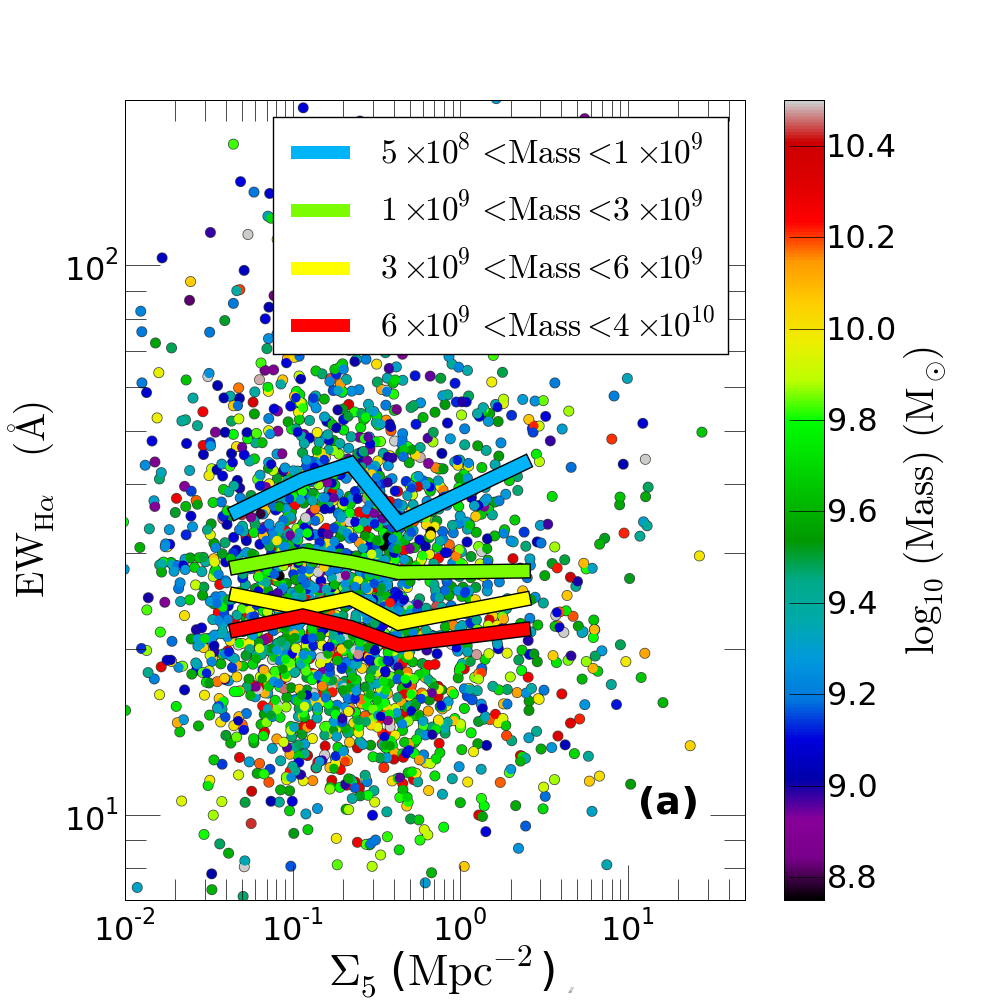
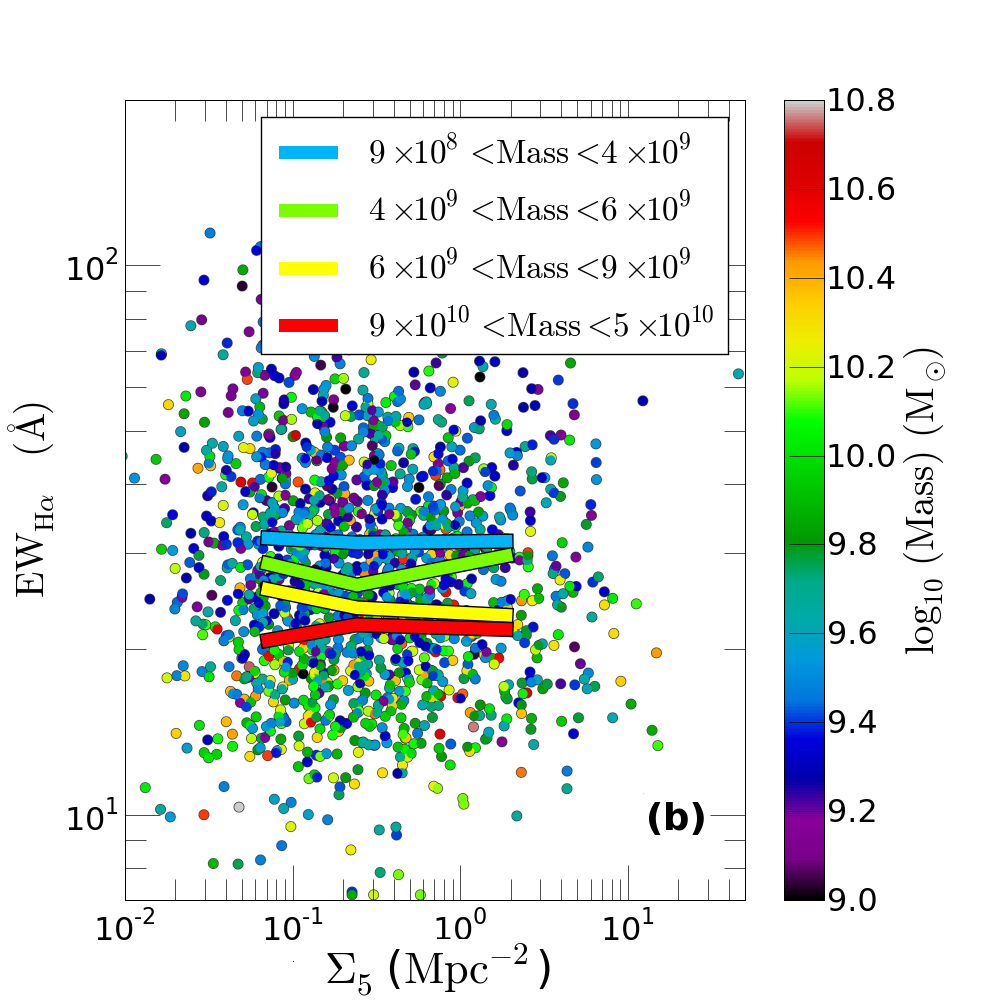
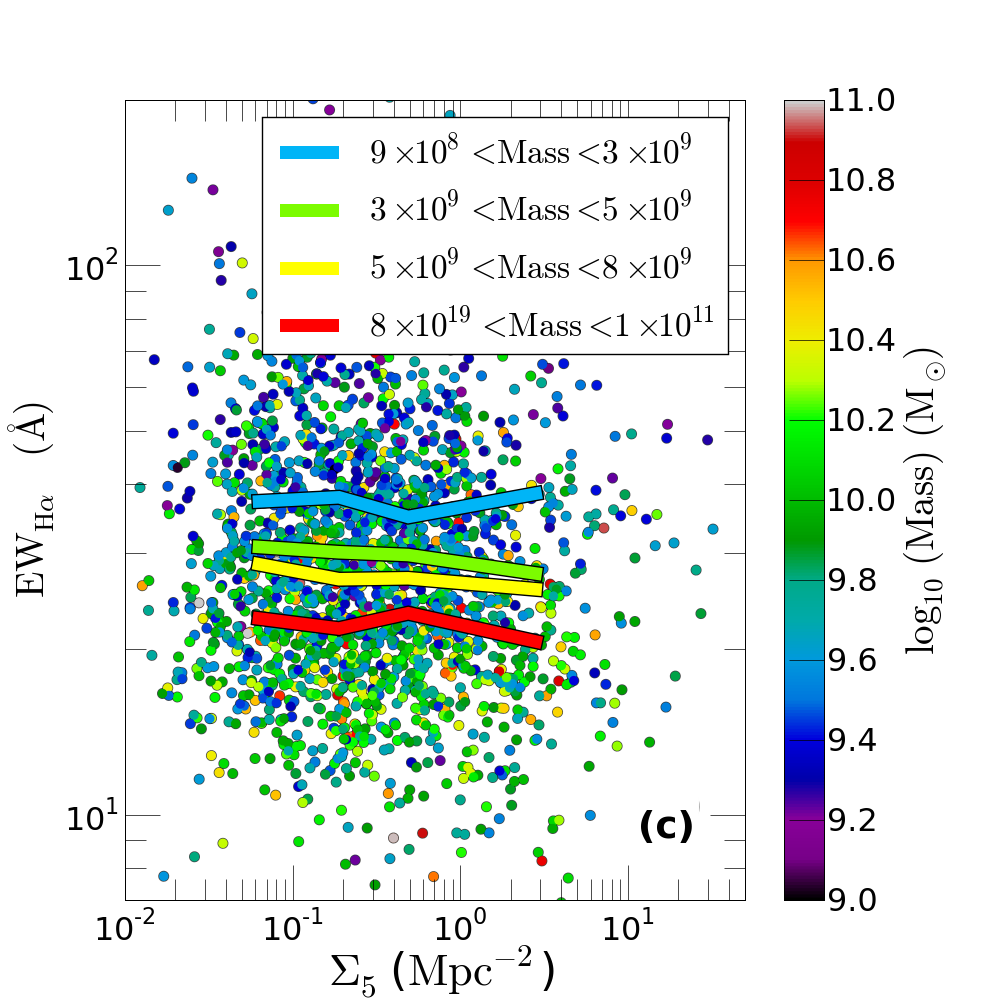
Strikingly, we see no relationship between EW and density (Figure 7) or SFR and density (Figure 8) for any given stellar mass. Again the relationship between SFR and stellar mass is is clearly visible from the separation of the median SFR lines for different stellar mass bins. The same is true for the EWs. This confirms the strong relationship observed between stellar mass and SFR (and mass and EW) in Figures 5 and 6. We also observe the expected increase in median SFR and EW for a given stellar mass range as we move to higher redshifts.
4.3 As a function of density
The final and next natural step is to investigate the relationship between stellar mass and SFR (and EW) within bins of density. Now that we have shown there is no relationship between density and SFR (or EW), a comparison between stellar mass and SFR highlights the strongest influence on SFR and EW. This also clarifies the absence of a relationship between density and SFR.
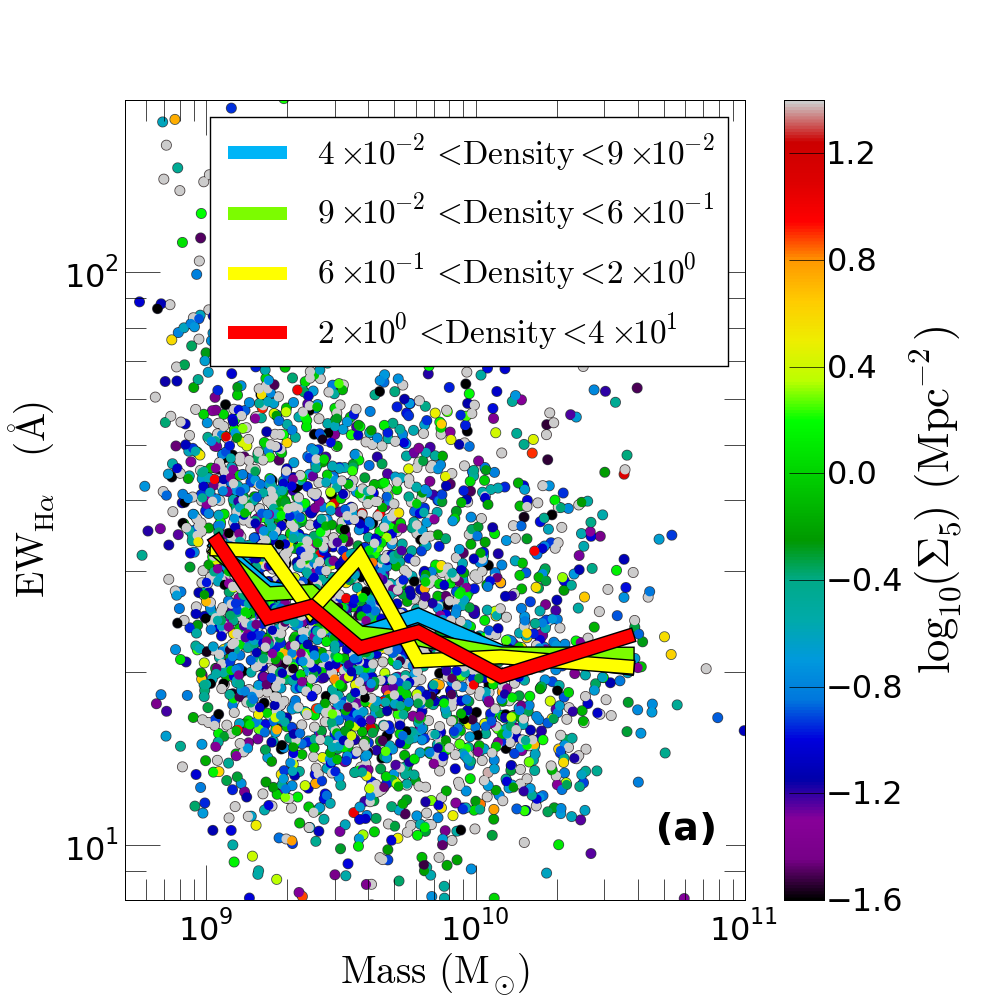
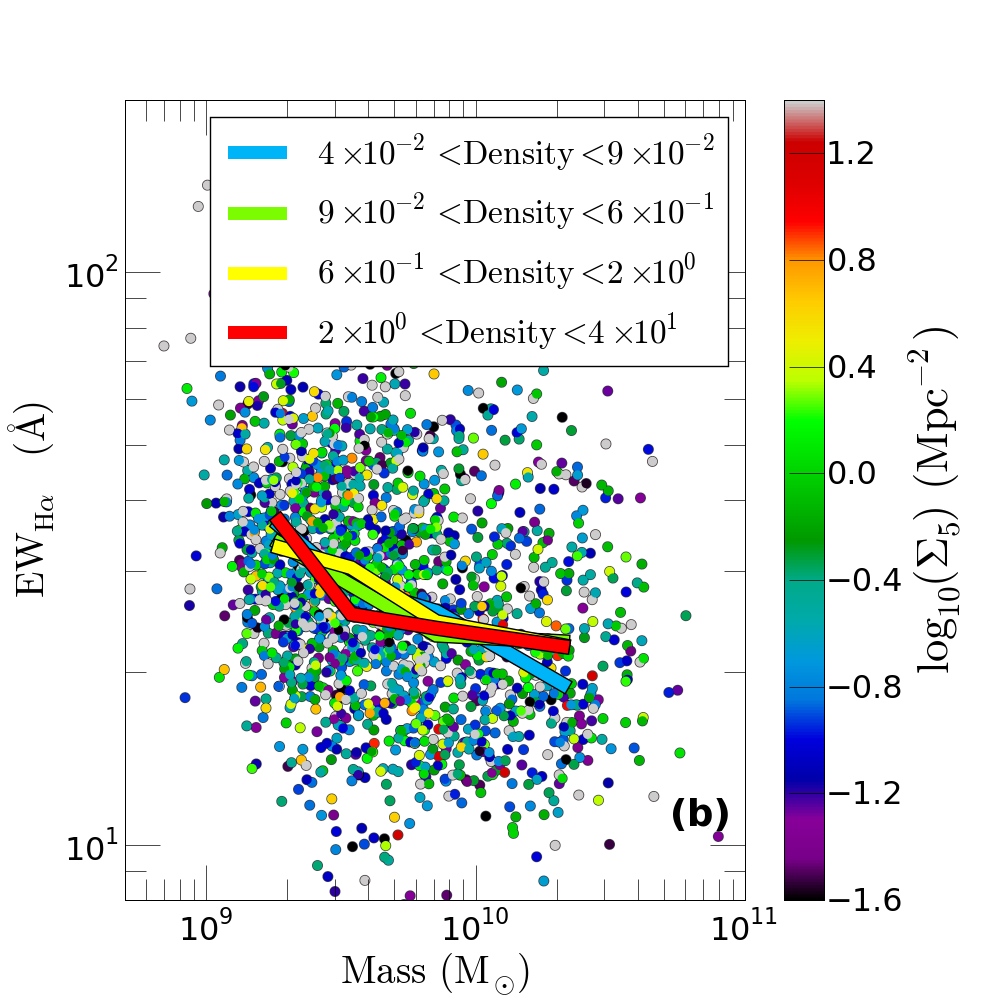
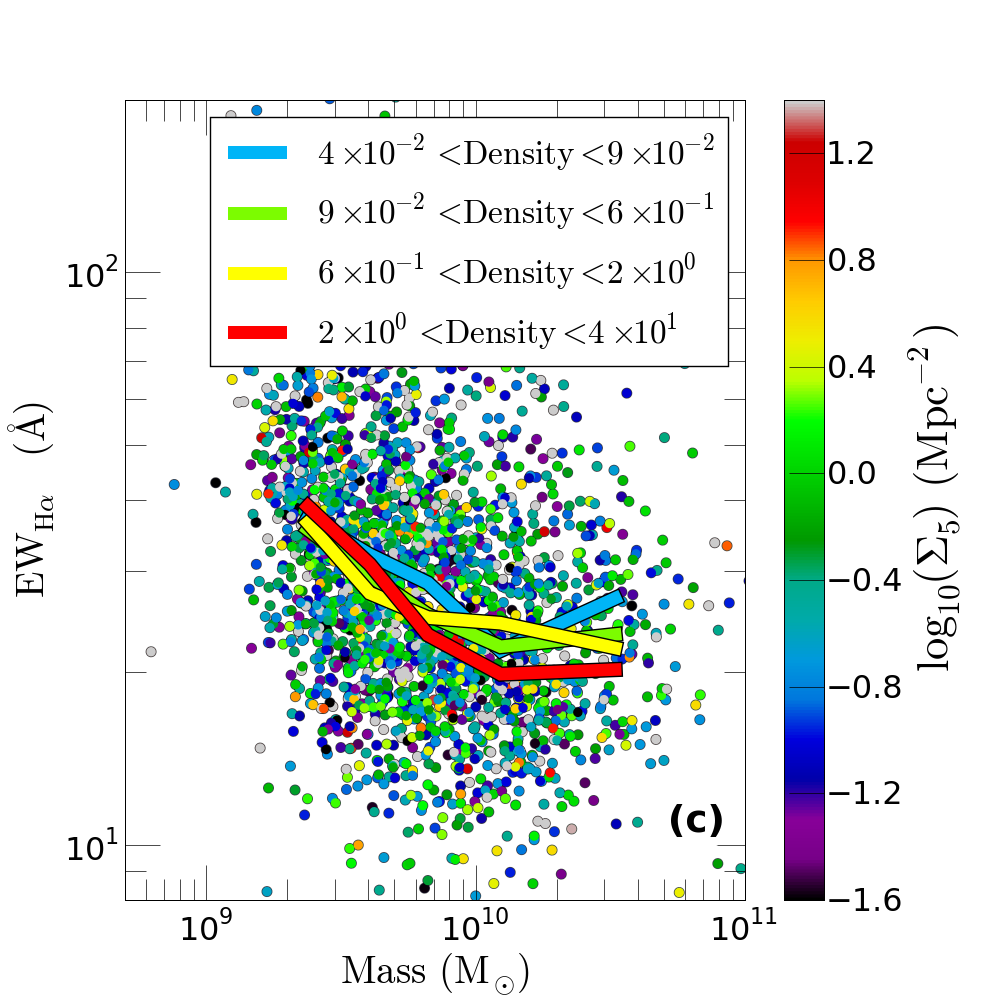
Figure 9 shows a strong dependence between EW and stellar mass, for all density bins in all volume-limited samples, where EW decreases with stellar mass for all densities. Figure 9 shows a reduction in EW from 40Å down to 20Å with increasing mass. There does not appear to be a separation between different density bins, highlighting the lack of relation between EW and density, agreeing with the observations made in Figure 7.
The same is true for SSFR, for which EW is a proxy. Specifically the SSFR trend with mass is not constant as suggested by Peng et al. (2010), but declines strongly as a function of stellar mass (see also Bauer et al., in prep). This difference arises since we are considering volume-limited samples in contrast to the apparent magnitude limited sample of Peng et al. (2010), and we are also more sensitive to the lower SFR population.
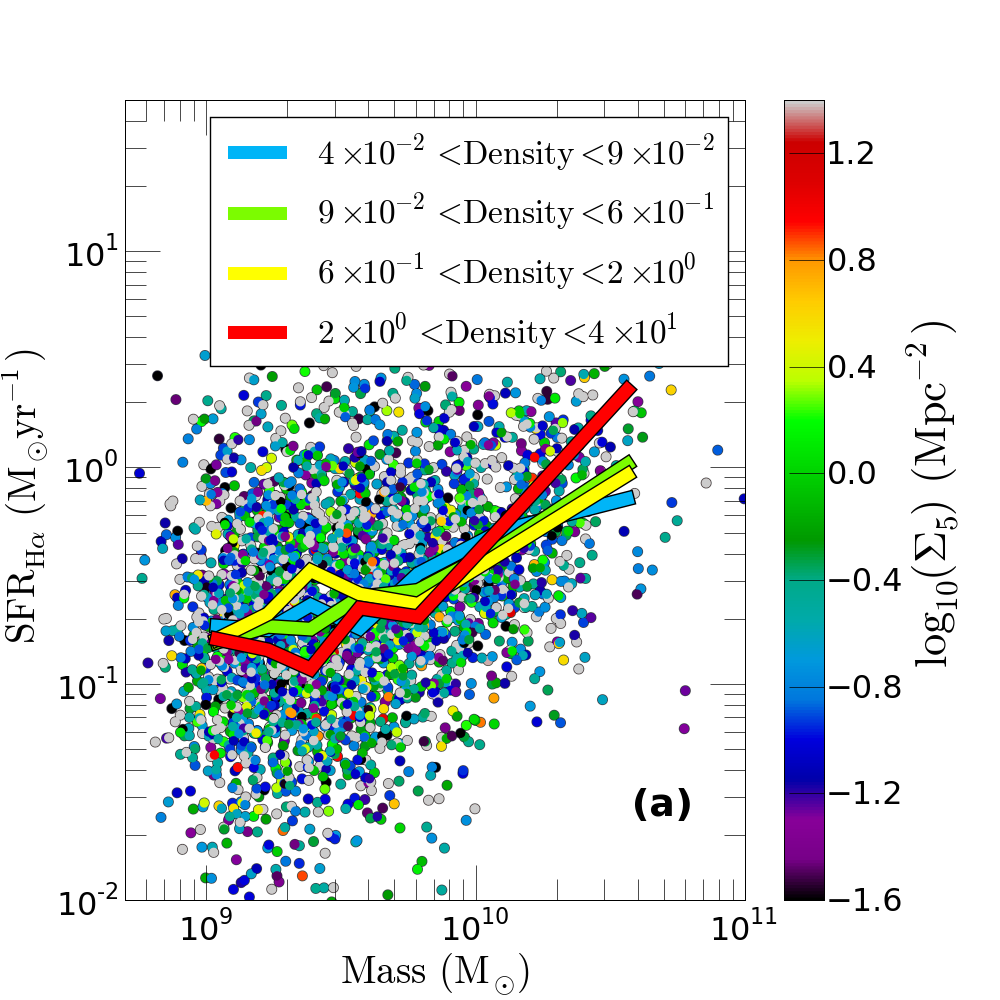
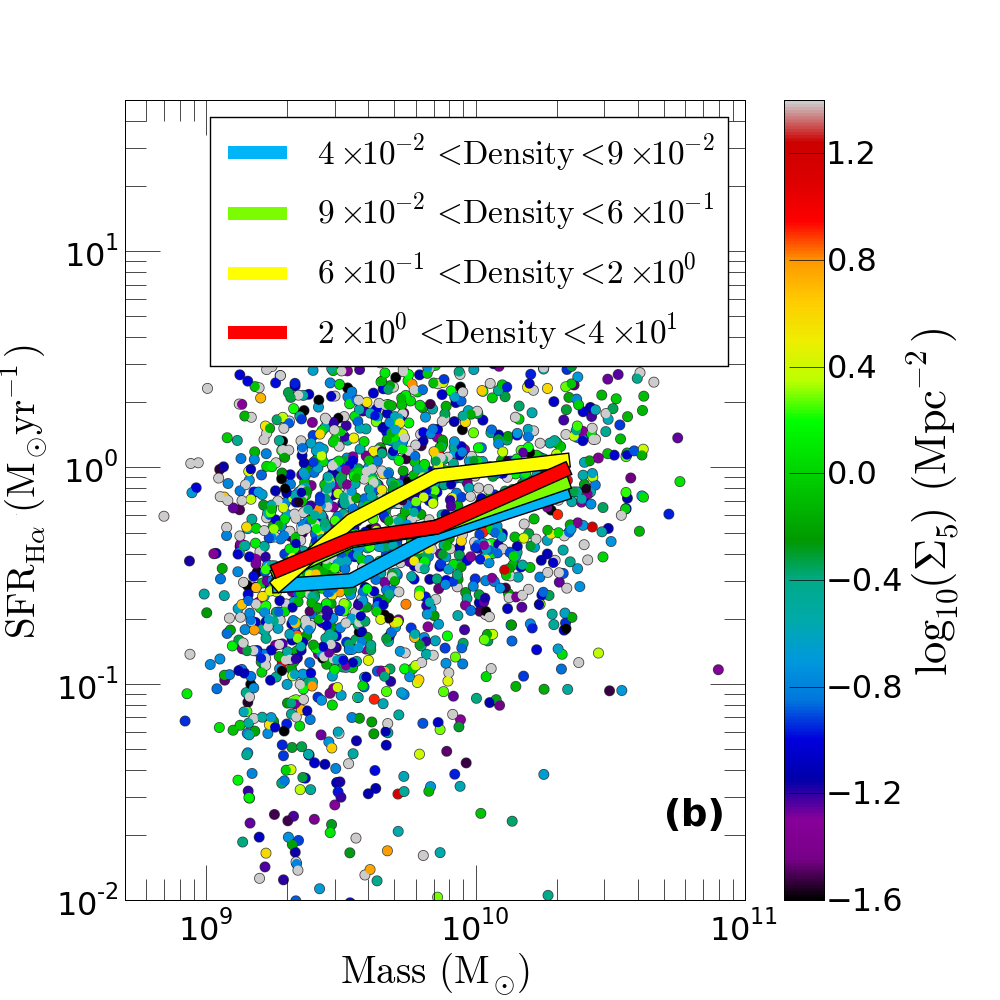
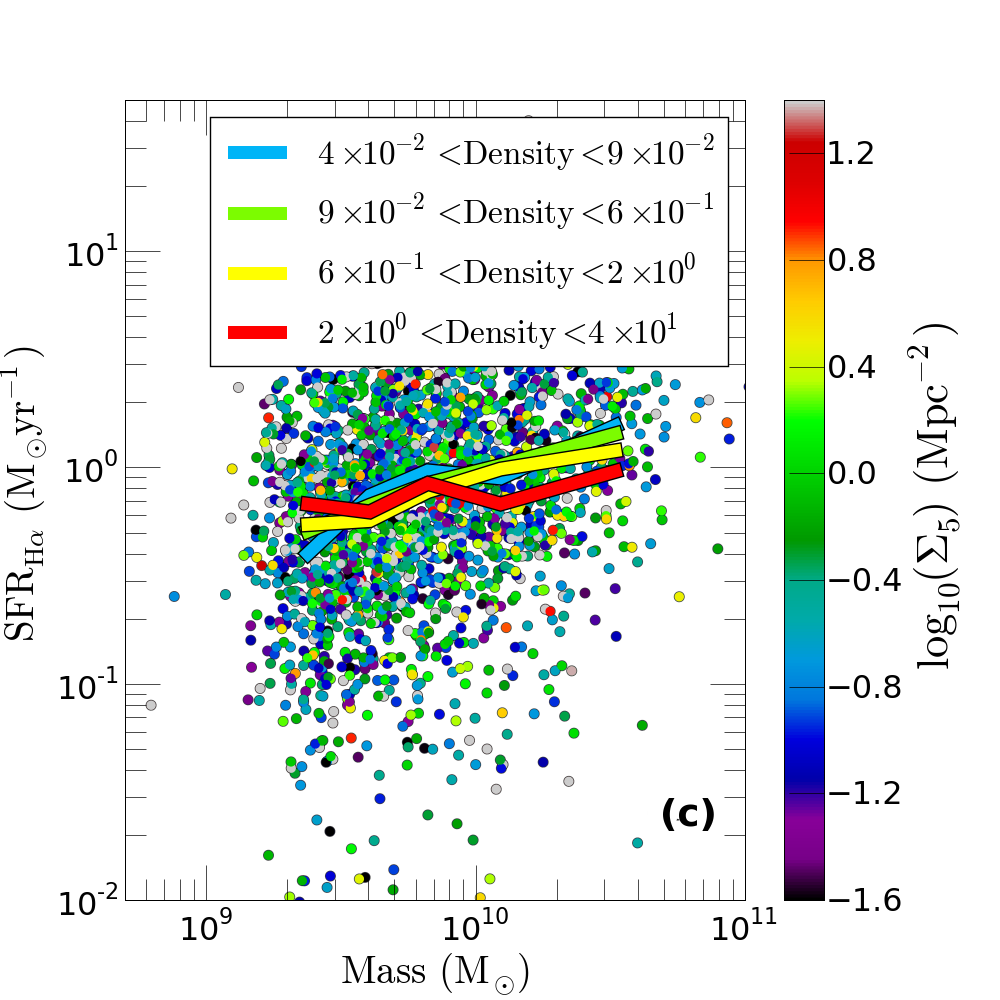
While EW and SSFR show a steady decline with increasing stellar mass, SFR increases with stellar mass (Figure 10). This observation concurs with the results of Figure 8. This figure is similar to Figure 1 of Peng et al. (2010), but demonstrates explicitly our sensitivity to lower SFR systems at a given mass, and the broadening distribution of SFR for lower stellar mass systems. As with EW, there does not appear to be a significant separation between the median SFR lines for each density bin. This indicates a relationship between stellar mass and SFR, but no significant relationship between SFR and density, as well as illustrating the absence of an EW-density relationship for the star-forming population.
Figures 9 and 10 clearly show that SFR and stellar mass are closely linked and that density appears to have a minimal impact on either of these properties, if any, for star-forming galaxies. It appears the -density result of Gómez et al. (2003) is a consequence of the passive galaxy population and is not observed in the star-forming population. Likewise, the SFR-density relation of the Gómez et al. (2003) analysis is also a result of the SFRs that are estimated for the whole population, including those for the passive systems. The significance of this is investigated in the next section, where the distribution of SFR is analysed as a function of density for the star-forming population.
5 SFR-Density Relation
We further analyze SFR as a function of density by quantifying the SFR distribution, using a range of percentiles. The density bins are constructed to ensure that each one contains at least 100 galaxies. If the final bin contains more than 20 galaxies it is considered to be an independent bin otherwise these galaxies are included in the preceding bin. For the calculation of the percentile we use bins of 250 galaxies with a minimum of 50 galaxies to form an independent bin for the final density bin. This is done to increase the reliability of this high percentile. We calculate , median, and percentiles for SFR for the three independent volume-limited samples (Figure 11) for the “star-forming” sample of galaxies.
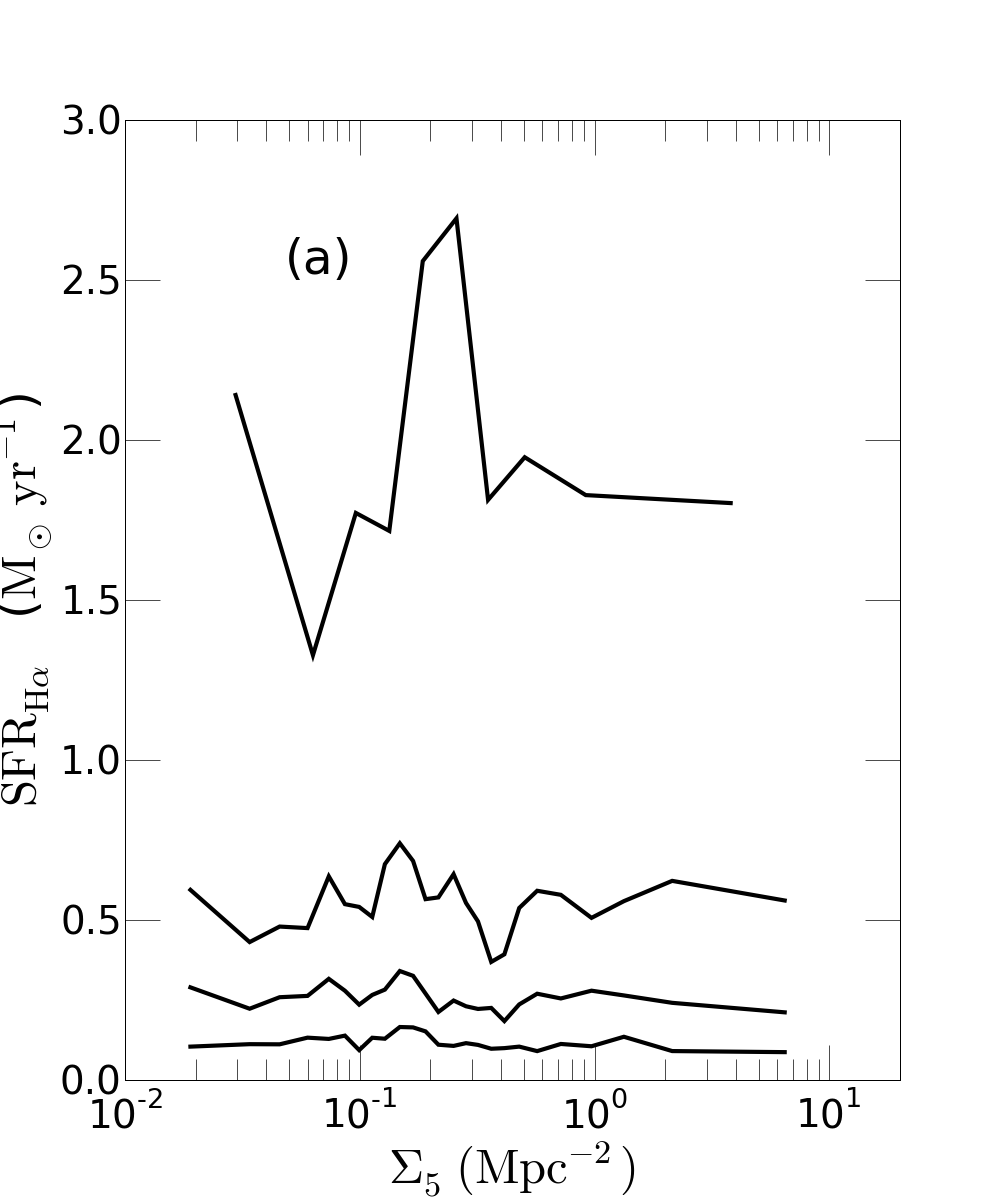
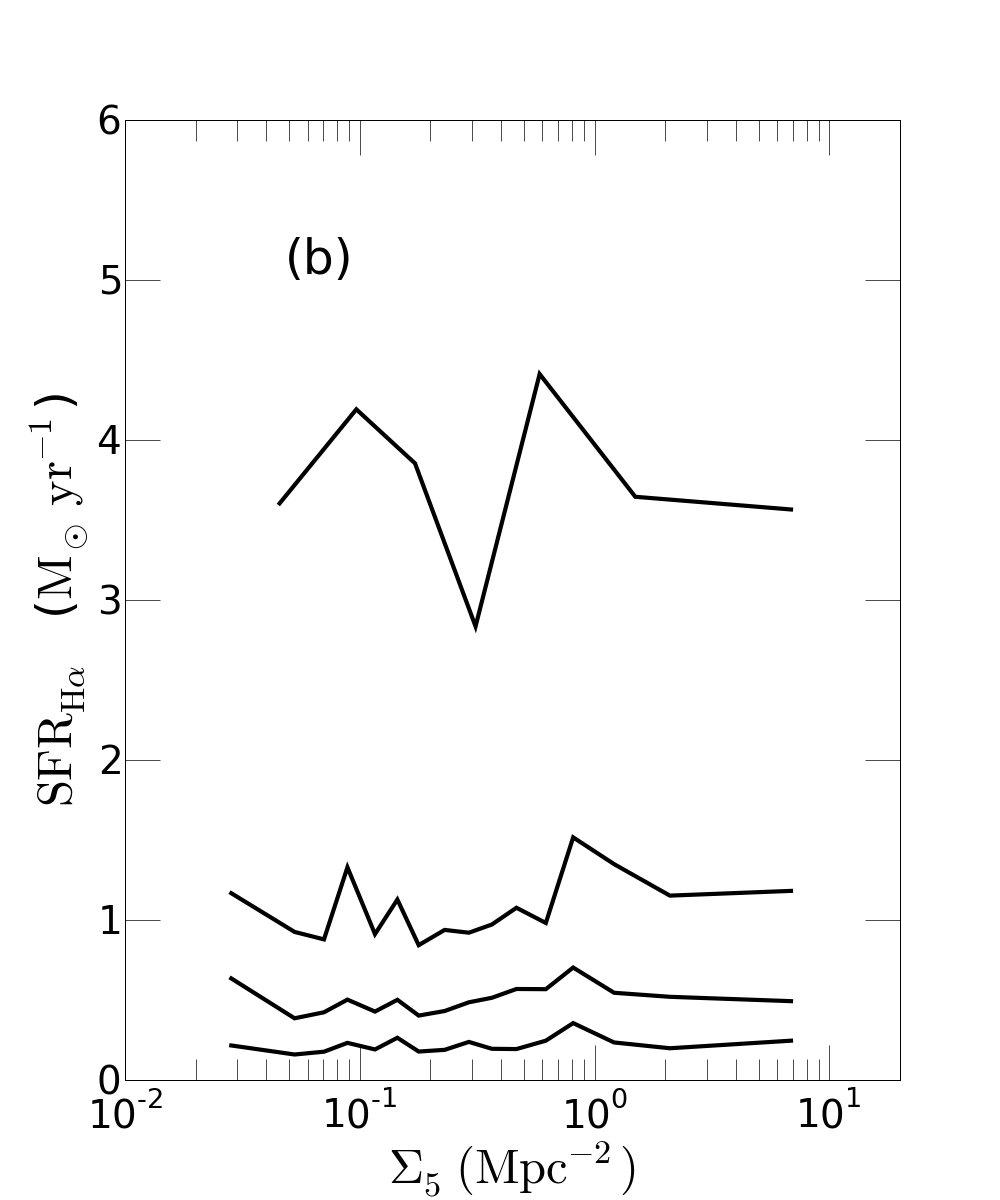
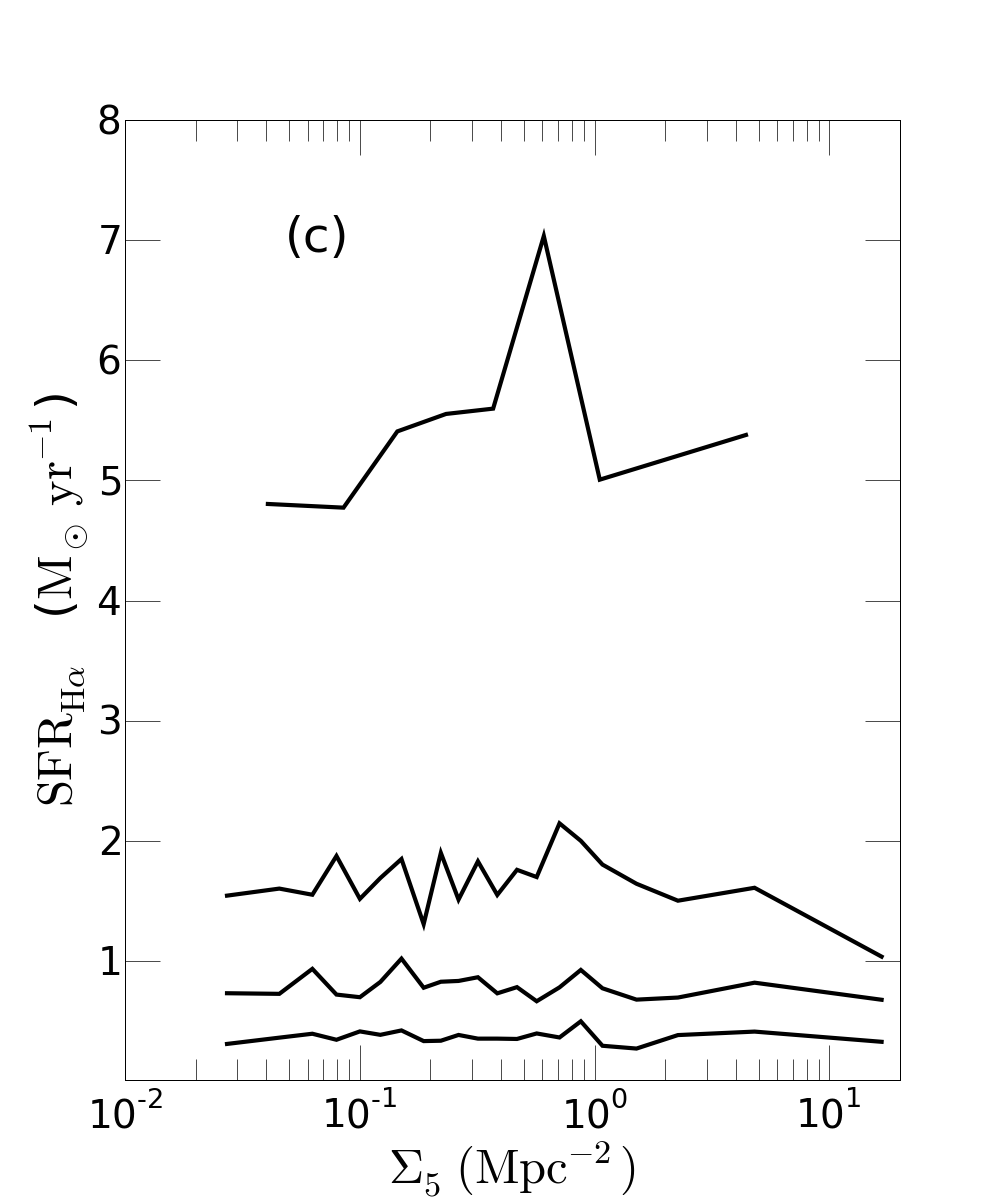
The change in the distribution of SFR is not nearly as significant as that observed for in the “full” sample (Figure 11). The SFR distribution, as quantified by these percentiles, remains unchanged even in the densest environments. Figure 11 shows no decline even in the percentile, where we sample the most extreme star-forming systems.
The change in the y-axis between the different panels in Figure 11 is mostly due to a selection effect: we are more likely to observe brighter, and hence more highly star-forming, galaxies at higher redshift. This is seen explicitly in the range of SFRs spanned by the different panels in Figure 11. The distribution of the SFRs shows no change as a function of density, however, at any redshift explored here.
The lack of a relationship between SFR and density here implies that if there is indeed suppression in galaxy SFRs in high density environments, it occurs too rapidly to be observed in our sample as a contraction in the distribution of SFRs for actively star-forming galaxies. Alternatively, galaxies may evolve predominantly in-situ, with their evolution being dominated by their mass, and any local environment being a second-order effect.
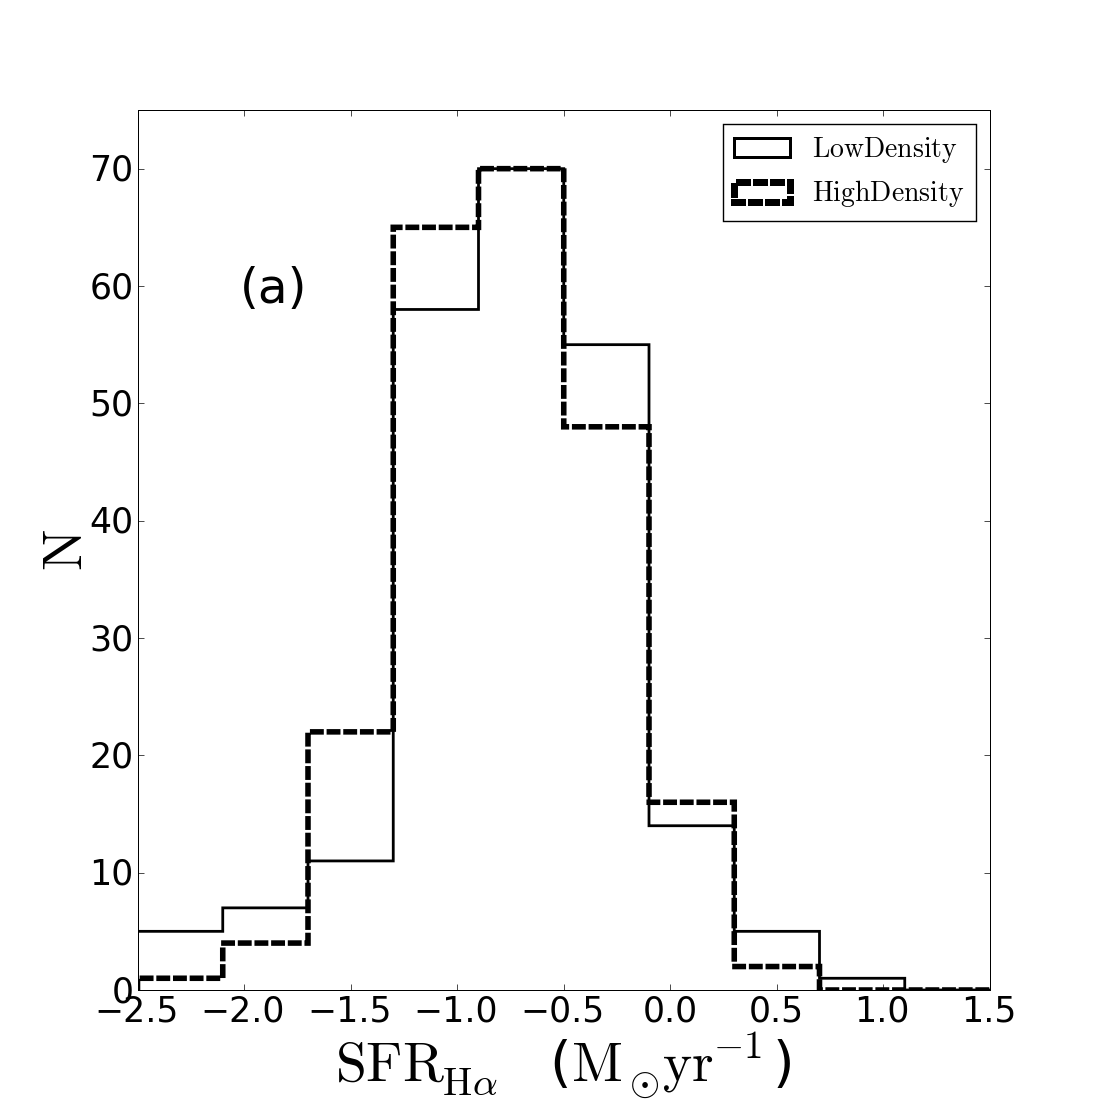
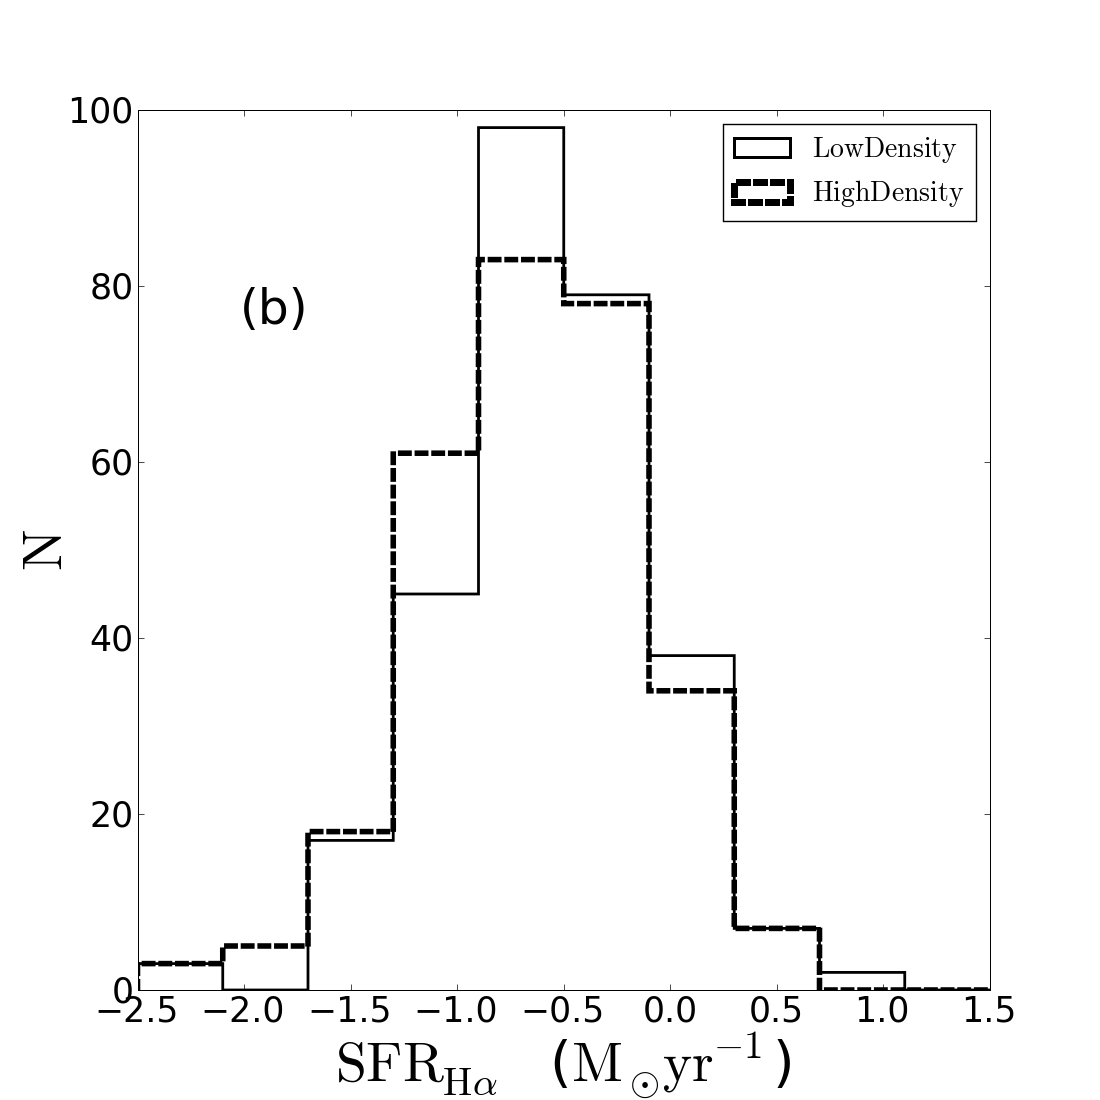
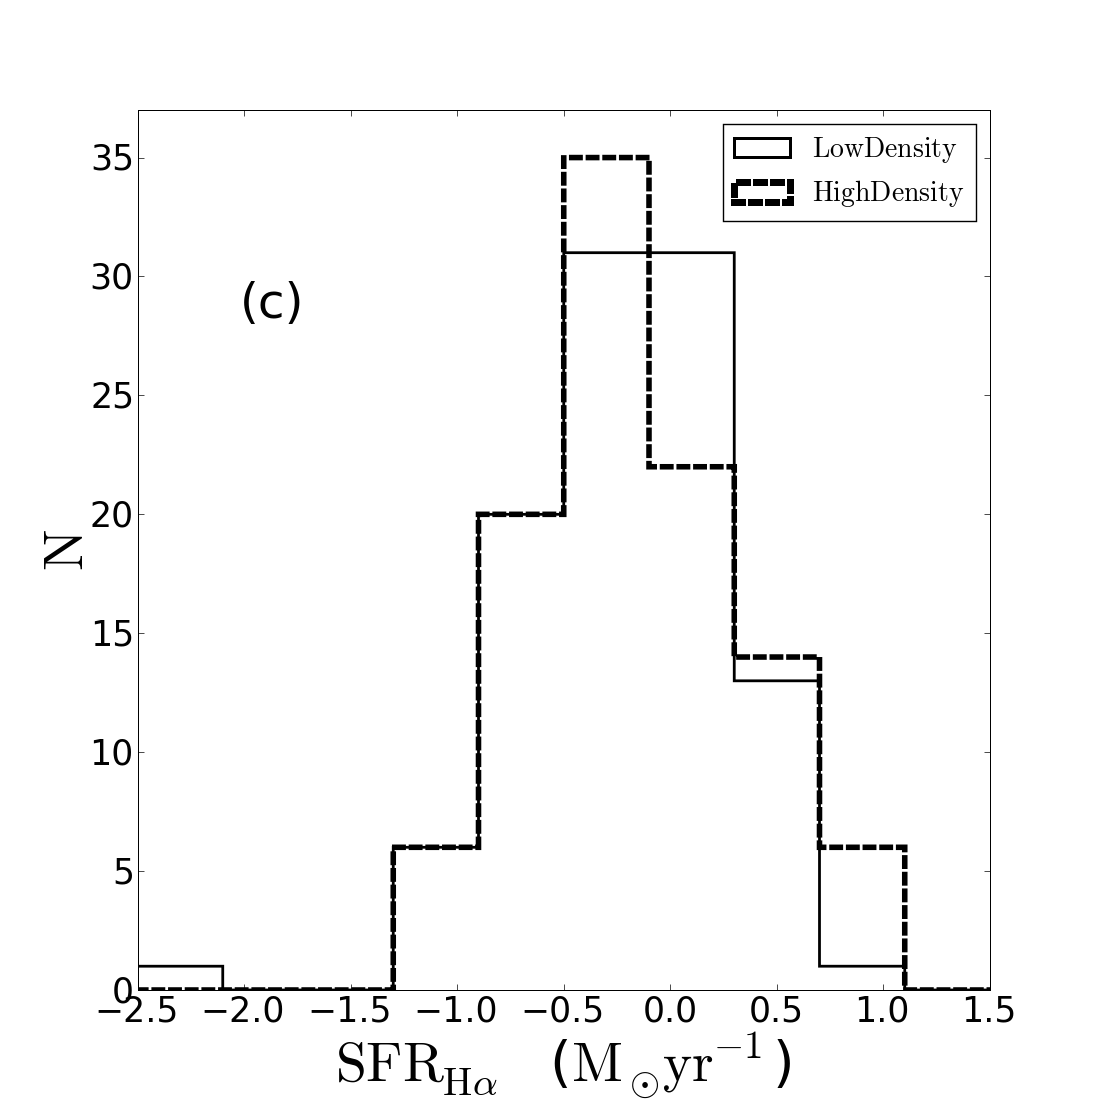
From the work of Wolf et al. (2009), Vulcani et al. (2010) Li et al. (2011) and von der Linden et al. (2010) we understand that there may be low SFR galaxies existing in cluster environments that may not be seen in the field. We explore this further in Figure 12 where we compare the SFR distributions in both the lowest and highest density quartiles for a range of mass bins.
We find that all three mass bins show that there is no difference in the SFR distribution for the high and low density bins. Kolmogorov-Smirnov (KS) tests carried out on this sample confirm this result with, low, mid and high mass bins showing KS statistics of 0.535, 0.307, and 0.576. These values need to be below 0.05 for the two density distributions to be classified as being selected from two different galaxy populations. While the results of Figure 12 are derived for one volume-limited sample (VL1) the other two volume-limited samples show similar results.
6 Morphology and Density
Morphology and density are related in the local universe such that early-type galaxies tend to dominate in dense environments, such as the center of clusters, and late-types are more prominent in low-density environments (e.g., Dressler, 1980). Gómez et al. (2003), using concentration index as a proxy for morphology, claim that the SFR-density relationship is not simply a consequence of this well-established morphology-density relationship, but that it holds within a given morphological type. We explore that result in more detail here.
We use the analysis of Lotz et al. (2004) and three morphological parameters, the concentration (C) (Conselice, 2003), Gini coefficient (G) and the brightest 20% of the 2nd moment of the flux (), to classify our samples into early and late-types.
Lotz et al. (2004) showed that galaxies with low concentration and Gini coefficient values and high values can be deemed to be late-type galaxies to a high probability. Galaxies with high concentration and Gini coefficient values and low values can be grouped as early-types. The values used to make these classifications are given in Table 4. It must be noted that these classifications are conservative, in that only galaxies obeying all criteria were classified as late or early, with many galaxies remaining unclassified. In this manner we can be confident that galaxies we call early or late are robustly classified as such.
| Early-type | Late-type |
|---|---|
We again look for variations between density and in both the full and “star-forming” samples using the 75th percentile, now looking at early and late-type galaxies. Figure 13 shows the results for the “full” sample for which we have 2909, 1885 and 2604 early-type galaxies and 723, 587 and 847 late-types for VL1, VL2 and VL3 respectively. For the “star-forming” sample there are 1089, 520 and 595 early-type galaxies and 545, 375 and 514 late-type galaxies. Early-type galaxies in the “full” sample show a strong relationship between and density. This contrasts with the equivalent relationship for the late-type galaxies, which has a much weaker trend between density and EW. This is true for all three volume-limited samples.


Furthermore, we see that it is the early-type galaxies that drive the morphology density relation for the “full” sample of galaxies with perhaps a minor contribution from the late-type galaxies. This is supported by the fact that at the highest densities, the median EW of early-type galaxies is near 10Å while late-types reach a minimum EW of about 30Å in the highest density bin. The reduction of EW in early-types for the “full” samples is as much as 70% while the late-types experience a maximum decrease in EW of 25%. The fact that the EW for the entire sample of galaxies (including early and late-types as in Figure 4) also approaches very low in the highest density bins demonstrates that the early-types are the main driver behind the reduction in both the as well as the SFR for the full samples as a function of density.
The “star-forming” sample (Figure 14), however, shows a weak or no relation between EW and density for either late or early-type star-forming galaxies, consistent with the results from the previous sections. Both these results add further weight to the earlier conclusion that it is the passive galaxy population that causes the observed trend between EW or SFR and density. This highlights that it is not just the passive galaxies but the passive early-type galaxies that are largely responsible for the trends found by Gómez et al. (2003) and Lewis et al. (2002).


7 Discussion
The comparison to the results of Gómez et al. (2003) when comparing EW with density is encouraging, with a remarkable similarity in the results from our sample for a comparable range at a slightly higher redshift. This result also gives confidence in our subsequent analysis.
Lewis et al. (2002) and Gómez et al. (2003) proposed that suppression of SFR in dense environments is due to a physical process occurring in these environments that exceeds the reduction in SFR due to the changing population mix. Our results demonstrate, in contrast and consistent with the work of Weinmann et al. (2010), Bolzonella et al. (2010) and Wetzel et al. (2011), that the reduction in the distribution of SFR in dense environments is primarily a consequence of the increasing proportion of passive galaxies. The absence of a trend between EW and density for the “star-forming” sample, visible in all three volume-limited samples, indicates that the galaxies that contribute to the EW-density trend in the “full” sample are the passive population.
We see no evidence for changes in the distribution of SFRs (within the “star-forming” population) as a function of density. There are no subsets of the population where a SFR-density relation is apparent. Combined with Figure 4 this indicates that the absence of the SFR-density relationship is purely a consequence of selecting a star-forming population of galaxies in agreement with Baldry et al. (2006) and McGee et al. (2011). A similar result was obtained by Doyle & Drinkwater (2006) who found that the SFR of late-type galaxies selected by neutral [Hi] gas content was not dependent on density.
Our final analysis focuses on the significance of galaxy morphologies on the SFR-density relationship. We show that early-type galaxies drive the EW-density and SFR-density relation to a far greater extent than late-type galaxies. The early-types show an EW-density and SFR-density relationship that resembles the result for the “full” sample very closely, indicating that the passive early-types are indeed the driver of the relationship observed by Gómez et al. (2003). This confirms that it is primarily the morphology-density relation that underpins the SFR-density relation, consistent with Baldry et al. (2006), Bolzonella et al. (2010), Thomas et al. (2010), Wetzel et al. (2011), Deng et al. (2011) and Lu et al. (2011) among others.
We can compare with the work of Wolf et al. (2009), Vulcani et al. (2010) and Li et al. (2011) through our analysis of the EW-density and SFR-density relation as a function of stellar mass, as shown in Figures 7 and 8. Von der Linden et al. (2010) and Li et al. (2011) observe a relation between SFR and density at low masses, Vulcani et al. (2010) observe such a relation across a range of masses and Wolf et al. (2009) observe the same relation at higher masses (but not for low mass galaxies). Figures 7 and 8 clearly show that we do not observe an SFR-density relation for star forming galaxies at any mass.
In Figure 12 we show that for any mass the SFR distribution is the same for both high and low density. If there was a low SFR population of galaxies in high densities not observed in the field then we would expect to see this as a tail to lower SFRs in the higher density samples. We do not observe such a scenario for our sample of galaxies.
We stress that the lack of a SFR-density relation in our analysis does not rule out the presence of SFR suppression in star-forming galaxies. Balogh et al. (2004), using galaxy colours, and McGee et al. (2011), using SSFRs, have also demonstrated a lack of an SFR-density relation. They both suggest that any suppression process must have a very short timescale. McGee et al. (2011) also proposes that infall and quench may be a viable candidate for this rapid suppression and that observations of “green valley” transition galaxies (McGee et al. 2009, Balogh et al. 2011) will aid in confirming the nature of the rapid SFR suppression processes.
There may also be some dependence on the environment metric used and there is work currently underway to investigate any effect arising through the use of different measures of environment (Muldrew et al. 2011, Brough et al. in prep.) such as group masses (Robotham et al., 2011; Grootes et al., 2011).
We note that Pasquali et al. (2009) and van den Bosch et al. (2008) have advanced similar arguments, relating to the distribution of SFR with density, based on slightly different analyses. In particular, these authors have argued in their analyses for the importance of distinguishing between satellite and central galaxies. In this context, we note that we find no evidence for density-dependent variations in the joint SFR-mass distribution, even without distinguishing between satellites and centrals. This raises the possibility that the satellite/central distinction is responsible for, or coincident with, the increasing fraction of passive and/or early-type galaxies for higher stellar masses and denser environments. There is also the possibility that we could be largely observing centrals, particularly at low surface densities, and if this is the case we may not expect to see environmental influences that would mainly act on satellite galaxies (e.g., ram pressure stripping). Further detailed study of the relation between these results may be fruitful.
The question now becomes whether star-forming galaxies entering dense environments are quenched rapidly enough that we do not see any population in a low-SFR state (the “infall-and-quench” model), or whether the morphology-density relation arises through density-dependent evolution, an “in-situ evolution” model, with similarities to the “mass quenching” model of Peng et al. (2010). Such an “in-situ” model would be a modification to the “downsizing by mass” paradigm (Cowie et al., 1996) or the “staged evolution” paradigm (Noeske et al., 2007). In this variation, galaxies in dense environments would evolve faster than galaxies in low-density environments, building their stellar mass faster and earlier, leading to the observed morphology-density relation, and consistent with the measured SFR-density relations at both low and high redshift.
This “in-situ” evolution differs from the “mass-quenching” versus “environmental quenching” model of Peng et al. (2010), as galaxies of common mass would evolve differently in different environments, in order to give rise to the observed population mix. In particular, the different star-forming fraction at a given mass as a function of density is a more natural outcome of the “in-situ” model model.
8 Conclusion
We have carried out an analysis of the impact of galaxy environments and stellar mass on SFR and EW for three volume-limited samples from the GAMA survey out to . The galaxies populate both field and cluster environments, and encompass star-forming and passive, early and late galaxy types. We investigate the relation between SFR as well as and environment, initially to confirm the trends shown by Gómez et al. (2003). Subsequently we incorporate stellar mass to understand the lack of any trend between SFR or and density for the star-forming population. The absence of a trend implies the possibility of two evolutionary trends where either the galaxies undergo “in-situ” evolution (Baldry et al. 2004, Balogh et al. 2004) or the galaxies do “infall” and are subsequently quenched within a short period of time, particularly for low-mass galaxies (Bolzonella et al. 2010, Wetzel et al. 2011, Weinmann et al. 2010).
We show that there is no strong effect due to density on galaxy SFRs for the star-forming population. Furthermore, we show that SFR is largely dependent on stellar mass rather than density, for a variety of samples binned according to stellar mass, density, SFR and EW. The investigation into morphology clearly shows that it is the increasing fraction of passive early-type galaxies that are the largest contributor to the suppression in SFR at high densities. In contrast, the distribution of SFRs for star-forming galaxies shows no change with density, and no evidence for a physical suppression in dense environments. The combination of these facts forces us to conclude that the SFR-density relation that we observe for galaxies as a whole is largely due to the proportion of passive early-type galaxies present in the clusters, as opposed to some physical process acting on star-forming galaxies to suppress their SFRs as they enter a cluster. Such processes clearly occur, and have been observed to affect individual systems in nearby clusters, but they may not be a dominant effect in governing galaxy evolution.
A similar result was found by Balogh et al. (2004) where they identified that while there is strong and continuous variation between the relative numbers for quiescent and star-forming galaxies there is little correlation between the distribution of SFRs and density for star-forming galaxies. Balogh et al. (2004) also uses the nearest neighbour (as well as a three-dimensional density estimator) as a measure of density and the as a measure of star-forming activity. Recent work by Peng et al. (2010) also shows that the SFR is primarily dependent on the mass of galaxies and any evolutionary effects are secondary.
There are several key issues that remain unresolved. This includes in particular whether the timescales on which star-formation can be suppressed by the commonly proposed mechanisms of in-fall and quench, harassment, or ram-pressure stripping, are short enough that they remain a viable explanation to support an “infall-and-quench” model for the morphology-density relation. Balogh et al. (2004); Bamford et al. (2008) and Nichols & Bland-Hawthorn (2011) have argued that this is a viable explanation for the observed suppression of SFR. An alternative scenario, which deserves further investigation is a model of “in-situ” evolution where the passive early-types may have evolved early and rapidly within the dense environments, while star-forming galaxies evolve more slowly in the field. This model is not dissimilar to the “staged evolution” model of Noeske et al. (2007), although it invokes a density-dependence on the timescale of the evolution in addition to the mass-dependence. We plan to explore such a model in more detail in future work.
Acknowledgments
The authors would like to thank the referee for the insightful comments that were provided, putting the paper in a broader and a more relevant context. D.B.W acknowledges the support provided by the University of Sydney Postgraduate Award. PN acknowledges a Royal Society URF and an ERC StG grant (DEGAS-259586). GAMA is a joint European-Australasian project based around a spectroscopic campaign using the Anglo-Australian Telescope. The GAMA input catalogue is based on data taken from the Sloan Digital Sky Survey and the UKIRT Infrared Deep Sky Survey. Complementary imaging of the GAMA regions is being obtained by a number of independent survey programs including GALEX MIS, VST KIDS, VISTA VIKING, WISE, Herschel-ATLAS, GMRT and ASKAP providing UV to radio coverage. GAMA is funded by the STFC (UK), the ARC (Australia), the AAO, and the participating institutions. The GAMA website is http://www.gama-survey.org/ .
References
- Baldry et al. (2004) Baldry, I. K., Glazebrook, K., Brinkmann, J., Ivezić, Ž., Lupton, R. H., Nichol, R. C., Szalay, A. S., 2004, ApJ, 00, 681
- Baldry et al. (2009) Baldry, I. K., Robotham, A. S. G., Hill, D. T., Driver, S. P., Liske, fJ., Norberg, P., Bamford, S. P., Hopkins, A. M., Loveday, J., Peacock, J. A., 2009. MNRAS, submitted
- Balogh et al. (1997) Balogh, M. L., Morris, S. L., Yee, H. K. C., Carlberg, R. G., Ellingson, E., 1997, ApJ, 488L, 75
- Balogh et al. (2004) Balogh, M., Eke, V., Miller, C., Lewis, I., Bower, R., Couch, W., Nichol, R., Bland-Hawthorn, J., Baldry, I. K., Baugh, C., and 27 coauthors, 2004, MNRAS, 348, 1355
- Bamford et al. (2008) Bamford, S. P., Rojas, A. L., Nichol, R. C., Miller, C. J., Wasserman, L., Genovese, C. R., Freeman, P. E., 2008, MNRAS, 391, 607
- Bamford et al. (2009) Bamford, S. P., Nichol, R. C., Baldry, I. K., Land, K., Lintott, C. J., Schawinski, K., Slosar, A., Szalay, A. S., Thomas, D., Torki, M., and 6 coauthors, 2009, MNRAS, 393, 1324
- Barnes (1992) Barnes, J. E., 1992, ApJ, 393, 484
- Bekki, Couch & Shioya (2001) Bekki, K., Couch, W. J., Shioya, Y., 2001, PASJ, 53. 395
- Bekki, Couch & Shioya (2002) Bekki, K., Couch, W. J., Shioya, Y., 2002, ApJ, 577, 651
- Bekki (2009) Bekki, K., 2009, MNRAS, 399, 2221
- Blanton et al. (2003) Blanton, M. R., Brinkmann, J., Csabai, I, Doi, M., Eisenstein, D., Fukugita, M., Gunn, J. E., Hogg, D. W., Schlegel, D. J., 2003, AJ, 125, 2348
- Bolzonella et al. (2010) Bolzonella, M., Kovac̆, K., Pozzetti, L., Zucca, E., Cucciati, O., Lilly, S. J., Peng, Y., Iovino, A., Zamorani, G., Vergani, D., and 56 coauthors, 2010, A&A, 524A, 76
- Brough et al. (2011) Brough, S., Hopkins, A. M., Sharp, R. G., Gunawardhana, M., Wijesinghe, D., Robotham, A. S. G., Driver, S. P., Baldry, I. K., Bamford, S. P., Liske, J., and 23 coauthors, 2011, MNRAS, 413, 1236
- Butcher & Oemler (1978) Butcher, H., Oemler, A. Jr., 1978, ApJ, 226, 559
- Butcher & Oemler (1984) Butcher, H., Oemler, A. Jr., 1984, ApJ, 285, 426
- Byrd & Valtonen (1990) Byrd, G., Valtonen, M., 1990, ApJ, 350, 89
- Bruzual & Charlot (2003) Bruzual, G., & Charlot, S., 2003, MNRAS, 344, 1000
- Calzetti et al. (2001) Calzetti, D., 2001, PASP, 113, 1449
- Chabrier (2003) Chabrier, G., 2003, ApJ, 586L, 133
- Cole et al. (1994) Cole, S., Aragon-Salamanca, A., Frenk, C. S., Navarro, J. F., Zepf, S. E., 1994, MNRAS, 271, 781
- Cole et al. (2000) Cole, S., Lacey, C. G., Baugh, C. M., Frenk, C. S., 2000, MNRAS, 319, 168
- Conselice (2003) Conselice, C.J. 2003, ApJS, 147, 1
- Couch et al. (2001) Couch, W. J., Balogh, M. L., Bower, R. G., Smail, I., Glazebrook, K., Taylor, M., 2001, ApJ, 549, 820
- Cowie et al. (1996) Cowie, L. L., Songaila, A., Hu, E. M., Cohen, J. G, 1996, AJ, 112, 839
- Deng et al. (2011) Deng, X., Chen, Y., Jiang, P., 2011, MNRAS, 417, 453
- Doyle & Drinkwater (2006) Doyle, M. T., Drinkwater, M. J., 2006, MNRAS, 372, 977
- Dressler (1980) Dressler, A., 1980, ApJ, 236, 351
- Dressler & Gunn (1983) Dressler, A., Gunn, J. E., 1983, ApJ, 270, 7
- Driver et al. (2009) Driver, S. P., Popescu, C. C., Tuffs, R. J., Liske, J., Graham, A. W., Allen, P. D., De Propris, R., 2007, MNRAS, 379, 1022
- Driver et al. (2009) Driver, S. P., Norberg, P., Baldry, I. K., Bamford, S. P., Hopkins, A. M., Liske, J., Loveday, J., Peacock, J. A., Hill, D. T., Kelvin, L. S., 2009, A&G, 50e, 12
- Driver et al. (2011) Driver, S. P., Hill, D. T., Kelvin, L. S., Robotham, A. S. G., Liske, J., Norberg, P., Baldry, I. K., Bamford, S. P., Hopkins, A. M., Loveday, J., and 45 coauthors, 2011, MNRAS, 413, 971
- Elbaz et al. (2007) Elbaz, D., Daddi, E., Le Borgne, D., Dickinson, M., Alexander, D. M., Chary, R.-R., Starck, J.-L., Brandt, W. N., Kitzbichler, M., MacDonald, E., and 4 coauthors, 2007, A&A, 468, 33
- Gavazzi & Jaffe (1985) Gavazzi, G., Jaffe, W., 1985, ApJ, 294L, 89
- Gavazzi (1998) Gavazzi, G., Catinella, B., Carrasco, L., Boselli, A., Contursi, A., 1998AJ, 115, 1745
- Gómez et al. (2003) Gómez, P. L., Nichol, R. C., Miller, C J., Balogh, M. L., Goto, T., Zabludoff, A. I., Romer, A. K., Bernardi, M., Sheth, R., Hopkins, A. M., and 7 co-authors 2003, ApJ, 584, 210
- Grützbauch et al. (2011a) Grützbauch, R., Conselice, C. J., Varela, J., Bundy, K., Cooper, M. C., Skibba, R., Willmer, C. N. A., 2011, MNRAS, 411, 929
- Grützbauch et al. (2011b) Gr tzbauch, R., Conselice, C. J., Bauer, A. E., Bluck, A. F. L., Chuter, R. W., Buitrago, F., Mortlock, A., Weinzirl, T., Jogee, S., 2011, MNRAS, tmp, 1504
- Grootes et al. (2011) Grootes et al. 2011, ”The Spectral Energy Distribution of Galaxies, Proceedings IAU Symposium No. 284, 2011, Tuffs, R.J., & Popescu, C.C., eds.”
- Gunawardhana et al. (2011) Gunawardhana, M. L. P.; Hopkins, A. M.; Sharp, R. G.; Brough, S.; Taylor, E.; Bland-Hawthorn, J.; Maraston, C.; Tuffs, R. J.; Popescu, C. C.; Wijesinghe, D. and 28 coauthors, 2011, MNRAS, 415, 1647
- Gunn & Gott (1972) Gunn, J. E., Gott, J. R. III, 1972, ApJ, 176, 1
- Hashimoto et al. (1998) Hashimoto, Y., Oemler, A. Jr., Lin, H., Tucker, D. L., 1998, ApJ, 499, 589
- Hopkins et al. (2001) Hopkins, A. M., Connolly, A. J., Haarsma, D. B., Cram, L. E., 2001, AJ, 122, 288
- Kauffmann, White & Guiderdoni (1993) Kauffmann, G., White, S. D. M., Guiderdoni, B., 1993, MNRAS, 264, 201
- Kewley (2006) Kewley, L. J., 2006, AAS, 20923601
- Larson & Tinsley (1978) Larson, R. B., & Tinsley, B. M., 1978, ApJ, 219, 46
- Lavery & Henry (1988) Lavery, R. J., Henry, J. P., 1988, ApJ, 330, 596
- Larson, Tinsley & Caldwell (1980) Larson, R. B., Tinsley, B. M., Caldwell, C. N., 1980, ApJ, 237, 692
- Lewis et al. (2002) Lewis, I., Balogh, M., De Propris, R., Couch, W., Bower, R., Offer, A., Bland-Hawthorn, J., Baldry, I. K., Baugh, C., Bridges, T., and 23 co-authors, 2002, MNRAS, 334, 673
- Li et al. (2011) Li, I. H., Glazebrook, K., Gilbank, D., Balogh, M., Bower, R., Baldry, I., Davies, G., Hau, G., McCarthy, P., 2011, MNRAS, 411, 1869
- Lotz et al. (2004) Lotz, J. M., Primack, Joel, Madau, P., 2004, AJ, 128, 163
- Lu et al. (2011) Lu, T., Gilbank, D., McGee, S., Balogh, M., Gallagher, S., MNRAS (in-press; arXiv:1110.3336)
- Mateus & Sodré (2004) Mateus, A., Sodré, L., 2004, MNRAS, 349, 1251
- Moore et al. (1996) Moore, B., Katz, N., Lake, G., Dressler, A., Oemler, A., 1996, Natur, 379, 613
- Moss & Whittle (1993) Moss, C., Whittle, M., 1993, ApJ, 407L, 17
- Moss & Whittle (2000) Moss, C., Whittle, M., 2000, MNRAS, 317, 667
- Nichols & Bland-Hawthorn (2011) Nichols, M., & Bland-Hawthorn, J., 2011, ApJ, 732, 17
- Noeske et al. (2007) Noeske, K. G., Weiner, B. J., Faber, S. M., Papovich, C., Koo, D. C., Somerville, R. S., Bundy, K., Conselice, C. J., Newman, J. A., Schiminovich, D., 2007, ApJ, 660L, 43
- Pasquali et al. (2009) Pasquali, A., van den Bosch, Frank C., Mo, H. J., Yang, X., Somerville, R., MNRAS, 2009, 394, 38
- Peng et al. (2010) Peng, Y., Lilly, S. J., Kovac̆, K., Bolzonella, M., Pozzetti, L., Renzini, A., Zamorani, G., Ilbert, O., Knobel, C., Iovino, A., and 54 coauthors, 2010, ApJ, 721, 193
- Pimbblet et al. (2006) Pimbblet, K. A., Smail, I., Edge, A. C., O’Hely, E., Couch, W. J., Zabludoff, A. I., 2006, MNRAS, 366, 645
- Poggianti et al. (1999) Poggianti, B. M., Smail, I., Dressler, A., Couch, W. J., Barger, A. J., Butcher, H., Ellis, R. S., Oemler, A., Jr., 1999, ApJ, 518, 576
- Porter et al. (2008) Porter, S. C., Raychaudhury, S., Pimbblet, K. A., Drinkwater, M. J., 2008, MNRAS, 388, 1152
- Prescott et al. (2011) Prescott, M., Baldry, I. K., James, P. A., Bamford, S. P., Bland-Hawthorn, J., Brough, S., Brown, M. J. I., Cameron, E., Conselice, C. J., Croom, S. M., and 24 coauthors, 2011, MNRAS, 417, 1374
- Quilis, Moore, & Bower (2000) Quilis, V., Moore, B., Bower, R., 2000, Sci, 288, 1617
- Robotham et al. (2009) Robotham, A., Driver, S. P., Norberg, P., Baldry, I. K., Bamford, S. P., Hopkins, A. M., Liske, J., Loveday, J., Peacock, J. A., Cameron, E., 2010, PASA, submitted
- Robotham et al. (2011) Robotham, A. S. G., Norberg, P., Driver, S. P., Baldry, I. K., Bamford, S. P., Hopkins, A. M., Liske, J., Loveday, J., Merson, A., Peacock, J. A., and 23 coauthors, 2011, MNRAS, 416, 2640
- Rowlands et al. (2011) Rowlands, K., Dunne, L., Maddox, S., Bourne, N., Gomez, H. L., Kaviraj, S., Bamford, S. P., Brough, S., Charlot, S., da Cunha, E., and 31 coauthors, 2011, arXiv1109.6274
- Sharp et al. (2006) Sharp, R., Saunders, W., Smith, G., Churilov, V., Correll, D., Dawson, J., Farrel, T., Frost, G., Haynes, R., Heald, R., 2006, SPIE, 6269E, 14
- Taylor et al. (2011) Taylor, E. N., Franx, M., Glazebrook, K., Brinchmann, J., van der Wel, A., van Dokkum, P. G., 2011, ApJ, submitted
- Thomas et al. (2010) Thomas, D., Maraston, C., Schawinski, K., Sarzi, M., Silk, J., 2010, MNRAS, 404, 1775
- van den Bosch et al. (2008) van den Bosch, F. C., Aquino, D., Yang, X., Mo, H. J., Pasquali, A., McIntosh, D. H., Weinmann, S. M., Kang, X., 2008, MNRAS, 387, 79
- van der Wel (2008) van der Wel, A., 2008, ApJ, 675L, 13
- Vollmer et al. (2001) Vollmer, B., Cayatte, V., Balkowski, C., Duschl, W. J., 2001, ApJ, 561, 708
- von der Linden et al. (2010) von der Linden, A., Wild, V., Kauffmann, G., White, S. D. M., Weinmann, S., 2010, MNRAS, 404, 1231
- Vulcani et al. (2010) Vulcani, B., Poggianti, B. M., Finn, R. A., Rudnick, G., Desai, V., Bamford, S., 2010, ApJ, 710L, 1
- White & Frenk (1991) White, S. D. M., Frenk, C. S., 1991, ApJ, 379, 52
- Weinmann et al. (2010) Weinmann, S. M., Kauffmann, G., von der Linden, A., De Lucia, G., 2010, MNRAS, 406, 2249
- Wetzel et al. (2011) Wetzel, A. R., Tinker, J. L., Conroy, C., MNRAS (in-press; arXiv:1107.5311)
- Wijesinghe et al. (2011) Wijesinghe, D. B., Hopkins, A. M., Sharp, R., Gunawardhana, M., Brough, S., Sadler, E. M., Driver, S., Baldry, I., Bamford, S., Liske, J., and 25 coauthors, 2011, MNRAS, 410, 2291
- Wolf et al. (2009) Wolf, C., Aragón-Salamanca, A., Balogh, M., Barden, M., Bell, E. F., Gray, M. E., Peng, C. Y., Bacon, D., Barazza, F. D., Böhm, A., and 15 coauthors, 2009, MNRAS, 393, 1302
- Zabludoff et al. (1996) Zabludoff, A., I., Zaritsky, D., Lin, H., Tucker, D., Hashimoto, Y., Shectman, S. A., Oemler, A., Kirshner, R. P., 1996, ApJ, 466, 104