The 2004 Venezuelan Presidential Recall Referendum: Discrepancies Between Two Exit Polls and Official Results
Abstract
We present a simulation-based study in which the results of two major exit polls conducted during the recall referendum that took place in Venezuela on August 15, 2004, are compared to the official results of the Venezuelan National Electoral Council “Consejo Nacional Electoral” (CNE). The two exit polls considered here were conducted independently by Súmate, a nongovernmental organization, and Primero Justicia, a political party. We find significant discrepancies between the exit poll data and the official CNE results in about 60% of the voting centers that were sampled in these polls. We show that discrepancies between exit polls and official results are not due to a biased selection of the voting centers or to problems related to the size of the samples taken at each center. We found discrepancies in all the states where the polls were conducted. We do not have enough information on the exit poll data to determine whether the observed discrepancies are the consequence of systematic biases in the selection of the people interviewed by the pollsters around the country. Neither do we have information to study the possibility of a high number of false or nonrespondents. We have limited data suggesting that the discrepancies are not due to a drastic change in the voting patterns that occurred after the exit polls were conducted. We notice that the two exit polls were done independently and had few centers in common, yet their overall results were very similar.
doi:
10.1214/09-STS295keywords:
.and \pdfauthorRaquel Prado, Bruno Sanso
1 Introduction
A presidential recall referendum (RR) took place in Venezuela on August 15, 2004. A tense political debate preceded the RR, the main issue being the timing and the validity of the process that led to the RR actually taking place. The Organization of American States (OAS) sent a delegation chaired by its Secretary General to negotiate a solution. The Carter Center, led by President Jimmy Carter himself, played an important role in getting the government and the opposition to agree on a course of action. The Consejo Nacional Electoral (CNE) was the official body in charge of the organization of the RR.
Since the RR was seen by all parties involved as a pivotal event, several organizations set up schemes to collect exit poll data. In this work we study data from two exit polls collected independently by Súmate, a Venezuelan nongovernmental organization (NGO) and Primero Justicia, a Venezuelan political party. Súmate (http://sumate.org/index.html)defines its mission as that of “building democracy.” It played a leading role in the process of collecting the signatures needed to call the RR. Primero Justicia (http://www.primerojusticia.org.ve) is a relatively young party that campaigned actively to recall the President. The exit poll samples were collected during the day when the RR took place, at a number of voting centers around the country. As seen in Table 1, the official results of the recall (available from www.cne.gov.ve) were 40.6% in favor of recalling the president (Yes vote) and 59.1% against recalling the president (No vote). There was a percentage of 0.3% of invalid votes. These results are in sharp contrast with the exit poll results. According to Súmate, the percentage of Yes votes was 60.7% and according to Primero Justicia, the percentage of Yes votes was 60.5%.
| Number votes | % of votes | |
| Registered voters | 14,037,900 | 100% |
| Casted votes | 9,815,631 | 69.92% |
| Number votes | % of casted votes | |
| Yes votes | 3,989,008 | 40.64% |
| No votes | 5,800,629 | 59.10% |
| Invalid votes | 25,994 | 0.26% |
The large observed discrepancies between these exit polls and the actual official results immediately triggered discussions among experts and nonexperts in Venezuela questioning the validity of the polls and the official results. One of the arguments raised against the exit polls was that the selection of the polled centers was biased. Another was that exit polls were conducted only until early in the afternoon, while many of the voting centers stayed open until late at night. Yet another argument was that the exit polls were biasedly conducted by interviewers who were prone to choose pro-Yes voters and that No-voters were less inclined to respond to these polls.
Hausmann and Rigobón (2004) present a comprehensive discussion of several issues regarding the possibility of fraud in the recall referendum. Other related references include Delfino and Salas (2011) and Taylor (2007). In particular, for the Súmate and Primero Justicia exit polls, Hausmann and Rigobón show that there are no significant differences between the official results for the centers in those polls and the official results for the overall population, thus indicating that the selection of the polled centers was not particularly biased.
In this study we find significant discrepancies between the Súmate and PJ exit poll results and the official results for the majority of the voting centers. We also find (via a simulation study) that the discrepancies are neither due to chance nor to the exit polls taking too small a sample for each center. While most of the centers in the exit polls were operated with voting machines, some manual centers were also sampled. We consider this small subgroup separately, since the analysis in these cases is complicated by the presence of invalid votes. Invalid votes are virtually nonexistent for the automatic centers.
Súmate has produced a report on the entire referendum process (Súmate, 2004), which is available from their web page. The Carter Center has produced two reports, one on the audit of the RR results (The Carter Center, 2004) and a final report about observing the RR process (The Carter Center, 2005). Both reports are available at www.cartercenter.org.
The exit poll data analyzed here were provided by Súmate. The data are available from Súmate upon request. The official data on the recall referendum were obtained from the official CNE web site www.cne.gov.ve.
2 Exit Poll Data
2.1 Súmate Exit Poll
The exit poll conducted by Súmate consisted of a sample of 269 voting centers, out of 8279 total centers. These were located in 23 of the 24 states and federal entities. The exception being the State of Delta Amacuro. Only one center was polled in each of the states of Cojedes and Amazonas. In all other states at least two centers were polled. Voting centers in Venezuelan embassies and consulates were not included in the polling. A total of 23,827 people were interviewed in these centers. This corresponds to a population of 945,074 voters registered in such polled centers. The exit poll was designed by Súmate and the American polling firm Penn, Schoen and Berland Associates (PSB). According to Súmate, the pollsters were volunteers who were trained and supervised by Súmate and PSB for more than a month. They were instructed to follow a protocol to guarantee that the sample had the least possible bias. In particular, strong emphasis was given to the fact that the pollsters should not be identified as members of Súmate or any other political group. Samples were collected by asking selected people coming out of the voting center to deposit an envelop with their voting option in a closed ballot box. This was the only question asked, no additional information about the person interviewed (e.g., age, sex, income, etc.) was recorded and linked to his or hers voting option. People were selected to reflect the proportion of gender and age distribution in the center. Each center had a target sample size per hour for each gender and for each one of three age groups. A sample of an hourly reporting form is presented in Table 2. Pollsters were instructed to avoid interviewing more than one person from a given cluster of people. Ballots from all the voters interviewed were deposited in the same box and results were reported to a supervisor every two hours.
| Age | ||||||
| 30 | 30–50 | 50 | ||||
| \ccline2-3,4-5,6-7 Gender | Target | Polled | Target | Polled | Target | Polled |
| Male | 1 | 2 | 1 | |||
| Female | 2 | 2 | 1 | |||
| Total | 3 | 4 | 2 | |||
The sampling scheme was designed to collect data from the chosen voting centers between 7:00 am and 5:00 pm, since the Venezuelan electoral law states that voting centers have to be opened at 7:00 am and should close by 4:00 pm, but should remain open as long as there are voters in line. The voting process was extremely slow due to a historically large attendance of the voters and the introduction of new voting technology, such as fingerprint readers and automatic voting machines. Because of this, the CNE extended the closing hour of the voting centers twice during the afternoon of the RR day, first indicating that centers had to remain open until 9 pm and then extending the closing time until 12:00 pm (see the reports of the Carter Center and Súmate for a summary of some of the facts related to the procedures that need to be followed during election day and the actual RR process). For this reason, only 24 out of the 269 centers chosen to be polled by Súmate were polled until 11:00 pm.
We have access to a database where the samples are recorded every two hours, as they were reported by the pollsters. We observed that the data collection process was, for most centers, very regular. We were able to calculate the overall target for each center and compare that to the effectively observed sample. This is important to establish if a center was strongly above or below target. We notice that being below target does not provide useful information about the nonresponse. Indeed, there could be many factors affecting the fact that a pollster collected less samples than planned.
2.2 Primero Justicia Exit Poll
The exit poll conducted by Primero Justicia (PJ) consisted of a sample of 258 voting centers located in 21 of the 24 Venezuelan states and federal entities. The three states excluded from the sample were Amazonas, Cojedes and Delta Amacuro. No embassies or consulates were included in the sample. A total of 12,347 people were interviewed. This corresponds to a population of 1,151,980 voters registered in the polled centers. The protocol that the interviewers followed to collect the sample was similar to that used by Súmate. Samples were collected from 7:00 am to 3:00 pm. There was a target number of samples to be obtained per hour. Reports were sent to a central office six times during the day. Interviewers worked in pairs and were given specific instructions on the way to perform the interview so that minimum bias would result. The PJ poll set targets for the number of interviews that were smaller than the ones set by Súmate and sampled only up to 3:00 pm. This produced a total sample size of roughly a half of that of Súmate. For this exit poll we only have the total number of samples taken during the day.
3 Data Analysis
In this analysis we only consider centers for which more than 20 samples were collected in either of the two exit polls. In addition, we exclude centers from the Súmate exit poll for which the number of people interviewed was 50% smaller or 20% higher than the target sample size. We exclude the centers that were strongly above their targets since this is taken as an indication that the interviewer was in violation of the protocol. In particular, there could be many unsolicited answers that could bias the sample. We were left with data for a total of 497 centers. From these 497 centers, 464 were automatic and 33 were manual. The Súmate and PJ polls have 27 common centers, all of them automatic.
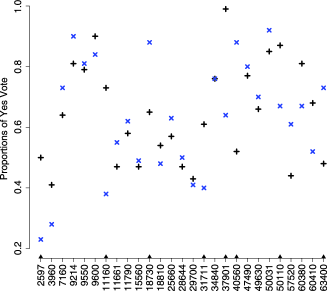
A comparison of the results obtained by the two exit polls in the common centers shows that in 19 out of the 27 cases the exit polls produce compatible results. Figure 1 gives a graphical comparison of the samples. The significance is established using a test at the 1% level (for details about the test see, for example, DeGroot and Schervish, 2002). We closely inspected the data of the 8 centers where the two exit polls differ significantly. We found that in 2 of these 8 centers there are reasons to believe that one of the two exit polls might be biased in favor or against the Yes vote. This may be due to problems related to either a small sample size or a biased selection of the people interviewed. The official recall results are compatible with at least one of the two exit polls, usually the one from Súmate, in 7 of these 8 centers.
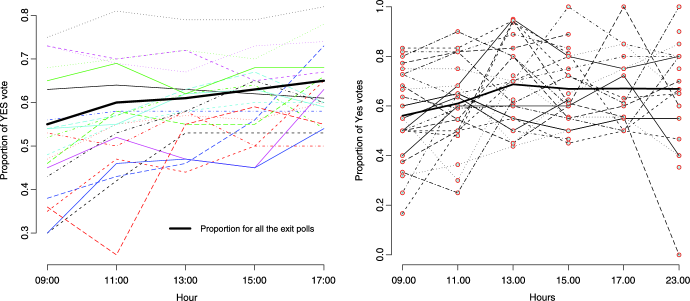
The availability of data reported every two hours for the Súmate exit polls provides information about possible trends in the voting pattern during the day. The left panel in Figure 2 shows the proportion of Yes votes per state at the five reporting times for all the states that were polled. We see no obvious pattern for the state data. We do observe a slight increasing pattern for the overall proportion of Yes votes, as suggested by the thick black line that corresponds to the mean. The right panel shows the proportion of Yes votes for the centers that were sampled until 11 pm. Again, we observe no obvious pattern or trend here except for a slight increase in the overall proportion of Yes votes during morning hours.
In order to determine if the automatic and manual centers exhibited a different behavior, we analyzed the data from these two classes of centers separately.
3.1 Automatic Centers
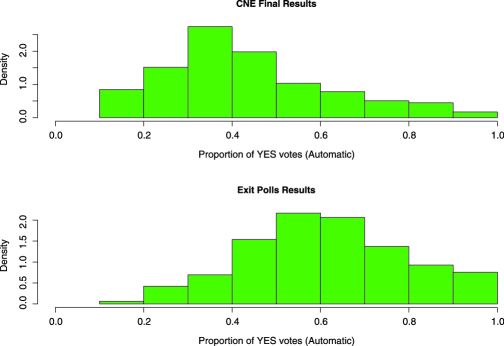
We begin by comparing the distribution of the proportion of Yes votes obtained in the exit polls per center and the distribution of the official proportion of Yes votes obtained in the polled centers. Figure 3, top panel, displays a histogram of the proportions of Yes votes reported by the CNE in the 464 automatic polled centers. The bottom panel of Figure 3 shows a histogram of the proportions of Yes votes reported by the exit polls in the same 464 automatic centers. It can be seen from these pictures that the distribution of the final referendum recall results and the distribution of the exit poll results differ sharply. Figure 3 gives a clear indication that the differences between the results of the exit polls and the official ones are not due to a biased choice of the centers. In fact, for the same centers, we obtain two completely different distributions of Yes votes.
In order to obtain a more specific quantification of the differences between the results for a given center, we calculated the likelihood of observing the samples obtained by the exit polls for such center as follows. Let be the number of Yes votes observed by the pollster for a given center and let be the size of the sample collected at center by the pollster. So, for example, for center (with CNE ID number 400), located in the Capital District, Municipio Libertador, we have that and . The proportion of Yes votes in the exit poll for this center is then . The actual proportion for this center as reported by the CNE is . How likely is it that a sample of 68 Yes votes would be observed in a sample of 120 voters where each voter has probability 44% of voting yes?
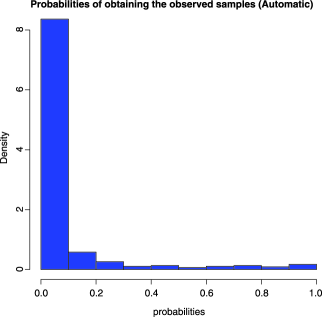
We answer the question by assuming that is a random sample from a binomial distribution. Suppose that the true probability of a Yes vote for center is equal to the official proportion of Yes votes for such center, say, . Then
| (1) |
Using (1), we obtain that the required probability is . Clearly, this probability could be small just because could take 121 possible values. So we compute . We then repeat this calculation for all the automatic centers. Figure 4 displays a histogram of the probabilities for all the centers. We observe that about 70% of these probabilities lie in the interval . That is, about 70% of the polled centers’ results have a chance smaller than 1.3% of being obtained from a population where the proportions of Yes votes were the official proportions.
3.2 Further Analyses
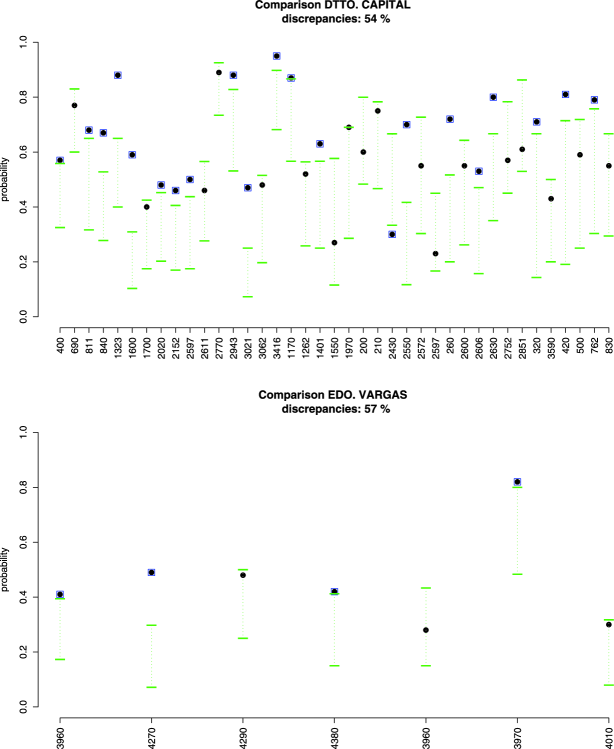
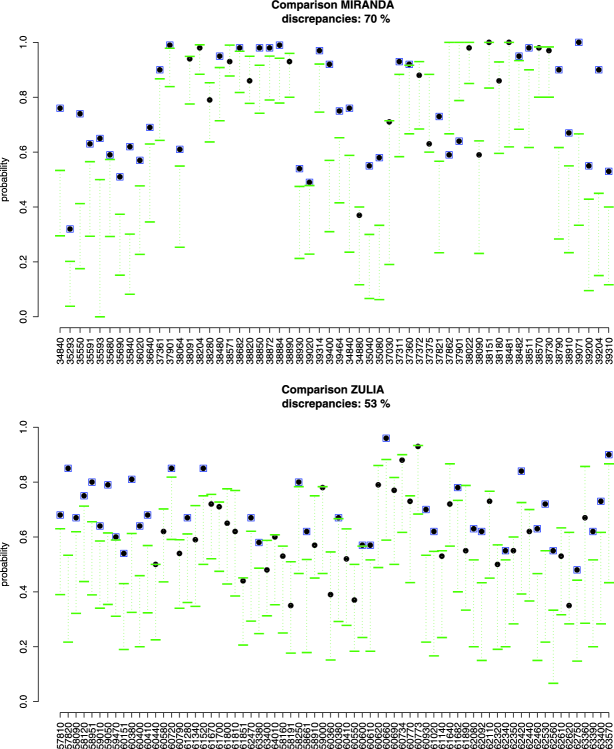
To obtain a better idea of how different the official and the exit polls results are, we performed a simulation study. Specifically, we simulated 5000 samples of the same size as those of the exit polls, for each center. In these simulations we set the probability of a Yes vote for each center at the official proportion of a Yes vote at that center, denoted . In other words, we simulated 5000 samples from (1), for . We then computed the 0.05 and 99.5 quantiles (to produce a 99% interval) of the proportions of Yes votes in the 5000 samples, and compared the proportions observed in the exit polls to such intervals. A graphical representation of the results can be seen in Figures 5 and 6 for 4 of the 21 polled states with more than one center. In these figures, a center where the exit poll proportion falls outside the 99% interval is marked with a square. Such a case is labeled as a discrepancy. We report the percentage of those per state. As an example, in the State of Miranda the intervals did not cover the exit poll results in 70% of the centers.
Zulia, Miranda and the Capital District are the three most populated states in Venezuela, with approximately 32% of the total population. Vargas is a comparatively small state that is considered as a stronghold of the government. We observe that in about 60% of the centers the exit poll result falls above the upper limit of the interval. This happens even when the exit poll predicted that the No vote would win in a given State, as is the case of Vargas (see bottom panel in Figure 5). In addition, this is not a peculiar behavior observed only in certain regions in the country, as can be seen from the results in Table 3. We observe substantial variability in both the location and the width of the intervals for centers in some of the states. Differences in width are not surprising, as exit poll sample sizes were not uniform. For example, centers 420 and 690, both in Dtto. Capital, had 21 and 100 polls collected, respectively. The number of registered voters was 2909 for center 420 and 5021 for center 690. Additionally, urban regions in Venezuela can have pockets of relatively affluent areas surrounded by very low income areas. So we can expect very different voting patterns even in centers that are located nearby. In other words, both and may vary substantially within a given state. These issues partly explain the disparate distribution of the intervals in the figures.
| State | Discrepancies | State | Discrepancies | State | Discrepancies |
|---|---|---|---|---|---|
| Capital | 54% | Anzoátegui | 71% | Apure | 100% |
| Aragua | 66% | Barinas | 67% | Bolívar | 52% |
| Carabobo | 58% | Falcón | 25% | Guárico | 64% |
| Lara | 60% | Mérida | 36% | Miranda | 70% |
| Monagas | 53% | Nva. Esparta | 80% | Portuguesa | 62% |
| Sucre | 67% | Táchira | 68% | Trujillo | 54% |
| Vargas | 57% | Yaracuy | 70% | Zulia | 53% |
| ID | Yes | No | Yes | No | I | CT | CT | ||
|---|---|---|---|---|---|---|---|---|---|
| exit poll | exit poll | CNE | CNE | exit poll | |||||
| 5450 | 63 | 11 | 0.85 | 77 | 117 | 2 | 0.39 | 3:00 pm | 6:30 pm |
| 13,160 | 49 | 35 | 0.58 | 268 | 466 | 66 | 0.34 | 3:00 pm | 8:00 pm |
| 14,041 | 44 | 36 | 0.55 | 160 | 820 | 10 | 0.16 | 3:00 pm | NA |
| 16,870 | 42 | 46 | 0.48 | 65 | 265 | 12 | 0.19 | 5:00 pm | 5:10 pm |
| 17,480 | 56 | 42 | 0.57 | 183 | 255 | 0 | 0.42 | 5:00 pm | 9:30 pm |
| 21,311 | 50 | 44 | 0.53 | 194 | 425 | 42 | 0.29 | 5:00 pm | 8:30 pm |
| 21,630 | 55 | 29 | 0.65 | 189 | 199 | 10 | 0.47 | 3:00 pm | 8:30 pm |
| 31,723 | 53 | 27 | 0.66 | 217 | 359 | 18 | 0.37 | 3:00 pm | 9:00 pm |
| 34,610 | 67 | 35 | 0.66 | 361 | 538 | 28 | 0.39 | 5:00 pm | 9:07 pm |
| 43,140 | 37 | 21 | 0.64 | 45 | 152 | 0 | 0.23 | 3:00 pm | NA |
| 44,200 | 36 | 58 | 0.38 | 54 | 264 | 8 | 0.17 | 5:00 pm | NA |
| 47,550 | 63 | 27 | 0.70 | 346 | 668 | 0 | 0.34 | 3:00 pm | 2:00 am |
| 48,490 | 58 | 23 | 0.72 | 130 | 277 | 2 | 0.32 | 3:00 pm | 7:41 pm |
| 60,290 | 65 | 29 | 0.69 | 345 | 746 | 44 | 0.30 | 5:00 pm | 7:00 pm |
| 11,895 | 34 | 26 | 0.57 | 155 | 1678 | 40 | 0.08 | 3:00 pm | NA |
| 15,680 | 39 | 21 | 0.65 | 265 | 410 | 30 | 0.38 | 3:00 pm | NA |
| 29,330 | 15 | 15 | 0.50 | 42 | 772 | 48 | 0.05 | 3:00 pm | NA |
| 42,808 | 28 | 14 | 0.67 | 231 | 464 | 52 | 0.31 | 3:00 pm | NA |
3.3 Manual Centers
We performed a separate analysis of the data corresponding to the manual centers for two reasons. The first one is that the manual data have invalid votes. These are almost non existent in the automatic centers. This implies that the variable corresponding to a vote in a manual center has three possible outcomes. The second reason is that manual centers are peculiar. They usually correspond to remote locations and they have a much smaller number of voters than the automatic ones. Table 4 shows the detailed numbers for some of the manual centers. We can see that most of them had only a few hundred voters. This is typical for the 33 manual centers that were included in the exit poll samples.
The percentages of invalid votes in the 33 manual centers considered here go from 0% to 13.5%, with an average of 3.5%. In order to take the invalid votes into account, we do the following calculation. We assume that the number of Yes, No and invalid votes in a sample of size taken from center , where the proportions of Yes votes, No votes and invalid votes are, and , respectively, follow a multinomial distribution. This is
| (2) |
We assume that the proportions of the Yes, No and invalid votes, and , are the actual proportions obtained in the recall referendum for each center . We also assume that the sample size is the same as that taken by the pollsters at the center.
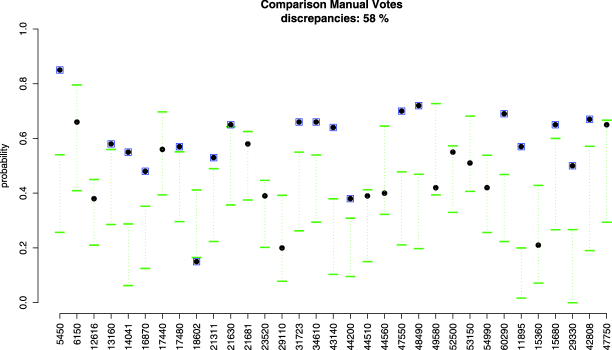
Now, for each center , we generate 5000 samples from (2). We then take the proportion of Yes votes for each one of the 5000 samples as , and use these values to compute the 99% intervals that will be compared against the proportion of Yes votes observed by the pollsters. In doing this, we account for the fact that the pollsters could have interviewed people whose votes resulted in being invalid. Note that we are assuming an extreme situation here in which all the invalid vote samples are actually counted as Yes votes. Figure 7 shows a graphical representation of the results. We find that the exit poll results of 19 out of the 33 manual centers considered present significant discrepancies with the official results. In one of these 19 centers the discrepancy occurred as a result of overestimating the Yes vote due to all the invalid votes in the simulation being counted as Yes votes.
Table 4 gives some interesting insight on the data for the manual centers where we found large discrepancies. In general, we observe that the sizes of the exit poll samples are fairly large, relative to the number of voters. So, assuming that the official results correspond to the true probabilities of Yes votes, obtaining such large differences is only possible if the exit poll samples were extremely biased. We marked with four centers that we found particularly intriguing. For centers 5450, 16,870, 43,140 and 44,200, the exit polls collected samples of 38%, 26%, 30% and 23% of all voters. Of the total Yes votes, 82%, 65%, 82% and 67% ended up in the exit poll samples, respectively. If the very low proportions of Yes votes officially reported are correct, the interviewers did not follow the protocol and were able to bias the sample.
4 Discussion
The previous analyses involve no sophisticated statistical modeling. They are based on the assumption that the official CNE results are true. They provide an exploration of the likelihood that samples like those in the exit polls would be obtained under such assumption. The conclusion is that, for a large number of centers, observing samples like the ones in the exit polls is a very unlikely event, given the official CNE results. So, clearly, the differences between the predictions of the exit polls and the actual results at the national level are not due to a bias in the selection of the centers. There are significant differences between the official results and the exit polls in about 60% of the centers that are not due to chance. Centers where differences are present are located in all states, so there does not seem to be any clear geographical bias in effect in the exit polls.
Clearly, the differences between the exit polls and the official results could be due to a strong bias in favor of the Yes votes. Such bias would be the effect of the way samples were collected. To explain the differences between exit polls and official results, the bias should be present not just in a few centers, but in about 60% of them and be geographically consistent. That is, several hundred pollsters across the country should have obtained systematically biased samples that favored the Yes vote, and this in spite of having been precisely instructed to follow a protocol to avoid such bias. Given the protocol, no information about the voters was recorded. So we have no way to associate covariates like, say, gender, age, race, religion or social status, to voting patterns in a way that would reveal systematic biases in the selection of the sample.
Unfortunately we have no good estimation of the nonresponse. An explanation of the discrepancies between the official results and the exit polls could be that the No voters were less willing to answer than the Yes voters. Now, suppose that the estimation of Yes vote was about 60% when the true value was about 40%, as in the official result. This requires that about 33% of the people interviewed did not respond and had actually voted No. Again, this phenomenon should have happened all over the country.
Similar arguments could be given for the false responses. In this case, about 33% of the Yes samples should have corresponded to actual No voters. Such a high level of false responses should have happened even though the exit polls refer to just one question with a binary secret answer. Also, the question is about a vote that has already been casted, so the respondent has no doubts. The subjects are easily identifiable and the process of obtaining the sample is quick and simple.
Another explanation for the discrepancies of between exit polls and official results could be that there were massive numbers of No votes late in the evening. We have only very limited data shown in Figure 2 to study this possibility. These data do not support such an explanation. On the contrary, the national average of Yes votes was slightly increasing over the ten-hour period for which most exit polls were conducted. We notice that at the time the exit polls were finalized the proportion of Yes votes was about 60%. To lower this percentage to 40% by the end of the evening, the Yes vote proportion should have plunged to 20% after 5 pm, for the same number of votes as those casted during he first ten hours of the voting day.
After the RR, two audits of the automated counts were done by the CNE. According to the Súmate report, the first one, known as the “hot” audit, was carried out at the time of the closing of the centers in only 84 of 199 preselected centers. Such an audit is also mentioned in the Carter Center’s report. We were unable to find any data related to the result of the hot audit. The second audit took place three days after the RR and the opposition parties declined to participate, claiming it was flawed. Two hundred centers were sampled and some of the ballot boxes from 150 of those centers audited. Unfortunately, the information regarding which centers were effectively audited has not been made available by either the CNE or the Carter Center, who witnessed the audit. Of the 200 centers in the original list, 15 were among those polled by Súmate and 14, different ones, among those polled by PJ. Unfortunately it has not been possible to establish if any of these 29 centers were among the list of 150 audited ones.
The exit polls analyzed in this paper are not the only ones that were conducted for the RR. We obtained the data of an exit poll conducted by Proyecto Venezuela, another political party that campaigned actively to recall the President, based on more than 200,000 voters sampled between 6:30 am and 2 pm. The results are in line with those of the two exit polls considered in this work. We decided not to include an analysis of those data here due to the fact that we were unable to find a good description of the protocol followed by the pollsters. The Carter Center report mentions an exit poll conducted by the American firm Evans/McDonough that had the No vote winning with 55% (see also Collier, 2004). We were unable to find information about this poll. The web page of the company has a link to a document containing results from a polling previous to the RR (www.evansmcdonough.com/venezuela/ VenezuelanPollPre.pdf) but no mention of an exit poll.
We emphasize that this study does not provide conclusive evidence that there was fraud in the Venezuelan Presidential recall referendum. It shows that there are important discrepancies between the official results and the data obtained on the field during referendum day.
References
- (1) Collier, R. (2004). Venezuelan politics suit Bay Area talents: Locals help build Chavez’s image, provide polling data. San Francisco Chronicle, August 21, 2004.
- (2) DeGroot, M. H. and Schervish, M. J. (2002). Probability and Statistics, 3rd ed. Addison-Wesley, Reading, MA.
- (3) Delfino, G. and Salas, G. (2011). Analysis of the 2004 Venezuela referendum: The official results versus the petition signatures. Statist. Sci. 26 479–501.
- (4) Hausmann, R. and Rigobón, R. (2004). In search of the black swan: Analysis of the statistical evidence of fraud in Venezuela. Technical report, John F. Kennedy School of Government, Harvard Univ.
- (5) Súmate (2004). Preliminary report: The presidential recall referendum.
- (6) Taylor, J. (2007). Too many ties? An empirical analysis of the Venezuelan recall referendum. Technical report. Dept. Statistics, Stanford Univ.
- (7) The Carter Center (2004). Audit of the results of the presidential recall referendum. Final report.
- (8) The Carter Center (2005). Observing the Venezuela presidential recall referendum.