Incidence of Mg ii absorption systems towards flat-spectrum radio quasars
Abstract
The conventional wisdom that the rate of incidence of Mg ii absorption systems, (excluding ‘associated systems’ having velocity c relative to the AGN of less than 5000 km.s-1) is totally independent of the background AGN, has been challenged by a recent finding that for strong Mg ii absorption systems towards distant blazars is times the value known for normal optically-selected quasars (QSOs). This has led to the suggestion that a significant fraction of even the absorption systems with as high as may have been ejected by the relativistic jets in the blazars, which are expected to be pointed close to our direction. Here we investigate this scenario using a large sample of 115 flat-spectrum radio-loud quasars (FSRQs) which too possess powerful jets, but are only weakly polarized. We show, for the first time, that towards FSRQs is, on the whole, quite similar to that known for QSOs and the comparative excess of strong Mg ii absorption systems seen towards blazars is mainly confined to . The excess relative to FSRQs can probably result from a likely closer alignment of blazar jets with our direction and hence any gas clouds accelerated by them are more likely to be on the line of sight to the active quasar nucleus.
Subject headings:
quasars: absorption lines — quasars: general — BL Lacertae objects: general — intergalactic medium — galaxies: jets — techniques: spectroscopic1. Introduction
Study of Mg II absorption line systems in the spectra of QSOs has provided a means of detecting distant normal field galaxies which happen to be situated close to the lines of sight to the QSOs (e.g., Bergeron et al. 1991; Steidel et al. 1994). Barring the so called ‘associated systems’ (having ), the absorption line systems are customarily believed to arise in intervening structures that are wholly unrelated to the background QSO. This view was, however, challenged by the finding that the occurrence rate, , of Mg ii absorption systems in the spectra of GRBs is nearly 4 times the value found for QSOs, when strong lines having rest-frame equivalent width are considered (Prochter et al. 2006a). Later studies have supported this unexpected trend, albeit the excess factor is found to be smaller, 2.1 0.6 (Sudilovsky et al. 2007; Vergani et al. 2009; Tejos et al. 2009). More recently, Bergeron, Boisse & Menard (2011, hereinafter BBM) have examined this issue for the case of blazars which, like GRBs, also possess relativistic jets pointed close to our direction, but are considerably less variable. Using intermediate-resolution optical/UV spectra of their sample of 45 powerful blazars (predominantly distant BL Lacs) at , and again excluding ‘associated systems’, these authors have found a factor of 2 excess (3 confidence) in the incidence of Mg ii absorption systems, as compared to the systems detected towards QSOs. Interestingly, the excess is found both for strong () and weaker () Mg ii systems, where is the rest-frame equivalent width. Thus, the results pertaining to both GRBs and BL Lacs hint at a radical premise that the observed occurrence of at least the (purportedly intervening) strong Mg II absorption systems is somehow connected with the background source (BBM).
| Data set | Content | -range | Threshold EW | Instrument(s) used | Limiting optical | |
|---|---|---|---|---|---|---|
| (Mg ii2796 ) | for spectroscopy | magnitude | ||||
| 1. | Ellison et | 75 radio-selected | 0.61.7 | 0.3Å | ISIS(WHT 4m) | unspecified |
| al. (2004) | quasars (taken111Applying the four selection filters; (i) eliminating the sources that are common to two or more of the samples, (ii) excluding all sources that are not in the CRATES catalog of flat-spectrum radio quasars (FSRQs), (iii) eliminating sources that are either classified as ‘HP’ or ‘BL’ in Véron-Cetty & Véron (2010) or as ‘BZB’ (implying BL Lac), or ‘BZU’ (implying uncertain type) in the blazar catalog ROMA-BZCAT (2009) and (iv) availability of a intermediate or high-resolution optical spectrum (see Sect. 2). 63) | EFOSC2(ESO 3.6m) | ||||
| FORS1 (VLT UT3) | ||||||
| (Intermediate-resolution) | ||||||
| 2. | Bernet et | 77 radio-selected | 0.62.0 | 0.1Å | UVES (VLT UT2) | |
| al. (2010) | quasars (takena 32)222Excluding the 3 quasars (J114608.1244733, J204719.7163906, J213638.6004154) already covered in dataset-1. | (High-resolution) | ||||
| 3. | Jorgenson et | 68 radio selected | 0.651.33 | 0.02Å | HIRES (Keck) | |
| al. (2006) | quasars ( takena 8)333The 68 radio-selected quasars in Jorgenson et al. (2006) were used in the survey for damped Ly- systems. Of these 54 satisfy our selection criteria and for these we made a search for high resolution spectra in the UVES/VLT and HIRES/Keck archives and found reduced HIRES/Keck spectra for 8 of them. | (High-resolution) | (mostly 18) | |||
| 4. | Narayanan et | 81 QSOs from ESO | 0.42.4 | 0.02Å | UVES (VLT UT2) | |
| al. (2007) | archive (takena 12)444Excluding the 5 quasars, of which two (J013857.4225447, J204719.7163906) are already covered in the dataset-1, and another 3 (J095456.8174331 J113007.0144927 & J123200.0022405) in the dataset-2. | (High-resolution) | (mostly 19) |
Origin of the above unexpected result is unclear. BBM have argued that while dust extinction can lower the apparent incidence of absorbers towards QSOs and gravitational lensing can increase it towards GRBs and blazars, the expected amplitude of these effects falls short, by at least an order of magnitude, of explaining the afore-mentioned factor of 2 discrepancy between the incidence rates of Mg ii absorbers found towards blazars/GRBs versus normal QSOs. They have further estimated that powerful jet in the blazars are capable of sweeping sufficiently large column densities of gas (upto ) and accelerating such clouds to velocities of order , thereby possibly accounting for the excess of Mg ii absorption systems observed in comparison to QSOs. From the observational side, evidence is still lacking for such high-velocity outflows of cool material from radio-loud AGN, although mildly relativistic outflows of highly ionised gas in the nuclear region now appear to be commonly seen for such sources (e.g., Holt et al. 2008). Based on the observations of Fe XXV/XXVI K-shell resonance lines in the X-ray band, outflow speeds of 0.15c have recently been inferred for highly ionised gas clouds with column densities of cm-2 located within the central parsec of the AGN (Tombesi et al. 2011). These authors have argued why clouds with even higher ejection velocities could have remained undetected on account of selection effects and instrumental sensitivity limitations. However independent evidence of such high-velocity outflows of cool material are still essential in view of the recent finding of Giustini et al. (2011) who have detected highly ionized fast (km.s) X-ray outflow associated with slower UV outflow (km.s).
Whilst the above findings lend some credence to the hypothesis that the observed excess of Mg ii absorption systems towards blazars might have a causal relationship to gaseous outflows triggered by their relativistic jets pointed close to our direction (BBM), it would clearly be desirable to probe this suggestion using an independent sample of AGN having powerful Doppler boosted jets. Here we examine this question by using such a sample, but which consists of a different class of powerful AGN, namely flat-spectrum radio quasars (FSRQs, with low optical polarization, hence non-blazar type). Compared to the blazar sample studied by BBM, our sample of 115 (non-blazar) FSRQs is 2.5 times larger and similar or higher resolution optical/UV spectra are available for all its members, either from the literature or various data archives.
2. The FSRQ sample and the spectral data
Our 4 datasets of FSRQs have been derived from the four publications listed in Table 1. All but the last of these publications (Narayanan et al. 2007) provide samples of radio-selected quasars; the fourth publication is a mix of radio and optical selection (Table 1). To begin with, we merged the samples reported in the four publications, obtaining a list of 301 quasars. From this basic list we eliminated the 8 quasars present in more than one of the four samples. For instance, if a quasars had already occurred in the first sample, it was deleted from all the remaining samples, if present therein. From this reduced list to 293 mostly radio-selected quasars we then excluded all those not contained in the CRATES catalog of flat-spectrum radio quasars (FSRQs), which provides for each source the spectral index555 is defined as: , between 1.4 GHz and 4.8 GHz and contains only sources with and a flux density above 65 mJy at 4.8 GHz (Healey et al. 2007). This selection filter left us with 201 FSRQs. From this list we further deleted sources that are either classified as ‘HP’ or ‘BL’ in the Véron-Cetty & Véron (2010) catalogue, or as ‘BZB’ (implying BL Lac), or ‘BZU’ (implying uncertain type) in the catalog ROMA-BZCAT 2009 (Massaro et al. 2009). Lastly, we excluded all sources which are absent from both these catalogs, treating their nature to be uncertain. This sequence of selection filters left us with 163 FSRQs (non-blazars), i.e., 65, 32, 54 and 12 FSRQs constituting our dataset-1, 2, 3 and 4, respectively, drawn from the four parent publications mentioned in Table 1.
For the largest dataset-1 (65 southern FSRQs), the parent publication (Ellison et al. 2004) already provides for all but two sources (J043850.5201226/B0436203 & J165945.0021307/B1654-020) the entire information relevant for the present study, such as Mg ii absorber redshift, rest-frame equivalent width EW(Mg ii2796 ) and the redshift path values for systems having EW(Mg ii2796 ) above the thresholds and (their Table 3). Following an unsuccessful search for the optical spectra of the two remaining sources in the UVES/VLT archive, both sources were excluded from further analysis. For the sources in the remaining three datasets (nos. 2 – 4) similar archival search for high resolution optical spectra was much more crucial, since the requisite information was not available in their parent publications (Table 1).
For the southern dataset-2, spectra of all 32 FSRQs were found in the UVES/VLT666http://archive.eso.org/eso/eso-archive-adp.html archive. For the northern dataset-3, a search was made in the HIRES/Keck777https://koa.ipac.caltech.edu/cgi-bin/KOA/nph-KOAlogin archive and spectra for 10 out of the total 54 FSRQs were found. However, for one of them (J064204675836) only raw science frames were available, and calibration file was missing. For another FSRQ (J185230401907), only two exposures of HIRES/Keck observation were available, resulting in low signal-to-noise ratio (SNR ) and hence a much reduced spectral coverage. We thus ended up with 8 FSRQs with useful spectra, out of the total of 54 FSRQs in the dataset-3. Lastly, spectra for all 12 FSRQs in our dataset-4 were found in the UVES/VLT archive. This selection process left us with 115 FSRQs (non-blazar type) with high-quality optical/UV spectra, contributed by 63, 32, 8 and 12 FSRQs out of the dataset-1, 2, 3 and 4, respectively (Table 1). For post-processing of the extracted spectra of the FSRQs belonging to datasets 2–4, such as air to vacuum wavelength conversion, heliocentric correction, combining individual exposures to enhance the SNR and continuum fitting, we have followed the procedure described in Chand et. al (2004). Details of our final sample888Full table is available only in on-line version. of 115 FSRQs are given in Table 3 .

| Absorber type | -range | Nobs | z999Redshift path estimated for the specified EW detection threshold above 5 significance level. | 101010The scale factor is used for scaling our computed for the FSRQ weak and strong absorption systems, from their respective mean redshifts (col. 5) to the mean redshift of the BBM blazars ( = 0.83 for the weak and 0.82 for the strong Mg ii absorption systems). For details, see the text in the beginning of Sect. 4. | 111111 for the weak absorption systems and for the strong absorption systems detected towards the BBM blazars (their Eqs. 5 8). | |||
|---|---|---|---|---|---|---|---|---|
| Weak systems | Å | 53 | 80.23 | 0.91 | ||||
| Strong systems | Å | 22 | 106.02 | 0.81 |
3. Analysis
Although both UVES and HIRES spectrographs provide a large wavelength coverage, from 3000Å to 10000Å , the available spectral coverage varies from quasar to quasar, based on the choice of cross-disperser settings. Combining exposures from various settings, therefore, resulted sometimes in gaps in the wavelength coverage. In addition, we systematically excluded the following spectral path lengths from our formal search for Mg ii absorption systems: (i) wavelength region blueward of the Ly- emission line, to avoid contamination by the Ly- forest; (ii) wavelength regions within 5000 km.sof the Mg ii2796,2803 emission lines at the quasar redshift, as any absorption lines within this velocity interval have a higher probability of being associated with the quasar itself (Sect. 1); and (iii) spectral regions polluted by the various known atmospheric absorption features; these were eliminated by eye for any line blending. Further, noisy spectral regions got discarded by our considering only the spectral ranges with SNR sufficient to detect with significance any absorption line above the adopted EW threshold (which is 0.3Å for weak systems and 1.0Å for strong systems); this is also the criterion used in Ellison et al. 2004 (the parent paper for our dataset-1).
In searching for Mg ii absorption systems, within the included redshift path in each quasar spectrum, we first plotted the normalized spectrum and then plotted over it the same spectrum by shifting the wavelength array by a factor of . Small spectral segments of about 50 Å were then visually inspected for comparable profile shapes and for a doublet ratio between 1:1 and 2:1. To further ascertain the detection of the absorption system, we then searched for corresponding metal lines (e.g. Fe ii , Mg ii , C iv , Si iv , etc.) in the velocity plot. Weak Mg ii doublets that were found within km.s of each other were taken to be part of the same absorption system and therefore classified as one multi-cloud system as is usually done.
From the above analysis of the optical spectra of the total 52 FSRQs drawn from the datasets 2–4, we detected 29 Mg ii absorption systems with Å Å (“weak systems”), and 10 Mg ii absorption systems with Å (“strong systems”). Thus, including the dataset-1, the total counts of weak and strong Mg ii absorption systems in our final sample of 115 FSRQs become 53 and 22, respectively (Table 4)4. The detected Mg ii absorbing system(s) have range, median redshift and redshift dispersion, respectively, of , and for the weak systems and , , for the strong absorption systems.
Table 2 summarizes the results for our final sample of 115 FSRQs, giving , where is the number of the observed Mg ii absorption systems within the redshift path ; for both strong and weak Mg ii systems. The errors on are calculated based on Poisson statistics for small numbers, with the limits corresponding to 1 confidence level of a Gaussian distribution, as tabulated by Gehrels (1986).
4. Summary and Discussion
It is interesting to note from Table 2 that the for FSRQs and normal QSOs is quite similar both for weak and strong Mg ii absorption systems (e.g see col. 7 Table 2). Here, to compute for normal QSOs at the mean redshift of our FSRQs sample, we use the fit of versus for strong absorption system (), as given by Prochter et al. (2006b) (see also Eq. 6 of BBM) and for systems as given by Nestor (e.g., see Eq. 2 of BBM, their pvt. comm.), derived in both cases by using the QSOs in the SDSS (DR4). Thus, for weak systems toward QSOs, at any redshift can be computed by taking the difference between the above two fits (i.e., for minus for ). However, for carrying out the comparison with the result reported by BBM for blazars (e.g, see col. 9 of Table 2 ), which has different mean redshift compare to mean redshift of our FSRQs sample (e.g, see col. 5 of Table 2), we have to first take into account the known cosmological evolution of , by scaling our values found for the FSRQs, to the mean redshift of the Mg ii absorption systems towards the BBM blazars (). To do this scaling, we have assumed that the cosmological evolution of for our FSRQ sample is similar to that known for towards QSOs, which seem reasonable considering (i) the lack of evolution studies for radio-loud quasars and (ii) that our estimated for FSRQs appears quite similar to that known for QSOs (see above). The computed scale factors, are listed in col. 8 of Table 2. By multiplying with these scale factors, our computed values of for the FSRQ subsets are scaled to the (slightly lower) mean redshift of the BBM blazar sample (), before the ratio of for our FSRQ subsets and the corresponding BBM blazar sets are taken ( col. 9 in Table 2).
The most interesting result from Table 2 is that for Mg ii strong absorption systems, for FSRQs is only about half of the value reported by BBM for blazars, which they showed to be itself nearly twice the value known for optically selected quasars (QSOs, which are mostly radio quiet). In other words, the excess abundance of Mg ii strong absorption systems seen towards blazars (and also GRBs), in comparison to QSOs (BBM and references therein), does not seem characteristic of flat-spectrum radio quasars of non-blazar type, even though they too possess powerful Doppler boosted jets. BBM have suggested that the excess seen towards blazars might be due to absorbing gas clouds swept up by the powerful jets and accelerated to mildly relativistic velocities (Sect. 1). While this might readily explain the excess of the absorption systems relative to normal quasars (i.e., optically selected, mostly radio-quiet, QSOs) which lack powerful jets, can this be reconciled with the lack of excess found here for FSRQs which do possess powerful relativistic jets? A relevant factor here is the likelihood that, compared to blazars (and GRBs), the jets in FSRQs may be less well aligned to the line of sight. A plausible outcome of such a jet orientation scenario, which underlies a popular class of unification models of radio-loud AGN ( e.g., Orr & Browne 1982; Antonucci & Ulvestad 1985; Wills & Browne 1986), would be that any gas clouds accelerated by the powerful FSRQ jets to extremely high (even mildly relativistic) speeds may simply not appear in the foreground of the quasar nucleus and hence escape detection as absorption systems.
To probe this hypothesis, we now compare for the FSRQs and blazars the distributions of speeds, , of the observed Mg ii absorption-line systems, relative to the parent quasar/blazar, where
| (1) |
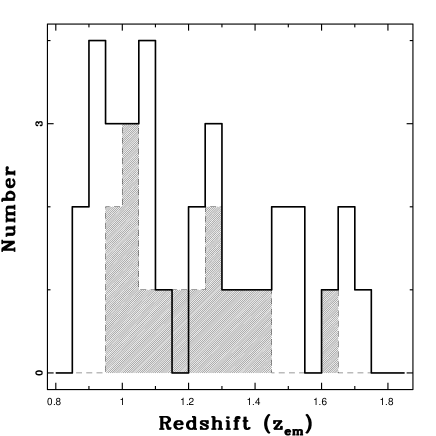
To make a meaningful comparison we have derived a subset from our FSRQ sample, by taking only those 15 FSRQs which satisfy the constraints that (i) the emission redshift, , falls within the range of the 33 BBM blazars actually showing Mg ii absorption systems (out of the total 45 blazars listed in Table 2 of BBM)), and (ii) the detected Mg ii absorption systems satisfy (for weak systems) and (for strong systems), being the ranges for the 33 BBM blazars. To begin with, histograms of for the subset of these 15 FSRQs and the 33 BBM blazars are compared in Fig. 1. K-S test shows that with probability the two histograms are drawn from the same intrinsic distribution of . In view of the known cosmological evolution of , this prior confirmation of redshift matching is important. After the above matching of the redshift range both in and , which led to our subset of 15 FSRQs for comparison with the 33 BBM blazars, we are left with 14 weak and 3 strong Mg ii absorption systems seen towards our 15 FSRQs, to be compared with the 19 weak and 13 strong Mg ii absorption systems detected towards the 33 BBM blazars. The two panels in Fig. 2 compare distributions for the redshift matched subsets of our FSRQs and BBM blazars, separately for the weak and strong Mg II absorption systems (recall that ‘associated systems’ having 0.017 have already been excluded, Sect. 3). The unpaired t-test probabilities that the distributions for blazars and FSRQs are drawn from the same parent population, are and for the weak and strong absorption systems, respectively. Here unpaired t-test is preferred over the KS-test, in view of the small sample size of the absorption systems, especially the strong systems. Thus, the difference between the strong absorption systems towards blazars and FSRQs appears statistically significant, although larger datasets would clearly be very desirable. As seen from Fig. 2 (right panel), the main contributor to the difference between the two distributions is the conspicuous presence of strong absorption systems for the BBM blazars at values up to 0.15. Interestingly, BBM have reported a similar excess of strong Mg ii absorption systems towards their blazars, in comparison to QSOs (their Fig. 4), which they interpret by postulating high-speed outflowing clouds of cool gas accelerated by the powerful blazar jets (Sect. 1). While the FSRQs studied here also possess powerful jets, the deficit of strong absorption systems at lower is still present, in comparison to blazars (Fig. 2 right panel). As noted above, a plausible way to reconcile this with the BBM hypothesis is then to consider the possibility that the FSRQ jets are less closely aligned to our direction, compared to the jets in the BBM blazars which are also powerful and expected (by definition) to be strongly polarized. Such an inference was indeed drawn by Valtaoja et al. (1992), based purely on their extensive radio flux monitoring data at centimeter wavelengths, which showed that, on average, low-polarization quasars (FSRQs) vary with a smaller amplitude and on longer time scale, compared to blazars (see, also, Orr & Browne 1982). One would then expect that any ultra-fast moving absorbing clouds accelerated by powerful FSRQ jets would mostly be out of the line of sight to the quasar nucleus. This suggestion can be tested by the analysis of Mg ii absorption systems towards steep-spectrum quasars whose jets are expected to be even less well aligned to our direction (e.g., Barthel 1999; Orr & Browne 1982).
Another hint favoring such an orientation based explanation comes from the radio properties of the small minority of FSRQs that have been detected with the Large Area Telescope (LAT) on board the Fermi Gamma-ray Space Telescope(see Linford et al. 2011). These authors find that the ray bright LAT FSRQs are extreme sources with higher core brightness temperature and greater core polarization, as well as larger (apparent) opening angle of the parsec-scale jets, than their non-LAT counterparts. Interpreting these differences, they have suggested that the ray loud FSRQs can be explained by Doppler boosting, but the jet orientation and/or speeds must be significantly different than for the ray quiet FSRQs (which show weaker polarization). This scenario would be consistent with the above assumption that the jets in our sample of (weakly polarized, hence non-blazar) FSRQs may be less closely aligned to the line of sight, in comparison to the similarly powerful jets in the BBM blazars. Although, such a bias may well explain the difference between the occurrence rates of strong Mg ii absorption towards powerful blazars and FSRQs/QSOs, further substantiation of this trend employing larger datasets would greatly strengthen the BBM scenario that strong Mg ii absorption systems may often be revealing the most extreme velocity outflows of cool gas clouds from powerful AGN, underscoring the need to investigate the wide-ranging theoretical implications of this phenomenon.
We thank an anonymous referee for the constructive criticism and helpful suggestions. We gratefully acknowledge the help from T. Parasakthi with the processed data for the quasars belonging to our dataset-4, and from Ravi Joshi in resolving some issues related to the archival data used here. Facilities: Keck Observatory Archive & ESO Science Archive Facility.
References
- Antonucci & Ulvestad (1985) Antonucci, R. R. J., & Ulvestad, J. S. 1985, ApJ, 294, 158
- Barthel (1999) Barthel, P. D. 1999, PASP, 162, 127
- Bergeron & Boissé (1991) Bergeron, J., & Boissé, P. 1991, A&A, 243, 344
- Bergeron et al. (2011) Bergeron, J., Boissé, P., & Ménard, B. 2011, A&A, 525, A51
- Bernet et al. (2010) Bernet, M. L., Miniati, F., & Lilly, S. J. 2010, ApJ, 711, 380
- Chand et al. (2004) Chand, H., Srianand, R., Petitjean, P., & Aracil, B. 2004, A&A, 417, 853
- Ellison et al. (2004) Ellison, S. L., Churchill, C. W., Rix, S. A., & Pettini, M. 2004, ApJ, 615, 118
- Gehrels (1986) Gehrels, N. 1986, ApJ, 303, 336
- Giustini et al. (2011) Giustini, M., Cappi, M., Chartas, G., et al. 2011, A&A, 536, A49
- Healey et al. (2007) Healey, S. E., Romani, R. W., Taylor, G. B., et al. 2007, ApJS, 171, 61
- Holt et al. (2008) Holt, J., Tadhunter, C. N., & Morganti, R. 2008, MNRAS, 387, 639
- Jorgenson et al. (2006) Jorgenson, R. A., Wolfe, A. M., Prochaska, J. X., et al. 2006, ApJ, 646, 730
- Linford et al. (2011) Linford, J. D., Taylor, G. B., Romani, R. W., et al. 2011, ApJ, 726, 16
- Massaro et al. (2009) Massaro, E., Giommi, P., Leto, C., et al. 2009, A&A, 495, 691
- Narayanan et al. (2007) Narayanan, A., Misawa, T., Charlton, J. C., & Kim, T.-S. 2007, ApJ, 660, 1093
- Orr & Browne (1982) Orr, M. J. L., & Browne, I. W. A. 1982, MNRAS, 200, 1067
- Prochter et al. (2006) Prochter, G. E., Prochaska, J. X., & Burles, S. M. 2006a, ApJ, 639, 766
- Prochter et al. (2006) Prochter, G. E., Prochaska, J. X., Chen, H.-W., et al. 2006b, ApJ, 648, L93
- Steidel et al. (1994) Steidel, C. C., Dickinson, M., & Persson, S. E. 1994, ApJ, 437, L75
- Sudilovsky et al. (2007) Sudilovsky, V., Savaglio, S., Vreeswijk, P., et al. 2007, ApJ, 669, 741
- Tejos et al. (2009) Tejos, N., Lopez, S., Prochaska, J. X., et al. 2009, ApJ, 706, 1309
- Tombesi et al. (2011) Tombesi, F., Cappi, M., Reeves, J. N., et al. 2011, ApJ, 742, 44
- Valtaoja et al. (1992) Valtaoja, E., Terasranta, H., Urpo, S., et al. 1992, A&A, 254, 80
- Vergani et al. (2009) Vergani, S. D., Petitjean, P., Ledoux, C., et al. 2009, A&A, 503, 771
- Véron-Cetty & Véron (2010) Véron-Cetty, M.-P., & Véron, P. 2010, A&A, 518, A10
- Wills & Browne (1986) Wills, B. J., & Browne, I. W. A. 1986, ApJ, 302, 56
| Quasar name | zema | f(4.8GHz) | magb | filterb | Weak systems | Strong systems | Ref. code | |||
| (mJy) | (see Table 1) | |||||||||
| J001130.5005551 | 2.308620 | -0.142 | 140 | 19.10 | V | 1.1656 | 0 | 1.1656 | 0 | 4 |
| J001602.4001225 | 2.086940 | -0.443 | 645 | 18.36 | V | 1.0823 | 0 | 1.0823 | 0 | 4 |
| J001708.5813508 | 3.366000 | -0.200 | 551 | 16.52 | V | 0.5544 | 0 | 0.5544 | 0 | 3 |
| J004057.6014632 | 1.178000 | -0.017 | 581 | 18.30 | O | 0.9942 | 1 | 0.9942 | 0 | 2 |
| J004201.2403039 | 2.478000 | 0.336 | 299 | 19.93 | P | 0.0114 | 0 | 0.7135 | 1 | 1 |
| ………. | ….. | … | … | ….. | . | …… | . | ….. | . | . |
| a Based on NASA/IPAC Extragalactic Database (NED). | ||||||||||
| b Based on Véron-Cetty & Véron(2010). | ||||||||||
| Note. The entire table for our sample of 115 FSRQs is available in on-line version. | ||||||||||
| Only a portion of this table is shown here to display its form and content. | ||||||||||
| FSRQ | zem | zabs | wr(2796Å) | f(4.8GHz) | SNR | Ref. code | |
| (Å) | (mJy) | per FWHM | (see Table 1) | ||||
| J004057.6-014632 | 1.1780 | 0.6828 | 0.02 | 581.0 | 22.2 | 2 | |
| J004201.2-403039 | 2.4780 | 0.8483 | 0.34 | 299.0 | ….. | 1 | |
| J005108.2-065002 | 1.9750 | 1.4919 | 0.08 | 841.0 | ….. | 1 | |
| J005108.2-065002 | 1.9750 | 1.5698 | 0.08 | 841.0 | ….. | 1 | |
| J024008.2-230916 | 2.2230 | 1.3652 | 0.46 | 3630.0 | 261.1 | 4 | |
| ………. | ….. | …… | …. | …… | ….. | . | |
| Note. The entire table of our total 75 Mg ii absorbers is available in on-line version. | |||||||
| Only a portion of this table is shown here to display its form and content. | |||||||