Chandra Observations of the Nuclear Star Cluster and
Ultraluminous X-ray Sources in NGC 2139
††footnotetext: Based in part
on observations made with the NASA/ESA Hubble Space Telescope, and
obtained from the Hubble Legacy Archive, which is a collaboration
between the Space Telescope Science Institute (STScI/NASA), the
Space Telescope European Coordinating Facility (ST-ECF/ESA), and the
Canadian Astronomy Data Centre (CADC/NRC/CSA).
Abstract
We report Chandra observations of the Scd galaxy NGC 2139, which is known to host a recently formed ( yrs) nuclear star cluster. The star cluster is undetected in X-rays, with an upper bound on 0.5-7 keV luminosity of erg s. This bound implies a bolometric accretion luminosity % of the Eddington luminosity for a black hole with the mass ( M) expected from extrapolation of the relation. The lack of X-ray emission indicates that a black hole, if present, is not undergoing significant accretion at the current time. While the central cluster is undetected, the data reveal a substantial population of bright X-ray point sources elsewhere in this galaxy, with eight qualifying as ultraluminous X-ray sources with erg s. We use archival Hubble Space Telescope images to identify candidate optical counterparts for seven Chandra sources, which in most cases have optical luminosities and spatial profiles consistent with star clusters. Compared with other galaxies, the number of luminous X-ray sources in NGC 2139 is larger by a factor of than expected based on its present star formation rate and stellar mass. This finding can be understood if NGC 2139 has concluded a burst of star formation in the recent past, and suggests that this galaxy could be important for testing the use of X-ray source populations as a chronometer of star formation history.
1 Introduction
Surveys with the Hubble Space Telescope (HST) and other facilities have demonstrated that the centers of galaxies commonly host a compact star cluster, a supermassive black hole, or both. Relative to star clusters found elsewhere, nuclear clusters (NCs) are very dense, massive, and often sites of multiple generations of star formation spanning a wide range of ages (Walcher et al., 2005, 2006). NCs are found in galaxies of all Hubble types. The sequence of events that lead to the formation of a NC is not well established; the processes that drive the genesis and early growth of supermassive black holes are similarly uncertain. The location and unusual properties of NCs invite speculation as to whether they have a role in the formation and growth of a central black hole. The coexistence of NCs and black holes in some objects has been discussed by e.g., Seth et al. (2008) and Graham & Spitler (2009).
An object of particular interest in this context is the Scd galaxy NGC 2139. A NC in this system was discovered in the HST snapshot survey of late-type galaxies by Böker et al. (2002). Follow-up spectroscopic analysis was carried out by Walcher et al. (2005, 2006) and Rossa et al. (2006) who obtained a mass estimate for the NC of M and a stellar population dominated by stars years old. Integral-field spectroscopy of the inner part of NGC 2139 reported by Andersen et al. (2008) indicated a 320-pc offset of the NC from the kinematic center of the galaxy. The NC’s youth and location just outside the nucleus led Andersen et al. to suggest that this system represents a NC in the making, as a relatively young cluster formed in the inner disk settles into the nucleus of this galaxy.
If the interpretation of NGC 2139 as a young NC system is correct, a natural follow-on question is whether the NC hosts a significant black hole. The measurements by Walcher et al. (2005, 2006) imply that the mass of any black hole must be significantly less than the cluster stellar mass; an analysis using Jeans models and the best fit stellar population implies an upper limit of M (Neumayer & Walcher, 2012). An intermediate-mass black hole thus remains a possibility. Such a black hole could reveal itself through radiative signatures if it is undergoing accretion; consequently it is of interest to look for indicators of an active galactic nucleus (AGN) associated with this system. Evidence of weak AGN activity has been found in a growing number of similar late-type galaxies with older NCs (e.g., Filippenko & Sargent, 1989; Shields et al., 2008; Satyapal et al., 2009; Desroches & Ho, 2009; McAlpine et al., 2011).
The optical spectra of the NC reported by Walcher et al. and Andersen et al. show emission lines but do not require an accretion source to explain them. The emission-line luminosity is consistent with the ionizing photon production rate predicted from the NC stellar population analysis, and the line ratios are consistent with emission from H II regions. The emission lines show rather broad wings on some of the forbidden lines (full width at zero intensity km s), but it seems likely that these are the result of outflows driven by massive stars. If an AGN is present, it is outshone in the optical bandpass by emission of stellar origin from the NC.
Measurements in the X-ray bandpass provide a sensitive alternative means for detecting weak AGN activity, and for this reason we carried out an observation of NGC 2139 using the Chandra X-ray Observatory, which we report here. The results have bearing on the possible presence of a massive black hole in NGC 2139 and provide additional information on energetic phenomena associated with this galaxy. In particular, the results reported here are of interest in providing constraints on the recent star formation history of this galaxy, as traced by X-ray point source populations. The number and luminosities of the stellar sources provide strong constraints on the amplitude and temporal progression of star formation activity. Extreme objects – ultraluminous X-ray sources (ULXs) – when present are of unique interest in tracing the highest mass accretion sources or other unusual phenomena emerging from a young stellar population.
2 Observations
We observed NGC 2139 with Chandra (ObsID 8196) (catalog ADS/Sa.CXO#obs/08196) using the ACIS instrument on 2007 June 17/18. The source was observed with the S3 chip with the detector operated in faint mode, for a total exposure time of 38549 s. The standard pipeline was used for data processing and event screening. Since we are primarily interested in point sources in the inner portion of this galaxy, we make use of measurements from this data set reported in the Chandra Source Catalog release 1.1 (catalog ADS/Sa.CXO#CSC) (CSC; Evans et al., 2010). Detection of CSC sources is based on the WAVDETECT algorithm (Freeman et al., 2002) with local background determination. The limiting detection significance employed corresponds to false source over the central field.
Within a 1′ radius centered on the NGC 2139 nucleus, the CSC lists 16 detected sources, with the properties presented in Table 1. This search radius encompasses the bulk of the optical galaxy, which has a disk scale length of kpc (Weinzirl et al., 2009). We note that NGC 2139 is not a member of an identifiable galaxy group or cluster. All of the detections are consistent with spatially unresolved point sources; within the portion of the detector used, the point-spread function has a 50% enclosed energy fraction radius of over the energies observed. The CSC provides fluxes for all of the sources assuming a power-law spectrum with photon index , corrected for absorption by the Galactic foreground HI column density of cm (Dickey & Lockman, 1990). Sources with at least 150 counts are also fit with a power-law spectrum with and absorbing column density left as free parameters. Intrinsic quantities listed in Table 1 are calculated assuming a distance of 23.6 Mpc as adopted in our earlier papers, which is based on a Virgo-infall-corrected recession velocity with km s (Böker et al., 2002). This distance falls at the low end of redshift-independent distances listed on the NASA Extragalactic Database, which span 24.0 to 36.3 Mpc for the same value of .
3 Results
3.1 The Nuclear Cluster
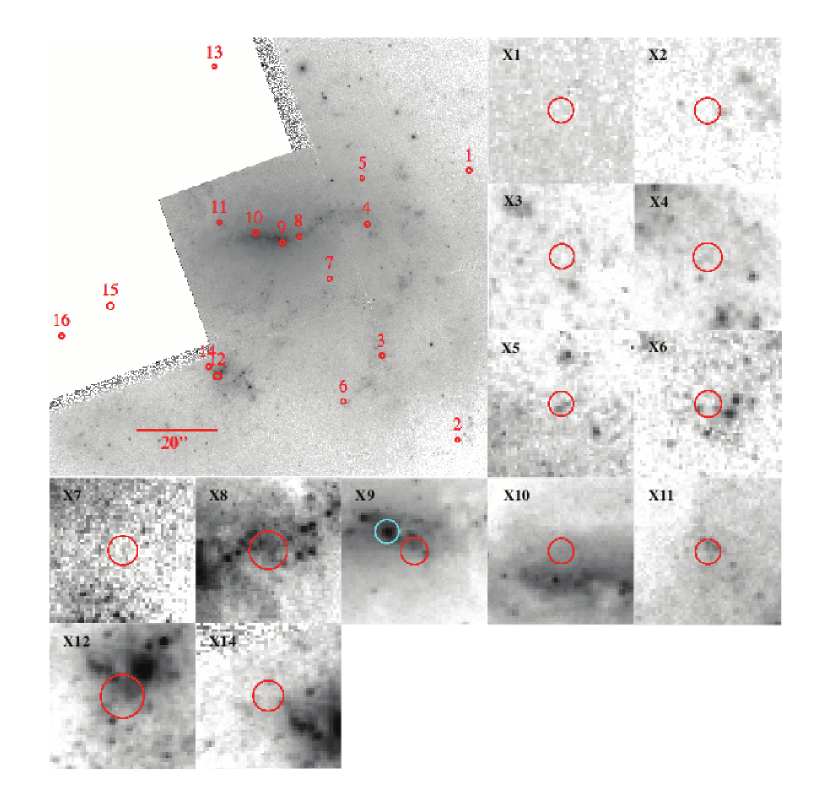
The relationship between optical and X-ray sources in NGC 2139 can be examined using archival HST images. Two WFPC2 images exist for this galaxy: the F814W image (catalog ADS/Sa.HST#hst_08599_26_wfpc2_f814w_wf) reported by Böker et al. (2002), and a second image obtained with the F300W filter (catalog hst_08632_28_wfpc2_f300w_wf). Both images are available as part of the Hubble Legacy Archive111http://hla.stsci.edu (HLA), with reprocessing that includes improved astrometry. Astrometric solutions for both the F814W and F300W images are available from 2MASS and GSC2 comparison sources in the field; astrometric solutions are computed separately for each bandpass and for each set of comparison sources. The HLA adopts the solution that minimizes residuals for the comparison source positions, with the result that the F814W solution is based on GSC2 sources and the F300W solution is based on the 2MASS sources. For both images, however, the GSC2 and 2MASS solutions are systematically offset by similar amounts, with the result that HLA astrometry for the F814W and F300W images is likewise offset; cross-correlation of the two implies Right Ascension and Declination for sources in the F300W image are larger by 031 and 007, respectively, than in F814W. Given this ambiguity we adopt the F814W solution along with its rms positional uncertainty of 04 in both RA and Dec, which is sufficient to encompass the measured offset.
The X-ray source positions overlaid on the F814W image are shown in Figure 1. Based on the HLA daophot source list for the F814W image, the NC is located at RA, Dec (J2000.0), which differs in declination by +09 from the position listed by Andersen et al. (2008) based on the original uncorrected astrometry. Chandra source X9 is located near the NC and might be considered a candidate counterpart. The 95% confidence error radius for X9 is 045; assuming a Gaussian probability profile, the 1- uncertainty radius would be 018. The NC and X9 are thus offset by , which suggests that the positions are genuinely different and the X-ray source is not associated with the NC. We note that adoption of the F300W HLA astrometric solution would increase the separation between the optical NC and X9. Based on the coordinates provided by Andersen et al. (2008), shifted as noted above, source X9 is offset from the galaxy’s kinematic center and from the galaxy’s photometric center.
The Chandra data can be used to place an upper bound on the NC X-ray luminosity. Measurement of counts within an appropriate aperture centered on the NC position is complicated by contamination by X9. We therefore measured counts within a 1″-radius aperture, excluding the quadrant between position angles where contamination is evident, and scaling by 4/3 to correct for this missing area. We measured the local background between radii of 12 and 5″ with regions selected to avoid contamination from X9 and X10. The result for the keV bandpass is 4 counts in the NC aperture and average background for the same area of 2.6 counts, which yields a Bayesian upper bound at 95% confidence of 6.8 counts for an actual source, assuming a constant nonnegative prior and Poisson likelihood (Kraft et al., 1991). We translated this result into a flux using the exposure time and the Portable Interactive Multi-Mission Simulator (PIMMS) version 3.9k. Assuming absorption by the Galactic foreground HI column density of cm (Dickey & Lockman, 1990) and a power-law spectrum for the source with , the result is erg s cm, corresponding to an upper bound on X-ray luminosity of erg s. If the NC follows the correlation between stellar velocity dispersion and black hole mass seen in other bulge-like systems (Gebhardt et al., 2000; Ferrarese & Merritt, 2000), the measured km s (Walcher et al., 2005) would predict M (Gültekin et al., 2009)222We note that the relationship between and in this regime is highly uncertain.. If we adopt a bolometric correction appropriate for low-luminosity AGNs (Ho, 2008) such that the bolometric luminosity , our upper bound translates into erg s, or where is the Eddington luminosity. A massive black hole, if present in the NC, does not manifest itself as a significant X-ray source and is evidently undergoing little accretion.
An additional question of interest is whether our upper bound on the luminosity of the NC is consistent with expectations based on its stellar content. As noted in §1, the NC is dominated by a young population and thus can be expected to produce stellar remnants generating significant X-ray emission. Population models by Sipior et al. (2003) for continuous star formation of 20 Myr duration predict a keV luminosity of erg s for an object with the age and mass of the NC, corresponding to a keV luminosity with of erg s, consistent with the lack of detection and upper bound reported above.
3.2 X-ray Source Properties
The X-ray sources that are detected in the Chandra observation are noteworthy for their number and properties. From Table 1, the faintest detected X-ray source has a keV flux of erg s cm, which corresponds to keV and keV fluxes of and erg s cm respectively for a power-law spectrum with typical of a quasar. At these flux levels, X-ray surveys predict an average of 0.6 and 1.0 sources within a circle of radius 1′ on the sky (e.g., Cappelluti et al., 2007), suggesting that the large majority of the 16 sources found within the same area centered on NGC 2139 are genuinely associated with that galaxy.
Luminosities calculated for the X-ray sources are listed in Table 1 and are in many cases large relative to typical X-ray binaries. Adopting the usual threshold for ultraluminous X-ray (ULX) sources of erg s implies that eight ULXs are present in NGC 2139. ULXs are relatively rare and the number we find in NGC 2139 is noteworthy; for comparison, the ULX catalog compiled by Liu & Mirabel (2005) lists only seven galaxies with eight or more ULXs. ULX sources have attracted attention since in at least some cases they seem to require accretion that is anisotropic, in excess of the Eddington limit, or powered by an intermediate-mass black hole.
Some insight into the spectral properties of the NGC 2139 sources can be obtained from hardness ratios, defined here as and , where are source counts in bandpasses following the CSC definitions of , , and keV, respectively. Hardness ratios and uncertainties were derived using the Bayesian procedure described by Park et al. (2006) and are listed in Table 1. The results are plotted in Figure 2 along with predictions for power-law spectra generated with PIMMS. The distribution of hardness ratios is similar to that found from other studies of luminous X-ray binaries (e.g., Colbert et al., 2004; Swartz et al., 2004), and in accord in most cases with power-law spectra described by photon indices of . The majority of sources are consistent with significant absorption by column densities cm, well in excess of the Galactic column, as found also in previous ULX studies. The impact of these parameter values on measured flux is modest, as can be seen from comparison of columns 8 and 11 in Table 1, listing flux estimates derived from the default CSC spectral parameters and from fits with unconstrained and . While some investigations have suggested a link between and (e.g., Winter et al., 2006), no trend between these quantities (indicated by the plotted curves and point sizes, respectively) is evident in Figure 2.
The CSC applies several tests for variability to detected sources. By these criteria none of the NGC 2139 sources show evidence of variability, with the exception of Sources 8 and 16 for the soft ( keV) bandpass only. Surveys of X-ray point sources of comparable luminosity in other galaxies show similarly modest evidence of variability over the timescales we sample (e.g., Zezas et al., 2006; Grimm et al., 2007; Ghosh et al., 2009). In the absence of variability the possibility exists that a source listed in Table 1 could be a compact group of multiple lower luminosity binaries that remains spatially unresolved in the Chandra image.
3.3 Optical Counterparts
The HST images described in §3.1 can be used to identify candidate optical counterparts for the detected X-ray sources, and we used the daophot source lists from the HLA for this purpose. Daophot source identification is optimized for point sources, with the result that some highly extended structures are not identified (e.g., see X5 in Fig. 1). Table 2 lists the results of source matching based on positional separations (i.e. 95% confidence) with errors in the optical and X-ray positions summed in quadrature. Sources in the two WFPC2 bandpasses are matched if their positions agree within , in which case a single entry with coordinates taken from the F814W image is listed. Three of the X-ray sources fall outside of the field of view for the WFPC2 images, and 7 of the remaining 13 have candidate optical counterparts. Five of the X-ray sources have more than one optical match; sources X8, X9, X10, and X11 fall along the central optical bar of the galaxy, where multiple clusters and knots of optical emission that likely trace recent star formation are evident. X12 is in a similarly complex region, resulting in six possible associations among the optical sources. Most of the candidate counterparts are detected in only one of the optical bandpasses.
The potential counterparts show diverse photometric properties, consistent with results from earlier studies of luminous X-ray sources in galaxies (e.g., Ptak et al., 2006; Ghosh et al., 2009). Photometry listed in Table 2 is given in AB magnitudes measured in apertures with radius 015. For comparison, the equivalent daophot measurements for the NC are and in F300W and F814W, respectively. The sources listed in Table 2 span a considerable range of brightness, and those detected in both bandpasses show a substantial range in color. Given NGC 2139’s distance modulus of 31.9 mag, most of the optical sources are probably too luminous to be single stars; the brightest known stellar counterparts to ULXs in other galaxies have absolute magnitudes of to (Roberts et al., 2008; Grisé et al., 2012) corresponding in the present case to apparent magnitudes of , well below our detection threshold. The optical sources in Table 2 are more likely star clusters. Supporting evidence for this conclusion is provided by the HLA daophot measurements, which flag the majority of the candidate counterparts as extended (Table 2) based on a concentration index. We note that as is often the case in studies of this type, there is considerable possibility for confusion within the existing data and it is difficult to assign a definitive correspondence between the X-ray sources and any of the objects listed in Table 2. Aside from their number, the ULXs in NGC 2139 have observational properties to the extent we can measure them that are similar to those for sources found elsewhere, and the same physical scenarios for their interpretation apply (§3.2).
3.4 The Host Galaxy and the X-ray Source Population
A number of studies have reported evidence for a link between star formation and the incidence of luminous X-ray point sources in galaxies (e.g., Eracleous et al., 2002; Kilgard et al., 2002; Swartz et al., 2004; Gilfanov et al., 2004; Liu et al., 2006), which can be understood as the manifestation of X-ray binaries created when massive stars in binary systems evolve into compact remnants that undergo accretion. Grimm et al. (2003) have argued that the resulting luminosity function of X-ray point sources can be used as an indicator of star formation rate in galaxies undergoing significant star formation. The cumulative luminosity function for the sources listed in Table 1 is shown in Figure 3, along with the universal luminosity function from Grimm et al. depicted with several scalings, suggesting a star formation rate of M yr.
Independent estimates of the star formation rate in NGC 2139 are available from measurements in other bandpasses. We calculated the far-infrared (FIR) luminosity using IRAS 60 and 100 m fluxes (Sanders et al., 2003) and the formula given by Rice et al. (1988), yielding erg s. We also obtained the H luminosity using the integrated flux, corrected for foreground Galactic absorption, measured by Moustakas & Kennicutt (2006), with the result that erg s. Based on the proportional relationships reported by Kennicutt (1998), and imply star formation rates of 1.2 and 1.7 M yr. Uncertainties in these estimates are likely dominated by systematic errors, and Kennicutt (1998) notes that different calibrations of the scaling relationships vary by %. Allowing for such uncertainties, both rates are lower than suggested by the X-ray source counts using the Grimm et al. (2003) relation.
The star formation rates obtained from and may be too low if significant reprocessed emission emerges outside the FIR bandpass, or if H is significantly attenuated by dust. Both of these considerations can be addressed using a formulation provided by Kennicutt et al. (2009) for correcting H luminosities for internal extinction using the total infrared (TIR) luminosity as an indicator of reprocessing by dust. We used their equation (12) with the TIR luminosity derived from IRAS 25, 60, and 100 m fluxes using equation (5) from Dale & Helou (2002) to obtain a corrected erg s, implying a star formation rate of M yr, or M yr if a 30% calibration error is adopted. This result is still rather low compared with the Grimm et al. (2003) findings. We note that all of these formulations for estimation of star formation rate assume a standard stellar initial mass function.
An older stellar population may contribute an important fraction of the observed X-ray sources. Colbert et al. (2004) obtained relationships predicting the total point-source X-ray luminosity in merger and spiral galaxies with an old-population contribution scaled from the galaxy’s -band luminosity . The NGC 2139 measurement by 2MASS (Skrutskie et al., 2006, 20 mag arcsec isophotal magnitude) implies erg s, which we combined with and Colbert et al.’s equation (4) to predict erg s ( keV). Summing the luminosities for the point sources listed in Table 1 yields a measured erg s, a factor of 10 larger than the predicted value. In estimating the young stellar population component, Colbert et al. use an value that is increased to include an estimate of unabsorbed ultraviolet luminosity derived from fitting the galaxy’s spectral energy distribution. We did not attempt this correction, but note that for the galaxies tabulated by Colbert et al. the UV contribution increases the luminosity of the young component by at most a factor of 2, which in the case of NGC 2139 would predict of at most erg s, still a factor of 6 below the observed value. We note that uncertainties in the distance to NGC 2139 do not affect these arguments since they rely on ratios of luminosity in different bandpasses; since our adopted distance is conservatively low (§2), we have if anything underestimated the number of ULXs. As a point of reference, we can follow Colbert et al. (2004) in estimating the stellar mass from the galaxy’s magnitude of 12.0 (de Vaucouleurs et al., 1991), the resulting color , and mass-to-light ratio of (Bell & de Jong, 2001), yielding M. To summarize the foregoing discussion, the observed number and luminosity of X-ray point sources in NGC 2139 is high in relation to other indicators of star formation or stellar mass, based on the trends seen in other galaxies.
The unusual number of luminous X-ray sources in NGC 2139 may imply that this galaxy is moving through a distinct phase when a major episode of star formation recently occurred but is in the process of shutting off. Colbert et al. (2004) found a small set of starburst galaxies with that exceeded their predicted values by up to a factor of . With , NGC 2139 has attributes of a starburst, and the excess is thus not surprising. Inspection of Digital Sky Survey images of this galaxy reveals an extension to the southeast that is suggestive of a recent interaction that might have triggered the starburst. Population synthesis models predict a maximum after the conclusion of a burst of star formation (Van Bever & Vanbeveren, 2000; Sipior et al., 2003), and spatial offsets between ULXs and H II regions may similarly trace a lag between peak star formation and maximum accretion luminosity (Swartz et al., 2009). The large number of luminous X-ray sources in NGC 2139 thus suggests that this galaxy could be in the final stages of a starburst. Alternatively, given that a large fraction of the detected point sources are ULXs and hence relatively exotic sources, NGC 2139 may probe a regime where the scaling relationships between star formation and normal high-mass X-ray binary behavior break down. In either circumstance, this galaxy presents a valuable test case for use of the X-ray source population as a star formation chronometer and for understanding the origins of ULXs.
4 Conclusions
The young NC in NGC 2139 does not show X-ray evidence for having formed a significant black hole. However, the NC may share a link to the many luminous extranuclear X-ray sources in NGC 2139 in that they are the products of a major starburst event within the past yr which is now subsiding. This example raises the question of whether an enhanced episode of large-scale star formation is important more generally for generation of NCs and their unusual properties. In NGC 2139 the question remains open as to what triggered a starburst. The large number of luminous X-ray sources relative to other indicators of star formation suggests that this galaxy may have unusual value for studying the temporal progression of radiative starburst signatures.
References
- Andersen et al. (2008) Andersen, D. R., Walcher, C. J., Böker, T., et al. 2008, ApJ, 688, 990
- Bell & de Jong (2001) Bell, E. F., & de Jong, R. S. 2001, ApJ, 550, 212
- Böker et al. (2002) Böker, T., Laine, S., van der Marel, R. P., et al. 2002, AJ, 123, 1389
- Cappelluti et al. (2007) Cappelluti, N., Hasinger, G., Brusa, M., et al. 2007, ApJS, 172, 341
- Colbert et al. (2004) Colbert, E. J. M., Heckman, T. M., Ptak, A. F., Strickland, D. K., & Weaver, K. A. 2004, ApJ, 602, 231
- Dale & Helou (2002) Dale, D. A., & Helou, G. 2002, ApJ, 576, 159
- Desroches & Ho (2009) Desroches, L.-B., & Ho, L. C. 2009, ApJ, 690, 267
- de Vaucouleurs et al. (1991) de Vaucouleurs, G., de Vaucouleurs, A., Corwin Jr., H. G., et al. 1991, Third Reference Catalog of Bright Galaxies (New York: Springer)
- Dickey & Lockman (1990) Dickey, J. M., & Lockman, F. J. 1990, ARA&A, 28, 215
- Eracleous et al. (2002) Eracleous, M., Shields, J. C., Chartas, G., & Moran, E. C. 2002, ApJ, 565, 108
- Evans et al. (2010) Evans, I. N., Primini, F. A., Glotfelty, K. J., et al. 2010, ApJS, 189, 37
- Ferrarese & Merritt (2000) Ferrarese, L., & Merritt, D. 2000, ApJ, 539, L9
- Filippenko & Sargent (1989) Filippenko, A. V., & Sargent, W. L. W. 1989, ApJ, 341, L11
- Freeman et al. (2002) Freeman, P., Kashyap, V., Rosner, R., & Lamb, D. Q. 2002, ApJS, 138, 185
- Gebhardt et al. (2000) Gebhardt, K., Bender, R., Bower, G., et al. 2000, ApJ, 539, L13
- Ghosh et al. (2009) Ghosh, K. K., Saripalli, L., Gandhi, P., et al. 2009, AJ, 137, 3263
- Gilfanov et al. (2004) Gilfanov, M., Grimm, H-J., & Sunyaev, R. 2004, MNRAS, 347, L57
- Graham & Spitler (2009) Graham, A. W., & Spitler, L. R. 2009, MNRAS, 397, 2148
- Grimm et al. (2003) Grimm, H.-J., Gilfanov, M., & Sunyaev, R. 2003, MNRAS, 339, 793
- Grimm et al. (2007) Grimm, H.-J., McDowell, J., Zezas, A., Kim, D.-W., & Fabbiano, G. 2007, ApJS, 173, 70
- Grisé et al. (2012) Grisé, F., Kaaret, P., Corbel, S., et al. 2012, ApJ, 745, 123
- Gültekin et al. (2009) Gültekin, K., Richstone, D. O., Gebhardt, K., et al. 2009, ApJ, 698, 198
- Ho (2008) Ho, L. C. 2008, ARA&A, 46, 475
- Kennicutt (1998) Kennicutt, R. C. 1998, ARA&A, 36, 189
- Kennicutt et al. (2009) Kennicutt, R. C., Hao, C.-N., Calzetti, D., et al. 2009, ApJ, 703, 1672
- Kilgard et al. (2002) Kilgard, R. E., Kaaret, P., Krauss, M. I., et al. 2002, ApJ, 573, 138
- Kraft et al. (1991) Kraft, R. P., Burrows, D. N., & Nousek, J. A. 1991, ApJ, 374, 344
- Liu et al. (2006) Liu, J.-F., Bregman, J. N., & Irwin, J. 2006, ApJ, 642, 171
- Liu & Mirabel (2005) Liu, Q. Z., & Mirabel, I. F. 2005, A&A, 429, 1125
- McAlpine et al. (2011) McAlpine, W., Satyapal, S., Gliozzi, M., et al. 2011, ApJ, 728, 25
- Moustakas & Kennicutt (2006) Moustakas, J., & Kennicutt, R. C. 2006, ApJS, 164, 81
- Neumayer & Walcher (2012) Neumayer, N., & Walcher, C. J. 2012, arXiv:1201.4950v1
- Park et al. (2006) Park, T., Kashyap, V. L., Siemiginowska, A., et al. 2006, ApJ, 652, 610
- Ptak et al. (2006) Ptak, A., Colbert, E., van der Marel, R. P., et al. 2006, ApJS, 166, 154
- Rice et al. (1988) Rice, W., Lonsdale, C. J., Soifer, B. T., et al. 1988, ApJS, 68, 91
- Roberts et al. (2008) Roberts, T. P., Levan, A. J., & Goad, M. R. 2008, MNRAS, 387, 73
- Rossa et al. (2006) Rossa, J., van der Marel, R. P., Böker, T., et al. 2006, AJ, 132, 1074
- Sanders et al. (2003) Sanders, D. B, Mazzarella, J. M., Kim, D.-C., Surace, J. A., & Soifer, B. T. 2003, AJ, 126, 1607
- Satyapal et al. (2009) Satyapal, S., Böker, T., Mcalpine, W., et al. 2009, ApJ, 704, 439
- Seth et al. (2008) Seth, A., Agüeros, M., Lee, D., & Basu-Zych, A. 2008, ApJ, 678, 116
- Shields et al. (2008) Shields, J. C., Walcher, C. J., Böker, T., et al. 2008, ApJ, 682, 104
- Sipior et al. (2003) Sipior, M. S., Eracleous, M., & Sigurdsson, S. 2003, arXiv:astro-ph/0308077
- Skrutskie et al. (2006) Skrutskie, M. F., Cutri, R. M., Stiening, R., et al. 2006, AJ, 131, 1163
- Swartz et al. (2004) Swartz, D. A., Ghosh, K. K., Tennant, A. F., & Wu, K. 2004, ApJS, 154, 519
- Swartz et al. (2009) Sartz, D. A., Tennant, A. F., & Sorai, R. 2009, ApJ, 703, 159
- Van Bever & Vanbeveren (2000) Van Bever, J., & Vanbeveren, D. 2000, A&A, 358, 462
- Walcher et al. (2006) Walcher, C. J., Böker, T., Charlot, S., et al. 2006, ApJ, 649, 692
- Walcher et al. (2005) Walcher, C. J., van der Marel, R. P., McLaughlin, D., et al. 2005, ApJ, 618, 237
- Weinzirl et al. (2009) Weinzerl, T., Jogee, S., Khochfar, S., Burkert, A., & Kormendy, J. 2009, ApJ, 696, 411
- Winter et al. (2006) Winter, L. M., Mushotzky, R. F., & Reynolds, C. S. 2006, ApJ, 649, 730
- Zezas et al. (2006) Zezas, A., Fabbiano, G., Baldi, A., et al. ApJS, 166, 211


| No. | R.A. | Dec. | Counts | |||||||||
|---|---|---|---|---|---|---|---|---|---|---|---|---|
| (1) | (2) | (3) | (4) | (5) | (6) | (7) | (8) | (9) | (10) | (11) | (12) | (13) |
| 1 | 6 01 05.02 | 40 06.76 | 0.42 | 200 | ||||||||
| 2 | 6 01 05.19 | 41 01.99 | 0.43 | 115 | ||||||||
| 3 | 6 01 06.33 | 40 44.78 | 0.42 | 119 | ||||||||
| 4 | 6 01 06.54 | 40 17.63 | 0.48 | 42 | ||||||||
| 5 | 6 01 06.61 | 40 08.33 | 0.41 | 351 | ||||||||
| 6 | 6 01 06.90 | 40 54.13 | 0.44 | 89 | ||||||||
| 7 | 6 01 07.10 | 40 28.88 | 0.49 | 29 | ||||||||
| 8 | 6 01 07.56 | 40 20.30 | 0.64 | 16 | ||||||||
| 9 | 6 01 07.81 | 40 21.51 | 0.45 | 70 | ||||||||
| 10 | 6 01 08.22 | 40 19.53 | 0.42 | 120 | ||||||||
| 11 | 6 01 08.75 | 40 17.44 | 0.41 | 390 | ||||||||
| 12 | 6 01 08.78 | 40 48.92 | 0.73 | 20 | ||||||||
| 13 | 6 01 08.83 | 39 45.57 | 0.42 | 224 | ||||||||
| 14 | 6 01 08.92 | 40 46.96 | 0.51 | 33 | ||||||||
| 15 | 6 01 10.38 | 40 34.59 | 0.58 | 22 | ||||||||
| 16 | 6 01 11.11 | 40 40.63 | 0.48 | 58 |
Note. — Col. (1): X-ray source number. Cols. (2) and (3): J2000 coordinates. Col. (4): 95%-confidence positional uncertainty radius in arcseconds. Col. (5): X-ray counts, keV. Cols. (6) and (7): Hardness ratios and 95% confidence error bars. Col. (8): Flux in units of erg s cm ( keV), assuming a power-law spectrum with corrected for foreground Galactic absorption. Col. (9): Luminosity ( keV) in units of erg s derived from flux in Col. (8). Col. (10) – (13): Results of power-law spectral fit with and (in units of cm) as free parameters; flux and luminosity with units as in Cols. (8) and (9).