Observational Constraints on the Molecular Gas Content in Nearby Starburst Dwarf Galaxies111Based on observations made with the NASA/ESA Hubble Space Telescope, obtained from the Data Archive at the Space Telescope Science Institute, which is operated by the Association of Universities for Research in Astronomy, Inc., under NASA contract NAS 5-26555.
Abstract
Using star formation histories derived from optically resolved stellar populations in nineteen nearby starburst dwarf galaxies observed with the Hubble Space Telescope, we measure the stellar mass surface densities of stars newly formed in the bursts. By assuming a star formation efficiency (SFE), we then calculate the inferred gas surface densities present at the onset of the starbursts. Assuming a SFE of 1%, as is often assumed in normal star-forming galaxies, and assuming that the gas was purely atomic, translates to very high Hi surface densities ( M⊙ pc-2), which are much higher than have been observed in dwarf galaxies. This implies either higher values of SFE in these dwarf starburst galaxies or the presence of significant amounts of H2 in dwarfs (or both). Raising the assumed SFEs to 10% or greater (in line with observations of more massive starbursts associated with merging galaxies), still results in Hi surface densities higher than observed in 10 galaxies. Thus, these observations appear to require that a significant fraction of the gas in these dwarf starbursts galaxies was in the molecular form at the onset of the bursts. Our results imply molecular gas column densities in the range cm-2 for the sample. In those galaxies where CO observations have been made, these densities correspond to values of the COH2 conversion factor (XCO) in the range cm-2 (K km s-1)-1, or up to greater than Galactic XCO values.
Subject headings:
galaxies: starburst – galaxies: dwarf – galaxies: evolution1. Introduction
Star formation rates (SFRs) are known to correlate with the surface density of cold gas. This correlation, commonly referred to as the Kennicutt-Schmidt law, was seen using star formation (SF) and gas tracers integrated on galaxy scales (Schmidt, 1959; Kennicutt, 1989, 1998b). The direct correlation of SF and molecular gas has been seen on sub-galactic spatial scales as well, using maps of atomic and molecular gas (e.g., Martin & Kennicutt, 2001; Wong & Blitz, 2002; Bigiel et al., 2008; Rahman et al., 2012). However, the variables and conditions that govern when and how much gas is converted into stars remains unclear (e.g., Tan, 2000; Martin & Kennicutt, 2001; Wong & Blitz, 2002; Leroy et al., 2008, and references therein). In addition, the role atomic Hi gas plays in driving the SFR is also poorly understood, particularly in dwarf and low surface brightness galaxies which lack significant CO detections that trace molecular gas (e.g., Taylor et al., 1998; O’Neil et al., 2003; Leroy et al., 2005, and references therein).
While most studies approach this analysis based on the current SFRs and gas surface densities, studies of optically resolved stellar populations can provide a longer temporal baseline by probing the SF as a function of time (i.e., SFR(t)). Using Hubble Space Telescope () observations, McQuinn et al. (2010a, b) reconstructed the star formation histories (SFHs) of 19 nearby, starburst dwarf galaxies. These temporally resolved SFHs enable a calculation of the total stellar mass of stars newly formed in these systems over the duration of the burst events (i.e., a few 100 Myr). As the stellar mass was formed from the gas reservoirs of the galaxies, this calculation provides a way to estimate the gas surface densities present when the star forming episode began.
One way to quantify the amount of gas that is converted into stars is through the star formation efficiency (SFE) parameter, which estimates the fraction of gas that is converted into stars in a given area during a fiducial time period. The SFE defined in this way is dimensionless and based on the direct connection between gas and the stars formed from the gas. Models of SF, based on different SF laws and SF thresholds, assume different SFEs in their calculations, or conversely, predict SFEs given a set of inputs (e.g., Tan, 2000; Parmentier & Fritze, 2009; Côté et al., 2011). Measurements of the SFE are problematic, as the measurements of the gas being converted into stars and of the stars produced from that gas cannot be made simultaneously. In practice, observations of SFEs usually assume typical observed gas surface densities or gas surface densities in the vicinity of recent star formation.
SFE’s have been studied in a variety of galaxy types and environments including, in order of increasing SFRs, dwarf galaxies (Bigiel et al., 2008), normal disk galaxies (Kennicutt, 1998b; Bigiel et al., 2008; Rahman et al., 2012), luminous infrared galaxies (Young et al., 1986; Solomon & Sage, 1988; Sanders et al., 1991), and massive starburst galaxies (Kennicutt, 1998b). The SFE values range from % to values approaching % in massive starbursts (Kennicutt, 1998b), with the majority of normal star forming galaxies (i.e., dwarfs and spirals) having lower SFEs in the % range. SFEs higher than 10% have been reported in more massive starburst galaxies (e.g., Young et al., 1986; Solomon & Sage, 1988; Kennicutt, 1998b; Sanders et al., 1991; Bigiel et al., 2008), possibly as a result of higher gas densities according to the Kennicutt-Schmidt Law. However, on small physical scales SFEs have also been argued to be roughly invariant in any supersonically turbulent medium (Krumholz & McKee, 2005).
In this study, we use SFHs derived from resolved stellar populations in 19 nearby, Hi dominated, starburst dwarf galaxies (McQuinn et al., 2010a, b) in order to investigate the gas content in these galaxies prior to their bursts. For the derived stellar mass surface densities of the stars formed in the bursts, we assume different SFEs to infer the gas surface densities present at the onset of the starbursts. Further, we investigate the implications these gas surface densities have for the amount molecular gas that may have been present in these systems. The paper is organized as follows. §2 summarizes the observations, data processing, and SFH reconstruction technique. §3 calculates the surface density both of the SFR and of the stellar mass. §4 applies different SFEs to infer the gas surface densities present when the starbursts began and §5 estimates COH2 conversion factors. §6 summarizes our conclusions.
2. The Galaxy Sample, Stellar Populations, and SFHs
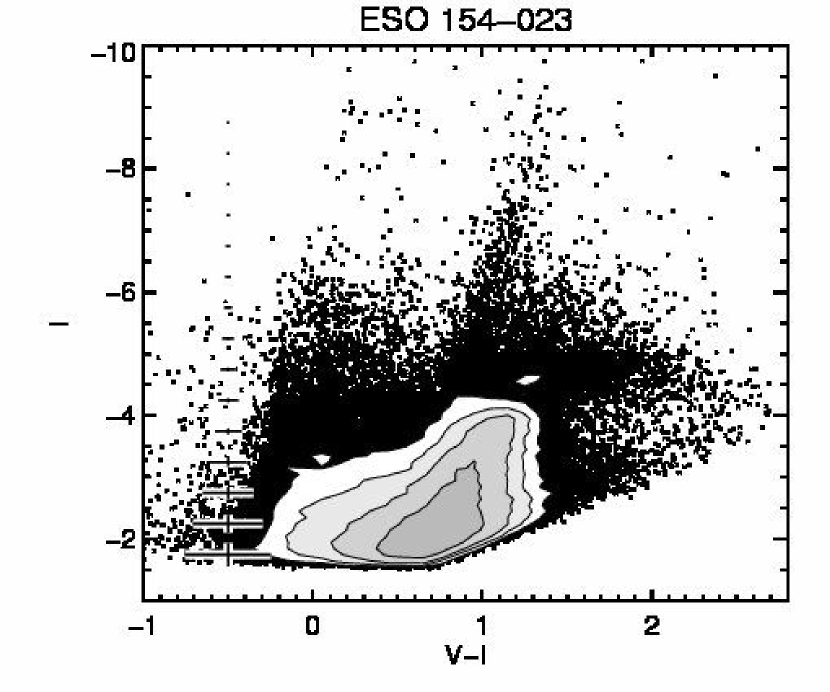
In Table Observational Constraints on the Molecular Gas Content in Nearby Starburst Dwarf Galaxies111Based on observations made with the NASA/ESA Hubble Space Telescope, obtained from the Data Archive at the Space Telescope Science Institute, which is operated by the Association of Universities for Research in Astronomy, Inc., under NASA contract NAS 5-26555. we summarize various physical properties of the 19 nearby starburst dwarf galaxies that comprise our sample. This sample was previously studied by McQuinn et al. (2010a, b, and references therein) using archival V and I band observations from either the Advanced Camera for Surveys or Wide Field Planetary Camera 2 instruments. The galaxies all lie close enough for the observations to resolve the stellar populations into individual stars (i.e., D Mpc). A full description of the observations and data processing can be found in McQuinn et al. (2010a). For this paper we use the McQuinn et al. (2010a) photometry, which was measured by DOLPHOT or HSTphot (Dolphin, 2000) from the pipeline processed and cleaned images. In Figure 1, we present an example of the photometric quality in the color magnitude diagram (CMD) for ESO 154023, whose data reach our minimum required photometric depth. Representative uncertainties are shown per magnitude by crosses in the left hand side of the CMD. CMDs can be found in McQuinn et al. (2010a, Figure 2) for the majority of the sample and in Weisz et al. (2008) for two galaxies (DDO 165 and Ho II).
The SFHs (i.e., the rate of star formation across time ) were reconstructed by McQuinn et al. (2010a) by fitting the observed CMDs (Dolphin, 2002). This well established technique uses stellar evolutionary models (Marigo & Girardi, 2007) to model the observed CMD as a linear combination of different age and metallicity stellar populations for an assumed initial mass function (IMF). As described in McQuinn et al. (2010a), the SFHs were reconstructed assuming a binary fraction of 0.35 and a Salpeter IMF (Salpeter, 1955), and allowing the models to fit for distance and extinction. The metallicity was constrained to increase with time, except in cases where the photometry reached a full magnitude below the red clump. For a full discussion of the SFHs, the time binning used, and uncertainties we refer the reader to McQuinn et al. (2010a). We scaled down the SFRs by a factor of 1.59 (Bruzual & Charlot, 2003) to transform the results to a Kroupa IMF (Kroupa, 2001), thus enabling a direct comparison with other studies in the literature on SFR and SFR densities (e.g., Bigiel et al., 2008).
In Figure 2, we present an example of the resulting SFH of ESO 154023 over the last 3 Gyr. For this starburst system, the recent SFRs are elevated over the average value during the most recent Myr (McQuinn et al., 2010b). This pattern of sustained elevated SFRs at recent times is seen across the starburst sample. For the current analysis, we focus on measuring the SFR surface density over the duration of the starbursts, and on calculating the stellar mass surface density for the stars formed during the same time period.

3. Stellar Mass Surface Densities of Newly Formed Stars
SF intensity is frequently parameterized by calculating the SFR surface density, SFR area-1 (M⊙ yr-1 kpc -2) (e.g., Meurer et al., 1997; Lanzetta et al., 2002; Kennicutt et al., 2005). This calculation of depends upon the timescale over which one measures the SFRs. For example, the SFR calculated from H flux (e.g., Kennicutt, 1998a; James et al., 2004) is the SFR averaged over the past few Myr, whereas the SFR calculated from UV emission (Meurer et al., 1997) is an average over the past few hundred Myr. If the SFR remains constant over the two time periods, the averages are equivalent, but variations in the SFR over time can make the different values difficult to compare. The optically resolved stellar populations and temporally resolved SFHs allow us to select the timescale over which to calculate . We chose to calculate over the duration of a burst (see Figure 2). The durations and SFRs averaged over these timescales, listed in Table Observational Constraints on the Molecular Gas Content in Nearby Starburst Dwarf Galaxies111Based on observations made with the NASA/ESA Hubble Space Telescope, obtained from the Data Archive at the Space Telescope Science Institute, which is operated by the Association of Universities for Research in Astronomy, Inc., under NASA contract NAS 5-26555., were compiled from McQuinn et al. (2010b).
There are a number of possible choices for normalizing the SFR to a fiducial area. In nearby systems, both James et al. (2004) and Kennicutt et al. (2005) use the area of the currently active star forming regions as traced by H emission. The calculated in this way follows a Gaussian distribution for nearby galaxies ranging from to M⊙ yr-1 kpc-2, with massive starburst galaxies generally falling in an extended tail of the distribution above M⊙ yr-1 kpc-2. Alternatively, the area has been defined as the half-light radius of a galaxy in the UV (i.e., radius kpc; Meurer et al., 1997), or as the optical disk of a galaxy measured to the B-band 25 mag arcsec-2 isophotal radius (i.e., radius kpc scales; Schmidt, 1959; Kennicutt, 1998b). In a comparative study using Hi, UV, and optical data, Wyder et al. (2009) use the minimum area for which all wavelengths showed a detection and the was calculated using an average SFR based on UV surface brightness over the adopted area.
Over the duration of a starburst, in many dwarf galaxies, SF has been shown to be widely distributed across the disks of the galaxies, rather than solely concentrated at the very center (McQuinn et al. in prep.). Therefore, for this study, we use the optical extent of the galaxies included in the observational fields of view. The calculated from this area represents a measurement of the SF activity in the optical disk over the life of a starburst. These values could potentially be compared with SFR surface densities calculated for high redshift bursting dwarf galaxies, should observations of this type become available. Note that for our analysis of , this choice in area represents a conservative assumption. In addition, if the gas is assumed to be clumped (as expected), then this will result in even higher values of precursor gas surface density.
The optical areas of the galaxies were calculated based on the major diameter measured from the extent of the B-band 25 mag arcsec-2 isophotal radius and the ellipticity of the galaxy (e.g., D25; Karachentsev et al., 2004, see Table 1). These D25 measurements were corrected for inclination angle and Galactic extinction following the prescription by de Vaucouleurs et al. (1976). Included in Table Observational Constraints on the Molecular Gas Content in Nearby Starburst Dwarf Galaxies111Based on observations made with the NASA/ESA Hubble Space Telescope, obtained from the Data Archive at the Space Telescope Science Institute, which is operated by the Association of Universities for Research in Astronomy, Inc., under NASA contract NAS 5-26555. are the deprojected D25 areas covered by the fields of view and the equivalent areas in kpc2 for the sample, accounting for distance to the system. In eleven galaxies, the observational field of view covered the extent of the galaxy out to the D25 limits. In the remaining cases, the angular area of the observations did not extend to this surface brightness limit. For these galaxies, we normalized the SFR by the area covered by the observations corrected for inclination. We discuss the impact of these smaller fields of view on our results below.
In Figure 3, we present a histogram of our measured ranging from to M⊙ yr-1 kpc-2. Values for individual galaxies are listed in Table 2. The range of values in this starburst sample is lower than the 0.1 M⊙ yr-1 kpc-2 threshold set for starbursts in more massive galaxies based on H derived SFRs (Kennicutt et al., 2005). is generally higher in more massive disk galaxies (Kennicutt, 1998b; Bigiel et al., 2008). However, values from different studies are difficult to compare as the adopted areas and the methods of measuring the SFRs often vary.

The total stellar mass formed during the bursts can be calculated directly from the SFHs by integrating the SFRs(t) over the duration of the bursts. Applying the same de-projected physical areas in Table Observational Constraints on the Molecular Gas Content in Nearby Starburst Dwarf Galaxies111Based on observations made with the NASA/ESA Hubble Space Telescope, obtained from the Data Archive at the Space Telescope Science Institute, which is operated by the Association of Universities for Research in Astronomy, Inc., under NASA contract NAS 5-26555., we calculate the stellar mass surface density of stars formed during the burst (), ranging from 0.2 to 13 M⊙ pc-2. Values for individual galaxies are listed in Table 2. For the galaxies where the observational field of view did not reach the isophotal radius of 25 mag arcsec-2, our analysis applies to only the central regions of the systems. The difference between this central value of the stellar mass surface density of the newly formed stars and the value for the entire optical disk is difficult to estimate as the SFRs in the outer regions of galaxies do not scale linearly with area. This may be an important difference in the three galaxies where the field of view covers less than half of the optical disk (see Table Observational Constraints on the Molecular Gas Content in Nearby Starburst Dwarf Galaxies111Based on observations made with the NASA/ESA Hubble Space Telescope, obtained from the Data Archive at the Space Telescope Science Institute, which is operated by the Association of Universities for Research in Astronomy, Inc., under NASA contract NAS 5-26555.), but will not impact our results significantly in the remaining systems. Note also that the stellar mass values are dependent on the form of the IMF assumed in deriving the SFHs. If we adopted a Salpeter IMF (Salpeter, 1955), these stellar mass values would be larger by a factor of 1.59.
4. SFEs and Inferred Initial Gas Surface Densities
Having measured , we can infer the hydrogen gas surface density (hereafter ) present at the onset of the starbursts, for an assumed SFE and an assumed primordial Helium abundance of 1.33 (Cyburt et al., 2008; Komatsu et al., 2011). This simple model assumes that the initial hydrogen gas mass is a multiple of the stellar mass formed in the burst in the stars (i.e., SFE). The SFEs in dwarf galaxies are typically between %, comparable to the SF in outer disks of spiral galaxies. However, while the starburst dwarf galaxies in our sample have low masses and low metallicities typical of dwarf galaxies, their are comparable to or higher than the values of for typical spiral galaxies which show SFEs between % (Bigiel et al., 2008; Rahman et al., 2012).
Based on the previous results for both dwarf and spiral galaxies, we might expect SFEs for our sample to lie in the range of %. Starting with the lower limit SFE value of , typical of the lower SFRs typically found in the outer regions of spirals and in dwarf galaxies (Kennicutt, 1998b; Bigiel et al., 2008), the inferred ranges from M⊙ pc-2. However, if we assume that the ISMs in these dwarf galaxies are Hi dominated, as suggested by observations (e.g., Leroy et al., 2008), this derived range of gas surface densities includes densities far greater than any Hi gas surface densities observed to date. The typical value of the maximum observed in dwarf galaxies is limited to the range of M⊙ pc-2 (Swaters et al., 2002) with a sharp saturation at M⊙ pc-2 (Wong & Blitz, 2002; Bigiel et al., 2008) when measured on sub-kpc scales. These numbers will be lower if averaged over larger physical scales. The implication is that the SFE must be higher than 1%, or that not all of the hydrogen is in the atomic phase (or both). Because the highest stellar mass surface densities of newly formed stars derived assuming a SFE of 1% are roughly 100 times larger than the highest observed HI surface mass densities, solving this problem would require SFEs of order 100%, which are very unlikely.
Atomic hydrogen gas surface densities higher than any observed would be possible if the triggering event of the starburst provided additional gas to the systems (Ekta & Chengalur, 2010), temporarily increasing far above what is typically observed in Hi. As none of the galaxies in the sample show evidence of an obvious merger, gas infall would be the most likely source of the additional mass. However, Hi maps, available for roughly half of the sample (Begum et al., 2008; Bigiel et al., 2008; Warren et al., in prep), do not show highly disturbed Hi morphologies, as would be expected from a gas infall event. We will go forward assuming a higher SFE of 10% and see what that implies about the gas surface densities and the molecular gas fractions.
Figure 4 shows the relationship between the observed SFR surface density and the inferred gas surface density with an assumed SFE of . The points deviate from a straight line because systems with similar average SFR densities can have different stellar mass surface densities of recently formed stars depending on the duration of each burst. While 5 galaxies host “fossil” bursts, the remaining 14 host on-going starburst activity. Thus, many of the gas surface density values will increase as the bursts mature. Figure 4 demonstrates that even with a higher SFE of 10%, half the sample have inferred that exceed any observed atomic hydrogen gas surface densities to date ( M⊙ pc-2; Swaters et al., 2002; Wong & Blitz, 2002; Bigiel et al., 2008). Conversely, if we assume that is M⊙ pc-2 based on Hi observations, we infer a minimum SFE of 3% and a maximum SFE far exceeding 100%. Thus, it appears that the calculated stellar mass surface densities of newly formed stars imply that the typical dwarf galaxy has a significant reservoir of molecular hydrogen.

Assuming the initial gas mass is some combination of atomic and molecular gas, the values of the inferred seen in Figure 4 suggest that a significant fraction of the gas is in molecular form in 10 of the galaxies. If we adopt both a SFE of 10% and a M⊙ pc-2, then the inferred molecular gas surface density () ranges from M⊙ pc-2 or an equivalent average H2 column density of cm-2; values for the individual galaxies are listed in Table 2. This range would be higher if a lower SFE were assumed (this is likely the case for the systems with log ). Our estimated values of are averages for the optical disk; regions of even higher molecular gas densities would be expected in star-forming regions.
Our inferred can be compared with known measurements of in more massive disk galaxies with similar . For example, has been measured to range from M⊙ pc-2 in the inner regions of lower metallicity spiral galaxies (Bigiel et al., 2008; Leroy et al., 2011). Somewhat higher H2 column density estimates of up to cm-2 (i.e., 100 M⊙ pc-2) have been found in the SMC from infrared dust measurements on 200 pc scales (Bolatto et al., 2011). In the central regions of 14 normal spiral galaxies, Rahman et al. (2012) have measured to range from M⊙ pc-2, however giant molecular clouds in the Milky Way have a mean hydrogen molecular gas surface density of 42 M⊙ pc, with variations up to M⊙ pc-2 (Heyer et al., 2009). Based on these comparisons, the estimated values of (ranging from M⊙ pc-2) and the corresponding fraction of molecular to total gas are in agreement with molecular gas surface densities and with molecular to atomic ratios measured in galaxies with similar . In addition, the typical timescale to deplete the molecular gas by star formation in a disk galaxy is Gyr (Bolatto et al., 2011; Rahman et al., 2012). This depletion timescale is up to longer than the duration of the starburst events indicating that typical disk galaxies will contain sufficient reservoirs of molecular gas over the timescales of a starburst to fuel and sustain the elevated levels of SF.
5. Limits on the CO-H2 Conversion Ratio
While the atomic Hi component of galaxies is easily measured using 21 cm observations, the molecular H2 component is generally measured indirectly by measuring emission from the CO molecule and then inferring a ratio of the CO to H2 molecules (i.e., the CO-H2 conversion factor, XCO). Estimating H2 masses from CO emission has proven more difficult in dwarf galaxies for two reasons. First, there are well known difficulties in detecting molecular gas in low metallicity environments (e.g., Bolatto et al., 2008, and references therein). Since few dwarf galaxies have CO emission detections, conversions from CO emission to H2 masses are often only upper limits. Second, XCO is uncertain for low metallicity systems. Historically, XCO was based on measurements at higher metallicities and application to lower metallicity systems was uncertain. Indeed, the conversion factor has been measured to be a strong function of metallicity below 12log(O/H) (Leroy et al., 2011), the upper end of the metallicity range of our sample. Thus, even in cases with CO emission detections, conversion to an H2 mass is uncertain for low metallicity dwarfs.
We can constrain the values of XCO for a few systems in our sample by combining our inferred values of with confirmed CO detections (or limits on the CO emission) from the literature. While most galaxies in our sample have very low metallicities (i.e., 12log (O/H); see Table Observational Constraints on the Molecular Gas Content in Nearby Starburst Dwarf Galaxies111Based on observations made with the NASA/ESA Hubble Space Telescope, obtained from the Data Archive at the Space Telescope Science Institute, which is operated by the Association of Universities for Research in Astronomy, Inc., under NASA contract NAS 5-26555. for individual values) where CO is completely non-detected (e.g., Taylor et al., 1998), a few of the more luminous galaxies in our sample with somewhat higher metallicities (i.e., 12 log(O/H) ) do have CO detections (e.g., NGC 1569, Young et al. (1984); NGC 4449 and NGC 4214, Tacconi & Young (1985); NGC 5253, Turner et al. (1997); NGC 6822, Wilson (1992)). In Table 2, we list confirmed CO detections from the literature for five galaxies and CO upper limits for an additional three galaxies. Using these CO observations and our estimates of N in the galaxies with inferred molecular gas content, we calculate XCO to range from () cm-2/(K km s-1). The lower end of this range is greater than Galactic measurements while the upper end is greater. These estimated values of XCO are in agreement with measured values of and cm-2/(K km s-1) found for two dwarf galaxies in the Local Group from infrared dust emission (Leroy et al., 2011) and the lower limit of Galactic XCO values placed on a low metallicity (12[O/H]) Local Group dwarf galaxy DDO 154 (Komugi et al., 2011).
Since nearby, metal poor, dwarf galaxies are often considered the prototypes of more massive galaxies at high redshift, it is also interesting to compare our estimated XCO values to measurements in low metallicity systems at high redshift. In a sample of star forming galaxies in the mass range M⊙, one to two orders of magnitude more massive than any of the galaxies in our sample, Genzel et al. (2012) found the CO luminosity to molecular gas mass conversion factors to be Galactic values in a metallicity range of 12[O/H] , with higher values expected in lower mass galaxies. For comparison, for the lower mass galaxies in our sample which span the range in metallicities from [O/H] (see Table Observational Constraints on the Molecular Gas Content in Nearby Starburst Dwarf Galaxies111Based on observations made with the NASA/ESA Hubble Space Telescope, obtained from the Data Archive at the Space Telescope Science Institute, which is operated by the Association of Universities for Research in Astronomy, Inc., under NASA contract NAS 5-26555.), our estimated XCO factors include values up to greater than Galactic XCO values.
6. Conclusions
We have used optical imaging of resolved stellar populations obtained from the data archive to measure the SFRs and stellar mass surface densities of stars formed during starburst events in a sample of 19 nearby starburst dwarf galaxies. The SFR surface densities of these dwarf galaxies are comparable to the higher end of SFR surface densities of more massive spiral galaxies while still having low metallicities typical of dwarf systems.
By assuming different SFEs, the stellar mass surface densities were used to infer gas surface densities present at the onset of the bursts. Using a SFE of 1% and assuming , all inferred gas surface densities are greater than the observed range of Hi gas surface densities in dwarf galaxies of M⊙ pc-2 (Swaters et al., 2002; Wong & Blitz, 2002; Bigiel et al., 2008). Using a higher SFE of 10%, half of the inferred gas surface densities are still higher than the observed range of by factors of 9.
The simplest explanation appears to be that a significant fraction of the gas is in molecular form but remains unobserved in most of these galaxies due to their low metallicities. Indeed, the elevated levels of recent SF are an unambiguous sign that our sample of galaxies have hosted significant reservoirs of cold molecular gas. In this low metallicity regime, the H2 masses can be significant, even for very low CO luminosities. Thus, the lack of CO detections in our sample is not inconsistent with their having significant reservoirs of molecular gas. Coupled with limits on CO emission from the literature, the inferred molecular gas surface densities suggest XCO factors of up to greater than Galactic measurements in these low metallicity and low mass galaxies.
7. Acknowledgments
Support for this work was provided by NASA through a ROSES grant (No. NNX10AD57G). E. D. S. is grateful for partial support from the University of Minnesota. The authors thank the anonymous referee for helpful and constructive comments. K. B. W. M. gratefully acknowledges Matthew, Cole, and Carling for their support. This research made use of NASA’s Astrophysical Data System and the NASA/IPAC Extragalactic Database (NED) which is operated by the Jet Propulsion Laboratory, California Institute of Technology, under contract with the National Aeronautics and Space Administration.
Facilities: Hubble Space Telescope
References
- Begum et al. (2008) Begum, A., Chengalur, J. N., Karachentsev, I. D., Sharina, M. E., & Kaisin, S. S. 2008, MNRAS, 386, 1667
- Bigiel et al. (2008) Bigiel, F., Leroy, A., Walter, F., et al. 2008, AJ, 136, 2846
- Blitz (1993) Blitz, L. 1993, Protostars and Planets III, ed. E. H. Levy & J. I. Lunine (Tucson, AZ: Univ. of Arizona Press), 125
- Bolatto et al. (2008) Bolatto, A. D., Leroy, A. K., Rosolowsky, E., Walter, F., & Blitz, L. 2008, ApJ, 686, 948
- Bolatto et al. (2011) Bolatto, A. D., Leroy, A. K., Jameson, K., et al. 2011, ApJ, 741, 12
- Bruzual & Charlot (2003) Bruzual, G., & Charlot, S. 2003, MNRAS, 344, 1000
- Côté et al. (2011) Côté, B., Martel, H., Drissen, L., & Robert, C. 2011, arXiv:1112.2182
- Croxall et al. (2009) Croxall, K. V., van Zee, L., Lee, H., et al. 2009, ApJ, 705, 723
- Cyburt et al. (2008) Cyburt, R. H., Fields, B. D., & Olive, K. A. 2008, JCAP, 11, 12
- de Vaucouleurs et al. (1976) de Vaucouleurs, G., de Vaucouleurs, A., & Corwin, J. R. 1976, Second reference Catalogue of bright galaxies, 1976, Austin: University of Texas Press., 0
- Dolphin (2000) Dolphin, A. E. 2000, PASP, 112, 1383
- Dolphin (2002) Dolphin, A. E., 2002, MNRAS, 332, 91
- Ekta & Chengalur (2010) Ekta, B., & Chengalur, J. N. 2010, MNRAS, 403, 295
- Gao & Solomon (2004) Gao, Y., & Solomon, P. M. 2004, ApJ, 606, 271
- Genzel et al. (2012) Genzel, R., Tacconi, L. J., Combes, F., et al. 2012, ApJ, 746, 69
- Heyer et al. (2009) Heyer, M., Krawczyk, C., Duval, J., & Jackson, J. M. 2009, ApJ, 699, 1092
- Hidalgo-Gámez et al. (2001a) Hidalgo-Gámez, A. M., Masegosa, J., & Olofsson, K. 2001, A&A, 369, 797
- Hidalgo-Gámez et al. (2001b) Hidalgo-Gámez, A. M., Olofsson, K., & Masegosa, J. 2001, A&A, 367, 388
- Hunter & Sage (1993) Hunter, D. A., & Sage, L. 1993, PASP, 105, 374
- James et al. (2004) James, P. A., et al. 2004, A&A, 414, 23
- Karachentsev et al. (2004) Karachentsev, I. D., Karachentseva, V. E., Huchtmeier, W. K., & Makarov, D. I. 2004, AJ, 127, 2031
- Kennicutt (1989) Kennicutt, R. C., Jr. 1989, ApJ, 344, 685
- Kennicutt (1998a) Kennicutt, R. C., Jr. 1998, ARA&A, 36, 189
- Kennicutt (1998b) Kennicutt, R. C., Jr. 1998, ApJ, 498, 541
- Kennicutt et al. (2005) Kennicutt, R. C., Jr., Lee, J. C., Funes, J. G., Sakai, S., & Akiyama, S., 2005, ASSL Volume 329, Starbursts from 30 Doradus to Lyman Break Galaxies, eds., De Gris, R. & González Delgado, R. M., Springer (the Netherlands), 187
- Kobulnicky & Skillman (1996) Kobulnicky, H. A., & Skillman, E. D. 1996, ApJ, 471, 211
- Kobulnicky et al. (1997a) Kobulnicky, H. A., Skillman, E. D., Roy, J.-R., Walsh, J. R., & Rosa, M. R. 1997, ApJ, 477, 679
- Kobulnicky & Skillman (1997b) Kobulnicky, H. A., & Skillman, E. D. 1997, ApJ, 489, 636
- Komatsu et al. (2011) Komatsu, E., Smith, K. M., Dunkley, J., et al. 2011, ApJS, 192, 18
- Komugi et al. (2011) Komugi, S., Yasui, C., Kobayashi, N., et al. 2011, PASJ, 63, L1
- Kroupa (2001) Kroupa, P. 2001, MNRAS, 322, 231
- Krumholz & McKee (2005) Krumholz, M. R., & McKee, C. F. 2005, ApJ, 630, 250
- Lanzetta et al. (2002) Lanzetta, K. M., Yahata, N., Pascarelle, S., Chen, H.-W., & Fernández-Soto, A. 2002, ApJ, 570, 492
- Lee et al. (2006) Lee, H., Skillman, E. D., & Venn, K. A. 2006, ApJ, 642, 813
- Leroy et al. (2005) Leroy, A., Bolatto, A. D., Simon, J. D., & Blitz, L. 2005, ApJ, 625, 763
- Leroy et al. (2008) Leroy, A. K., Walter, F., Brinks, E., et al. 2008, AJ, 136, 2782
- Leroy et al. (2011) Leroy, A. K., Bolatto, A., Gordon, K., et al. 2011, ApJ, 737, 12
- Marigo & Girardi (2007) Marigo, P., & Girardi, L. 2007, A&A, 469, 239
- Martin & Kennicutt (2001) Martin, C. L., & Kennicutt, R. C., Jr. 2001, ApJ, 555, 301
- McQuinn et al. (2010a) McQuinn, K. B. W., Skillman, E. D., Cannon, J. M., et al. 2010, ApJ, 721, 297
- McQuinn et al. (2010b) McQuinn, K. B. W., Skillman, E. D., Cannon, J. M., et al. 2010, ApJ, 724, 49
- Meurer et al. (1997) Meurer, G. R., Heckman, T. M., Lehnert, M. D., Leitherer, C., & Lowenthal, J. 1997, AJ, 114, 54
- O’Neil et al. (2003) O’Neil, K., Schinnerer, E., & Hofner, P. 2003, ApJ, 588, 230
- Parmentier & Fritze (2009) Parmentier, G., & Fritze, U. 2009, ApJ, 690, 1112
- Piersimoni et al. (1999) Piersimoni, A. M., Bono, G., Castellani, M., et al. 1999, A&A, 352, L63
- Rahman et al. (2012) Rahman, N., Bolatto, A. D., Xue, R., et al. 2012, ApJ, 745, 183
- Roy et al. (1996) Roy, J.-R., Belley, J., Dutil, Y., & Martin, P. 1996, ApJ, 460, 284
- Salpeter (1955) Salpeter, E. E. 1955, ApJ, 121, 161
- Sanders et al. (1991) Sanders, D. B., Scoville, N. Z., & Soifer, B. T. 1991, ApJ, 370, 158
- Schmidt (1959) Schmidt, M. 1959, ApJ, 129, 243
- Skillman et al. (1989) Skillman, E. D., Kennicutt, R. C., & Hodge, P. W. 1989, ApJ, 347, 875
- Skillman et al. (1994) Skillman, E. D., Televich, R. J., Kennicutt, R. C., Jr., Garnett, D. R., & Terlevich, E. 1994, ApJ, 431, 172
- Skillman et al. (2003) Skillman, E. D., Côté, S., & Miller, B. W. 2003, AJ, 125, 610
- Solomon & Sage (1988) Solomon, P. M., & Sage, L. J. 1988, ApJ, 334, 613
- Swaters et al. (2002) Swaters, R. A., van Albada, T. S., van der Hulst, J. M., & Sancisi, R. 2002, A&A, 390, 829
- Tacconi & Young (1985) Tacconi, L. J., & Young, J. S. 1985, ApJ, 290, 602
- Tan (2000) Tan, J. C. 2000, ApJ, 536, 173
- Taylor et al. (1998) Taylor, C. L., Kobulnicky, H. A., & Skillman, E. D. 1998, AJ, 116, 2746
- Tremonti et al. (2004) Tremonti, C. A., et al. 2004, ApJ, 613, 898
- Turner et al. (1997) Turner, J. L., Beck, S. C., & Hurt, R. L. 1997, ApJ, 474, L11
- van Zee et al. (1997) van Zee, L., Haynes, M. P., & Salzer, J. J. 1997, AJ, 114, 2479
- Warren et al. (in prep) Warren, S., et al. in prep.
- Weisz et al. (2008) Weisz, D. R., Skillman, E. D., Cannon, J. M., et al. 2008, ApJ, 689, 160
- Wilson (1992) Wilson, C. D. 1992, ApJ, 391, 144
- Wong & Blitz (2002) Wong, T., & Blitz, L. 2002, ApJ, 569, 157
- Wyder et al. (2009) Wyder, T. K., et al. 2009, ApJ, 696, 1834
- Young et al. (1984) Young, J. S., Gallagher, J. S., & Hunter, D. A. 1984, ApJ, 276, 476
- Young et al. (1986) Young, J. S., Schloerb, F. P., Kenney, J. D., & Lord, S. D. 1986, ApJ, 304, 443
- Young et al. (1995) Young, J. S., Xie, S., Tacconi, L., et al. 1995, ApJS, 98, 219
- Zaritsky et al. (1994) Zaritsky, D., Kennicutt, R. C., Jr., & Huchra, J. P. 1994, ApJ, 420, 87
| MB | Distance | D25 Area | Deproj. D25 Area | Duration | SFR over Burst | |||
|---|---|---|---|---|---|---|---|---|
| Galaxy | (mag) | (Mpc) | in FOV (%) | in FOV (kpc2) | of Burst (Myr) | ( M⊙ yr-1) | 12log(O/H) | Source |
| (1) | (2) | (3) | (4) | (5) | (6) | (7) | (8) | (9) |
| Antlia | -10.14 | 1.25 | 100% | 0.47 | 636185 | 0.180.02 | 7.39 | 1 |
| UGC 9128 | -12.45 | 2.24 | 100% | 1.2 | 1300300 | 1.8 0.01 | 7.74 | 2 |
| UGC 4483 | -12.68 | 3.2 | 100% | 1.0 | 810190 | 2.5 0.1 | 7.50 | 3 |
| NGC 4163 | -13.75 | 3.0 | 100% | 3.2 | 46070 | 4.5 0.2 | 7.69 | 4 |
| UGC 6456 | -13.85 | 4.3 | 100% | 3.0 | 57060 | 3.5 0.2 | 7.64 | 5 |
| NGC 6789 | -14.60 | 3.6 | 100% | 1.7 | 48070 | 4.5 0.1 | 7.77 | 4 |
| NGC 4068 | -14.96 | 4.3 | 100% | 19.5 | 45950 | 20. 1 | 7.84 | 4 |
| DDO 165 | -15.19 | 4.6 | 100% | 18. | 1300300 | 21. 1 | 7.80 | 4 |
| IC 4662 | -15.39 | 2.4 | 100% | 2.2 | 45050 | 28. 1 | 8.17 | 6 |
| ESO 154-023 | -16.21 | 5.76 | 63% | 120 | 45050 | 53. 1 | 8.01 | 4 |
| NGC 2366 | -16.33 | 3.2 | 96% | 40. | 45050 | 56. 1 | 8.19 | 7 |
| NGC 625 | -16.26 | 3.9 | 63% | 35. | 45050 | 18. 1 | 8.10 | 8 |
| NGC 784 | -16.78 | 5.19 | 73% | 64. | 45050 | 63. 2 | 8.05 | 4 |
| Ho II | -16.92 | 3.4 | 44% | 21. | 56665 | 51. 1 | 7.92 | 6 |
| NGC 5253 | -16.98 | 3.5 | 100% | 28. | 45050 | 130 2 | 8.10 | 9 |
| NGC 6822 | -17.86 | 0.5 | 10% | 0.42 | 20 | 4.5 0.4 | 8.11 | 10 |
| NGC 4214 | -17.02 | 2.7 | 13% | 5.4 | 810190 | 46. 1 | 8.38 | 11 |
| NGC 1569 | -17.76 | 3.36 | 87% | 3.0 | 45050 | 76 2 | 8.19 | 12 |
| NGC 4449 | -18.02 | 4.2 | 87% | 40. | 45050 | 270 5 | 8.21 | 13 |
Note. — Column (1) Galaxy name. Column (2) Absolute B magnitude of the galaxy. Column (3) Tip of the Red Giant Branch distance to the galaxy. Column (4) Indicates the percentage of the area defined by the B-band 25 mag arcsec-2 isophotal diameter in the observational field of view (F.O.V.) form Karachentsev et al. (2004). Column (5) Measures the deprojected D25 area contained in the F.O.V. in kpc2. Column (6) The starburst durations (McQuinn et al., 2010b). The durations are lower limits in 12 systems as the galaxies show on-going, elevated rates of SF. Column (7) The average SFRs over the duration of the starbursts (McQuinn et al., 2010a) scaled from a Salpeter IMF to a Kroupa IMF by dividing by a factor of 1.59.
References. — (1) Piersimoni et al. (1999); (2) van Zee et al. (1997); (3) Skillman et al. (1994); (4) L-Z relation; Zaritsky et al. (1994); Tremonti et al. (2004); Lee et al. (2006); (5) Croxall et al. (2009); (6) Hidalgo-Gámez et al. (2001a); (7) Roy et al. (1996); (8) Skillman et al. (2003); (9) Kobulnicky et al. (1997a); (10) Hidalgo-Gámez et al. (2001b); (11) Kobulnicky & Skillman (1996); (12) Kobulnicky & Skillman (1997b); (13)Skillman et al. (1989)
| Measured | Measured | Inferred log | N ( cm-2) | Estimated MH2 | ICO | XCO | |
|---|---|---|---|---|---|---|---|
| log | log | (M⊙ pc-2) | Assumes | at onset of burst | (K km s-1) | () | |
| Galaxy | (M⊙ yr-1 kpc-2) | (M⊙ pc-2) | SFE10%; He factor=1.33 | M⊙ pc-2 | ( M⊙) | from lit. | (cm-2/(K km s-1) |
| (1) | (2) | (3) | (4) | (5) | (6) | (7) | (8) |
| Antlia | -3.41 0.088 | -0.5 0.05 | 0.37 | ||||
| UGC 9128 | -2.82 0.011 | 0.4 0.03 | 1.24 | 9 | |||
| UGC 4483 | -2.61 0.009 | 0.4 0.06 | 1.26 | 8 | |||
| NGC 4163 | -2.85 0.005 | -0.1 0.07 | 0.77 | ||||
| UGC 6456 | -2.94 0.005 | -0.1 0.07 | 0.74 | ||||
| NGC 6789 | -2.58 0.005 | 0.2 0.08 | 1.03 | 1 | |||
| NGC 4068 | -3.00 0.001 | -0.3 0.02 | 0.57 | ||||
| DDO 165 | -2.94 0.001 | 0.3 0.03 | 1.13 | 65 | |||
| IC 4662 | -1.90 0.003 | 0.8 0.04 | 1.68 | 82 | |||
| ESO 154-023 | -3.36 0.001 | -0.7 0.02 | 0.22 | ||||
| NGC 2366 | -2.85 0.001 | -0.2 0.01 | 0.71 | ||||
| NGC 625 | -3.28 0.001 | -0.6 0.05 | 0.27 | ||||
| NGC 784 | -3.01 0.001 | -0.3 0.02 | 0.58 | ||||
| Ho II | -2.62 0.001 | 0.2 0.02 | 1.08 | 45 | 3 | ||
| NGC 5253 | -2.35 0.001 | 0.4 0.03 | 1.24 | 210 | 6 | ||
| NGC 6822 | -1.97 0.1 | -0.4 0.08 | 0.50 | ||||
| NGC 4214 | -2.08 0.002 | 0.9 0.06 | 1.80 | 280 | 0.542 | 61 | |
| NGC 1569 | -1.60 0.004 | 1.1 0.04 | 1.96 | 240 | 0.685 | 74 | |
| NGC 4449 | -2.17 0.001 | 0.5 0.05 | 1.39 | 590 | 0.78 | 12 |
Col. (1) Galaxy name. Col. (2) The SFR surface density is equal to the average SFR over the life of the burst (McQuinn et al., 2010b), assuming a Kroupa IMF, and divided by the deprojected area out to the B-band 25 mag arcsec-2 isophotal diameter or the field of view, whichever is smaller (see Table Observational Constraints on the Molecular Gas Content in Nearby Starburst Dwarf Galaxies111Based on observations made with the NASA/ESA Hubble Space Telescope, obtained from the Data Archive at the Space Telescope Science Institute, which is operated by the Association of Universities for Research in Astronomy, Inc., under NASA contract NAS 5-26555. for values). Col. (3) The stellar mass surface density is equal to the stellar mass formed during the burst divided by the the same area used for the and converted to pc-2. The stellar mass was calculated by integrating the SFRs over the duration of each starburst (McQuinn et al., 2010b). Col. (4) The inferred hydrogen gas surface density present at the onset of the burst is equal to the divided by an assumed SFE of and a factor of 1.33 to account for the abundance of Helium. Col. (5) The estimated number density of molecular hydrogen assuming an Hi gas surface density M⊙ pc-2, based on the gas surface densities in Col. (4). Col. (6) Molecular gas mass estimated at the onset of the starbursts in the areas listed in Table Observational Constraints on the Molecular Gas Content in Nearby Starburst Dwarf Galaxies111Based on observations made with the NASA/ESA Hubble Space Telescope, obtained from the Data Archive at the Space Telescope Science Institute, which is operated by the Association of Universities for Research in Astronomy, Inc., under NASA contract NAS 5-26555. based on the H2 column densities in Col. (5). These values can be compared to the 10 M⊙ molecular gas mass typical of a Galactic GMC (Blitz, 1993). Col. (7) Intensity of CO emission including confirmed detections for NGC 5253, NGC 4214, NGC 1569 (Taylor et al., 1998), NGC 6822 (Wilson, 1992), and NGC 4449 (Tacconi & Young, 1985), and observationally set upper limits for UGC 4483 (Taylor et al., 1998), NGC 2366 (Hunter & Sage, 1993), Ho II (Young et al., 1995). Col. (8) XCO factor estimated from the ratio of inferred H2 column densities to measured CO luminosities for systems or observationally set upper limits, for the galaxies with inferred molecular gas content.