Contribution to the study of baryonic spectroscopy, using baryon mass ratios
Abstract
The ratios between different baryonic species masses are studied. The result is used to tentatively predict some missing baryonic masses, still not experimentally observed.
pacs:
I Introduction
The study of fractal properties of hadronic spectroscopy bor1 , lead us to observe that the distributions of mass ratios versus the rank, are almost the same among most species. Here is the mass of the given species at rank “n”. This close behaviour was summarized in figure 34 of bor1 , where all the first masses of Particle Data Group (PDG) pdg were plotted after global translations of each species, in order to equalize the yrast mass of all species to the yrast charmed baryon mass.
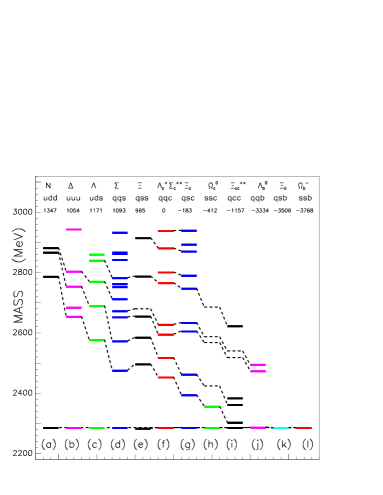
Although such comparison would be more justified after scaling, rather than translation, the translation allows to better visualize the regularity of the variation between excited masses of different baryonic species. Figure 1 reproduces this figure 34 of bor1 . A global vertical translations is done, in order to equalize the yrast mass of all species to the yrast charmed baryon mass. The amount of this mass translation is indicated at the top of the figure, below the quark content of each species. For increasing yrast mass species, we observe that the gap between the yrast and the second mass decreases for all species except for baryons. We observe also that, if we except the yrast masses, the distributions all baryonic species masses display close variations.
In order to study this more quantitatively, we will show the ratios of the mass distributions of all baryonic species. We see from figure 1 that, concerning heavier species, very few baryonic masses have been observed and no one in some cases. These species, and all baryons containing a ”b” quark, are not considered here. In all species, the masses are less defined, above an excitation of several hundred MeV. It is also possible that at present, missing masses exist, which will be observed later. Therefore our study concerns only the first several hundred MeV excitation masses.
II Ratios between different PDG baryonic species masses
The PDG baryonic masses pdg are reported (in black) in table 1.
When the masses change by a few MeV corresponding to different charges, their mean value is kept. For example the three masses being respectively M = 1189.37 MeV, 1192.642 MeV, and 1197.449 MeV, the mean value M = 1193 MeV is used.
II.1 Baryonic masses compared to masses
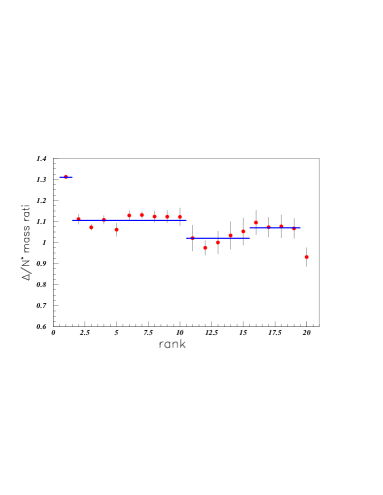
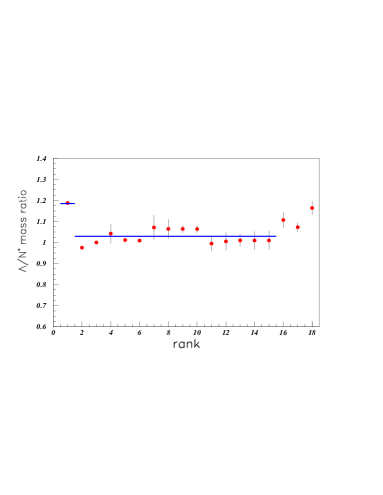
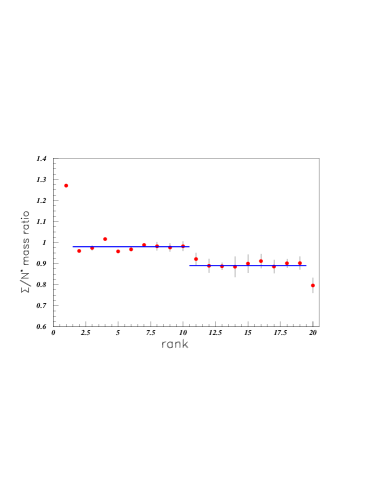
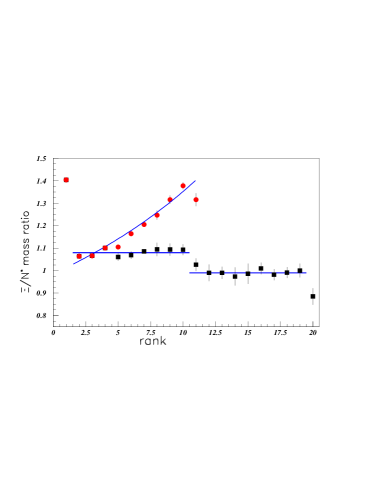
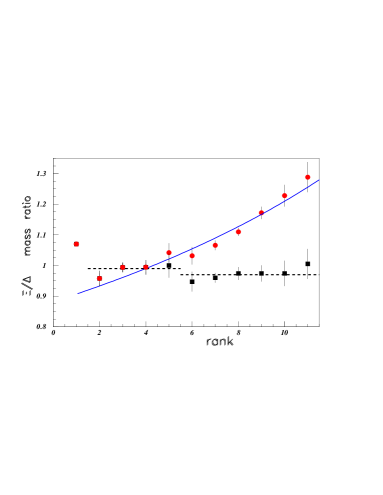
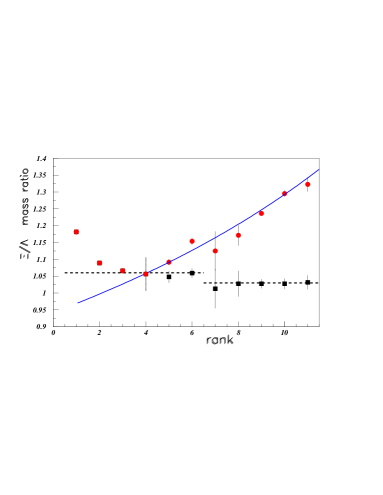
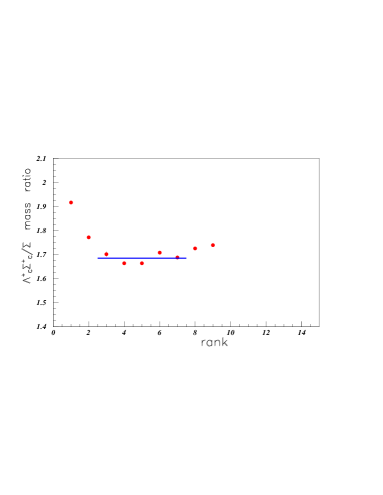
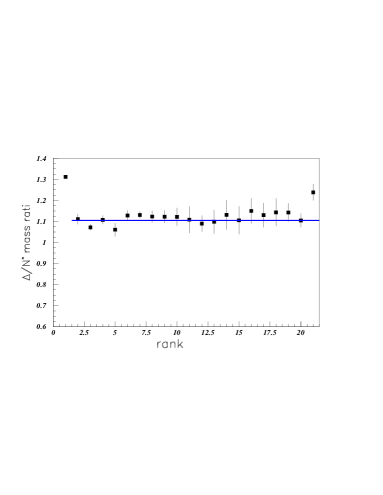
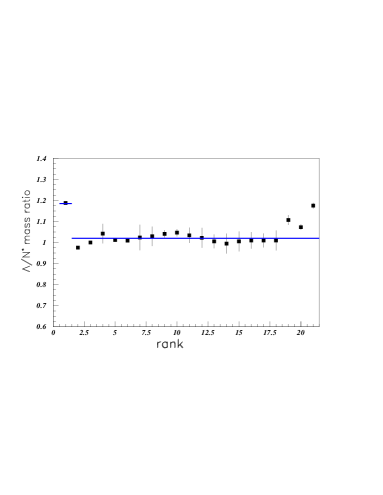
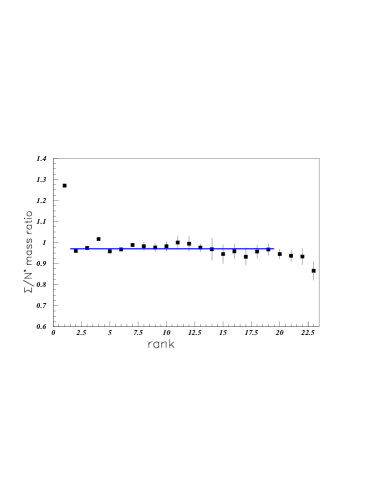
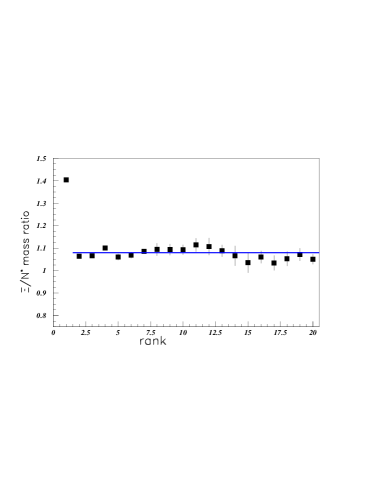
Figures 2, 3, 4, 5, 6, and 7 show respectively the ratios of , , , , , and baryons over . We observe that these ratios, represented by full red circles, can generally be joined by one (or a few) horizontal line(s), up to rank 10, with two exceptions. The first exception concerns the first, fundamental (yrast) mass of every species. The second exception concerns the ratio of masses (figure 5). In this figure the black full squares show ratios after introduction of still unobserved baryons; this point will be discussed later. In this figure, the first four baryonic masses are the masses reported by PDG, therefore the same marks apply for full red circles and full black squares. When more than 10 data exist, the ratio in this range exhibits a second horizontal line slightly lower than the previous one. This point will be discussed below.
II.2 Baryonic masses compared to masses
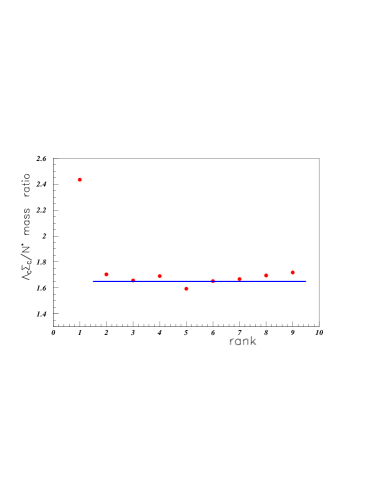
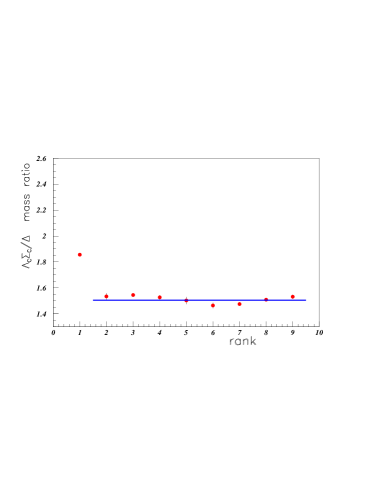
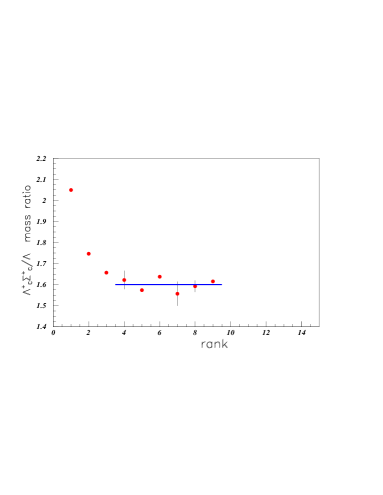
Figure 8 shows the ratio of PDG masses, masses, and masses (full red circles).
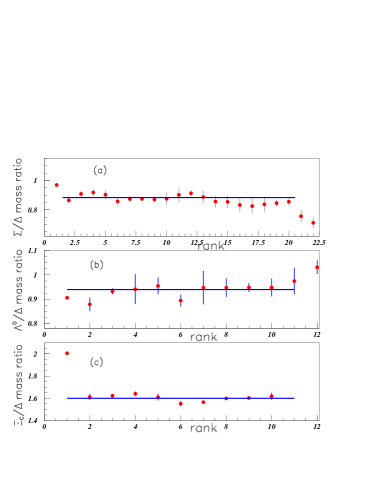
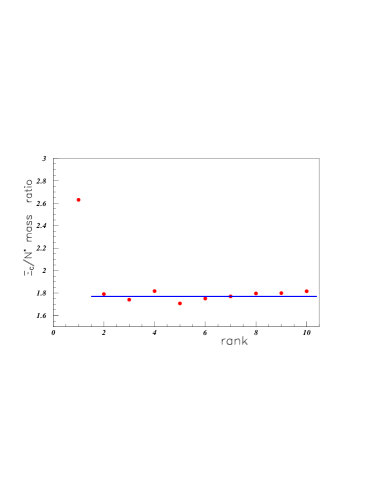
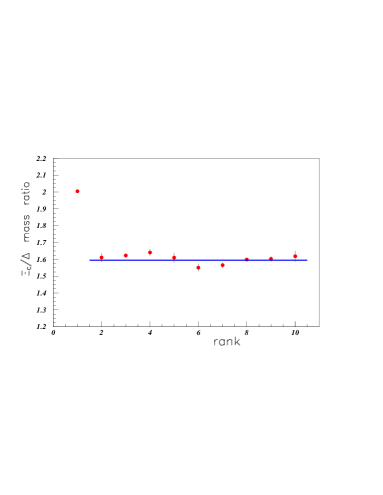
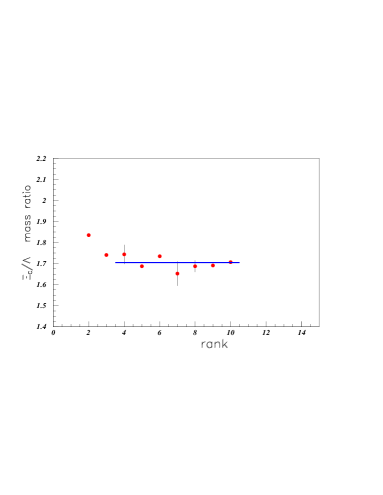
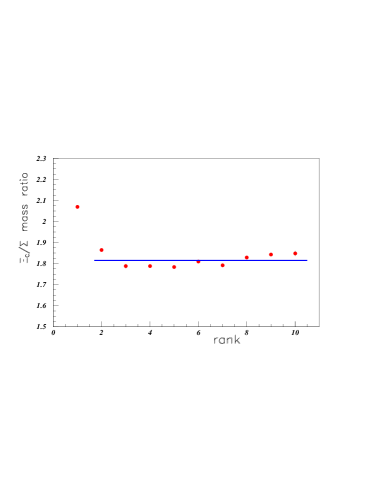
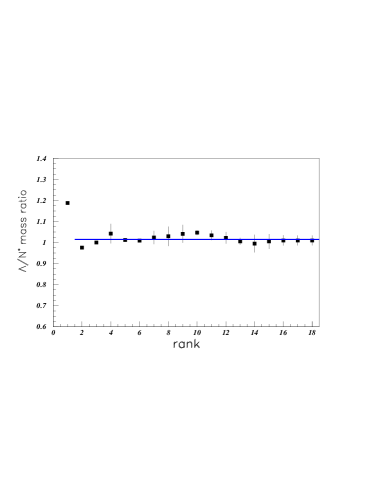
Figure 9 shows the ratio of masses. The same comments apply, as those concerning the mass ratio (figure 5). Figure 10 and figure 11 show the ratio of PDG baryonic masses. We observe in both cases, a nice horizontal line, except for the yrast mass ratio.
II.3 Baryonic masses compared to masses
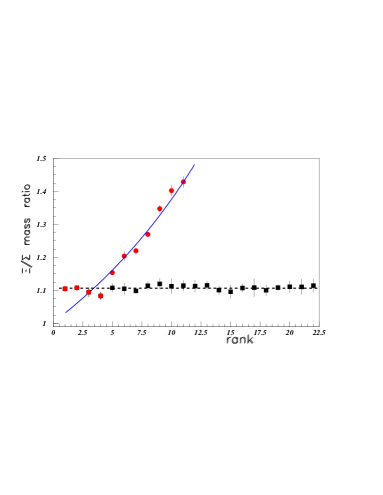
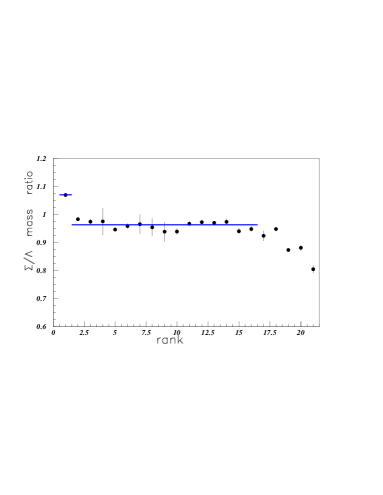
Figure 12 shows the ratio of baryonic masses. In both species, more data than before exists, allowing to draw the figure up to rank 18. We observe several horizontal lines decreasing for increasing rank by a rather constant gap.
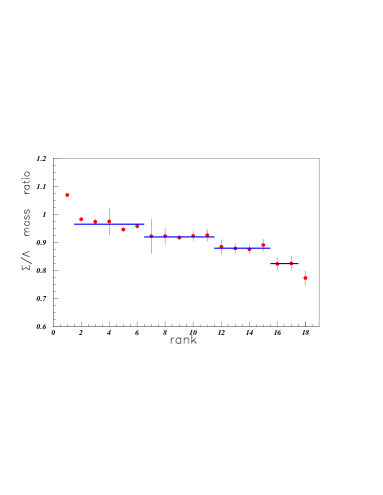
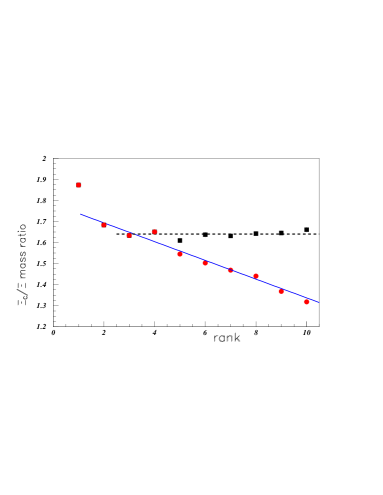
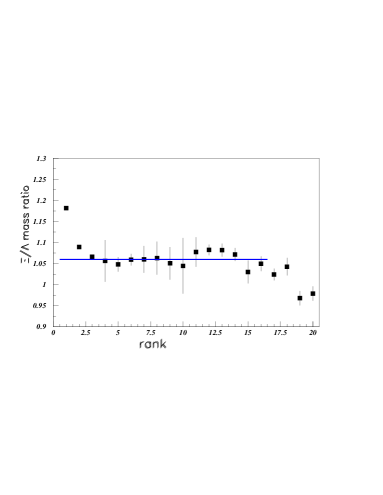
Figure 13 shows the ratio of masses. Here again, the comments of figure 5 apply.
Figures 14 and 15 show the ratios of and over baryons.
II.4 Baryonic masses compared to masses
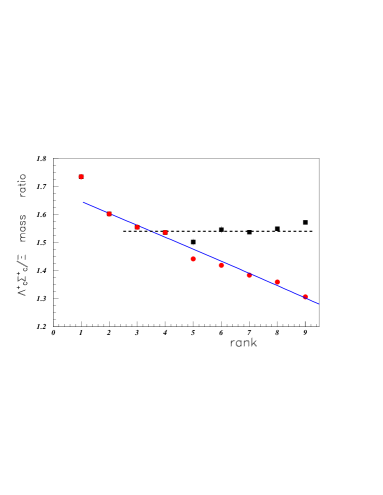
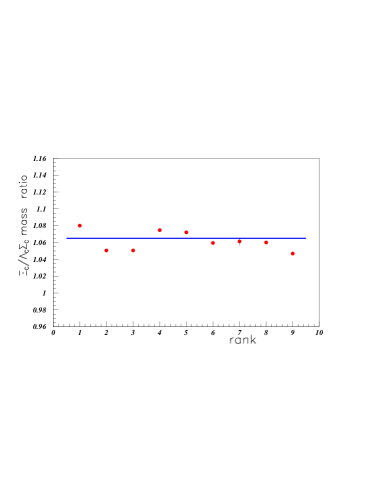
Figure 16 shows the ratio of baryonic masses. The same comments, as those concerning the dicussion of figure 5, apply here, since again the ratio involves the baryons. Figures 17 and 18 show the ratio of and baryonic masses.
II.5 Baryonic masses compared to masses
Figures 19 and 20 show the ratios of and over baryonic masses. The same comments, as those concerning the dicussion of figure 5, apply here, since again both ratios involve the baryons. The lack of many masses in the baryon species, explains why the distributions decrease.
II.6 Baryonic masses compared to masses
Figure 21 shows the ratio of masses compared to masses. These data display an horizontal line, indicating with a rather great probability, that there is no one missing mass in both species.
III Discussion
A proportionality is observed between excited particle masses of all baryonic species, at least up to rank 10, except for the baryons. We have therefore supposed that this is a general property, and naturally we associate the differences observed in all ratios involving the baryons, with a lack of some baryonic masses.
III.1 Discussion concerning the baryon masses
The same set of tentatively introduced baryonic masses, allows to obtain proportionality with all other baryonic species. We observe that this is the case in all figures involving baryons. In addition to the PDG masses: M = 1318.28 MeV, 1531.8 MeV, 1620 MeV, 1690 MeV, 1823 MeV, 1950 MeV, 2025 MeV, 2120 MeV, 2250 MeV, 2370 MeV, and 2500 MeV, the proportionality is obtained after the arbitrary introduction of the following masses: 1750 MeV, 1790 MeV, 1860 MeV, 1870 MeV, 1880 MeV, 1970 MeV, 1980 MeV, 2060 MeV, 2150 MeV, 2200 MeV, 2300 MeV, 2310 MeV, 2340 MeV, and 2360 MeV.
It is of course out not possible, to attribute definitively these 14 supplementary introduced masses, to exact missing baryonic masses. They must be used, rather, as an indication of the number and approximate masses, that have to be observed by specific experiments still to be done.
The baryon masses are more precise, around M 2 GeV, than the N∗ masses. Taking into account the small shifts between adjacent introduced additionnal masses, we attribute for them an unprecision (M) = 20 MeV.
The result of this increase of mass data, is shown in figures 5, 9, 13, 16, 19, and 20, by black squares. The same set of new proposed masses allows to notably improve all ratios between different baryonic species. These masses are introduced in red in table 1.
III.2 Discussion concerning the baryon masses
In the same way, as done for baryons, a careful look on the figures where the baryon masses are compared to masses, indicates a possible improvement after a tentative introduction of several masses in the range 1720 1900 MeV. For different species where at least 11 masses are known, the comparison to the masses, allows us to observe a shift starting always at rank 11. Such shift may indicate a lack of one (or a few) masses in the range 1720M1900 MeV, where there is no baryonic mass in the PDG table. Indeed in the lower range 1650M1720 MeV, there are six masses reported in the same table. The arbitrary introduction of the following masses: M 1750 MeV, 1780 MeV, and 1820 MeV allows us to improve the linearity between the various baryonic species masses.
The precision on N∗ masses is often poor for masses 1700 MeV. When not given in PDG, we take into account the various experimental masses to attribute a mass unprecision. The precision on all tentatively introduced N∗ masses, is arbitrarily put to M = 50 MeV.
Figure 22, shows the new mass ratio, which has to be compared to figure 3. Figure 25 shows the mass ratio, after the introduction of additionnal N∗ masses.
III.3 Discussion concerning the baryonic masses
Another observation of previous figures shows that there is missing mass(es) in the mass table in the range 1690M 1800 MeV. Indeed this appear in figure 3 ( mass ratio), figure 13 ( mass ratio), and figure 12 ( mass ratio). The tentatively introduction of three additionnal masses: M = 1720 MeV, 1750 MeV, and 1780 MeV allows to improve the proportionality of baryonic mass ratios up to rank = 18 as shown in the figures 26, 27, and 28.
There is also missing masses in the mass table in the range 2110M 2325 MeV (see figures 12 and 23), and in the range 2350M 2585 MeV (see figure 12). There is no attempt in this paper to suggest other possible masses in these ranges. We observe in several figures a step between two horizontal lines, again tentatively attributed to the lack of a few masses in the range 17001800 MeV. This step is corrected after the introduction of masses at M = 1720 MeV, 1750 MeV, and 1780 MeV.
We observe that the same mass range was completed by arbitrarily introduced baryons in the three species: N∗, , and . Figure 24 shows the mass ratio, after the introduction of ”additionnal masses”.
III.4 Relations giving baryonic mass formula
The Gell-Mann-Okubo mass formula okubo considers the masses of the baryon octet = 1/2+, and eliminating a few parameters, get the following relation:
MΣ + 3MΛ = 2 (MN + MΞ)
The choice of three for one allows to get a very good precision for the relation. The relative gap between both quantities of the previous relation is as small as y = 5.6*10-3.
In the same spirit, we compute below, a few relations between yrast masses, for the same number of quark flavours in both sides of the relation. Restricting ourselves to the choice I = 0 and = 1/2+ particles, we observe that the relation:
M() + M() = M() + M()
is verified with a precision of 5.0*10-3.
In the same way, the addition of the baryonic masses of a particle with a particle, is rather stable, as shown in the following example where ”n” stands for the neutron:
M() + M(n) = M() + M()
which is verified with a precision of 1.4.
In the same way, the addition of two isospin 1/2 baryonic masses with two isospin 0 baryonic masses is rather stable, as shown in the following example:
M() + M() = M() + M()
which is verified with a precision of 0.86 10-3.
On the other hand, the equality is no more nearly obtained if we add the masses of two different and increasing isospin values. For example, the mass of two I =1 baryonic particles compared to the sum of two I = 1/2 baryonic particles differs in a larger extend, as shown in the following example:
M() + M() and M() + M(n)
which differs by 6.8. The mass of two I =1 baryonic particles compared to the sum of a I = 1/2 and I = 3/2 baryonic particles, differs in a smaller extend, as shown in the following example:
M() + M() = M() + M()
which is verified within 1.4 .
So the precision obtained in the mass computations shown above, can generally be of the order or better than 1. For example the mass of the double charmed baryon = 3.5189 GeV pdg can be calculated by the relation:
M() = 2 M() - (M(N) + M()) /2 = 3.4874 GeV and the corresponding relative precision is close to
y = 9*10-3.
In the same way
M() = M() + M() - M() is verified within 2.7 10-3.
The mass of the = 2695.2 MeV can be calculated by two ways, namely :
) = 2* - = 2480.8 MeV, therefore distant by 8.3 , or by:
= + - M(N) = 2669.6 MeV, therefore distant by 0.95.
When applied again to yrast masses, the relation:
M() + M(N) = M() + M()
is well obtained, since the relative discrepancy between the two members of the equality is equal to . The equality is worse for (not yrast) heavier masses, since , , , , and .
III.5 Comparison with predictions of theoretical models
Many models of baryons have been proposed. It is known that ”Lattice QCD successfully estimates ground states of hadron spectrum, but excited states still represent an outstanding challenge” verduci . The works done within the constituent quark models, before 2000 are reported in capstick . The model of Isgur and Karl isgur predicts the existence of three in the mass range 17001720 MeV, and nothing above up to M = 1870 MeV. Concerning the masses, this model predicts the existence of a at M = 1740 MeV, and no with negative parity, in the mass range 17101800 MeV. These results do not fit with our ”introduced” masses. It is noticeable that the number of calculated baryonic masses is smaller than the number of experimental masses. However ”there are far less and states established experimentally than expected within quark models” thomas . On the contrary, the concept of ”missing resonances” was introduced to signify the lack of resonances obtained within the quark models, but not observed, and in the same way missing states were reported manley .
A recent review huey reported latest progress with a special interest to heavy and not yet observed baryons. The comparison with experimental masses is difficult for since the results of the calculations are presented versus different values of the pion mass squared. Concerning heavier baryons, the calculations predict, below M = 1.8 GeV, only one mass for and (not studied in the present work), and only two masses for and baryons, therefore a much lower number than experimentally observed.
There is an often discussed problem about nucleon states, predicted by quark models, but not observed experimentally. These states are called ”missing resonances”, already mentionned. A search for these resonances via associated strangeness photoproduction was performed saghai . The authors concluded that two such resonances, namely a , M = 1820 MeV, and a , M = 1920 MeV, help to improve the cross-section and the recoil polarization asymmetry between calculation and experimental data studied in the reaction p . Another calculation was performed to study the possible improvement of the cross-sections and polarization asymmetries by adding several (S11, P11, P13, D13, D15, and H1,11) new resonances to all PDG baryonic resonances he . These authors developped a chiral quark model for the p p reaction. In their model A, they introduced six new resonances, but only one (1730) happens to play a significant role.
A systematic search was undertaken at CLAS clas crede , using photon beams in the range 0.84.0 GeV/c and looking to different disintegration channels. Another study was performed by the CBELSA/TAPS experiment at ELSA thoma , studying also photoproduction of single and multi-meson final states off the nucleon, and enriched by double polarization experiments using circularly or linearly polarized photon beams schmidt beck . Recent measurements were also done at MAMI schumann . The aim of these measurements is to be able to construct unambiguously the scattering amplitudes. The existence of several broad overlapping resonances in the mass region 15002000 MeV, difficult to disentangle, explains that there is, up to now, no clear experimental result concerning these ”missing resonances”.
III.6 Discussion concerning the mass ratios between different baryonic species
Table II shows the ratios of baryonic masses between different species, when the first (yrast) mass of all species is ignored. These ratio values are read from the previous figures (2 - 28) in the following way: M() / M() = 0.94. The ratio of excited baryonic masses over all other excited baryonic masses is rather stable. The same property is observed for excited baryonic masses (except for the ratio ). The substitution of a quark ”s” to a quark ”u” or ”d”, does not increase substancially the masses. Moreover, the baryonic masses containing a quark ”c” are clearly heavier.
As already mentionned, these ratios are different for the first mass of all baryonic species. Figure 1 shows that the gap between the excited state spectra and the first (yrast) mass, decreases for increasing baryonic masses. Table III shows the ratio of the first (yrast) mass between two baryonic species. The numbers are larger than in table II, but still exhibit some regularity. The masses are larger than expected from the continuity due to increasing flavour; this effect is induced by larger isospin I = 3/2. The effect of smaller isospins is negligible. However the ratio between two ratios is about the same, for yrast masses (table III) and excited level masses (table II). For example the ratio between masses, symbolized by their quark content: [qsc]/[qqc], equals 1.065 for excited levels (table II) and 1.08 for yrast levels (table III). The ratio [qss]/[uus] equals 1.107 for excited levels (table II) and 1.105 for yrast levels (table III).
IV Conclusion
The masses of the different baryonic species are compared, without consideration of their corresponding widths, neither their quantum numbers, or their disintegration channels. In the same way, nothing is taken into account about the possiblity that these baryons could be hybrid (with a part of glue).
Using similar simple ideas, the baryonic fundamental or excited masses have already been discussed capstick valcarce . However none of these papers has shown the constant ratios between masses of different baryonic species.
Here, proportionality between all baryonic species masses, except the yrast ones, is observed. It allows to tentatively predict several missing masses in some species. These predictions are validated by the clear association between gaps in the mass ratios, and large empty mass ranges. An unique set of additionnal mass data is able to correct the shapes of the ratios which do not follow the proportionnality. Three missing masses, in the range 1720 M 1820 MeV, are tentatively introduced in the and tables. In addition to two masses, introduced in the baryon mass table in the same range, twelve masses are tentatively introduced in this baryon mass table at higher masses.
This observation of proportionnality, indicates that common laws apply to get excited state masses of three quarks. The various contributions to the excited state masses, due to different quantum numbers, give rise to small contributions to masses.
References
- (1) B. Tatischeff, arXiv:1105.2034v1 [physics.gen-ph] (2011).
- (2) K. Nakamura and Particle Data Group, J. Phys. G: Nucl. Part. 37, 075021 (2010).
- (3) M. Gell-Mann, ”The Eightfold Way: A Theory of Strong Interaction Symmetry,” California Institute of Technology Synchrotron Laboratory Report CTSL-20 (1961), unpublished.
- (4) S. Capstick and W. Roberts, Prog.Part.Nucl.Phys. 45, S241 (2000).
- (5) N. Isgur, G. Karl, and R. Koniuk, Phys. Rev. D 25, 2394 (1982).
- (6) V. Verduci, physik.uni-graz.at/ dk-user/talks/Verduci, Graz (2012).
- (7) A. Thomas, 3rd Joint Meeting of the APS Division of Nucl. Phys. and the Phys. Soc. of Japan, 54 Hawaii (2009).
- (8) D. Mark Manley, Jour. of Phys.: Conf. Series 9, 230 (2005).
- (9) Huey-Wen Lin, arXiv1106.1608v1 [hep-lat] (2011).
- (10) B. Saghai, J.-C. David, B. Juliá-Díaz, and T.-S.H. Lee, Eur. Phys. J. A 31, 512 (2007).
- (11) J. He, B. Saghai, Z. Li, Q. Zhao, and J. Durand, Eur. Phys. J. A 35, 321 (2008).
- (12) M. Bellis et al., CLAS Data Analysis Proposal CMUPWA-001.v1, (2005).
- (13) V. Crede, arXiv:1108.5199v1 [nucl-ex] (2011).
- (14) U. Thoma, AIP Conf. Proc. Volume 1257, 173 (2010).
- (15) C. Schmidt, 19th Int. IUPAP Conf. on Few-Body Problems 3, 03002 (2010).
- (16) R. Beck and A. Thiel, J. Phys.: Conf. Ser. 295 012023 (2011).
- (17) S. Schumann, AIP Onf. Proc. 1257, 165 (2010).
- (18) A. Valcarce, H. Garcilazo, and J. Vijande, Eur. Phys. J. A 37, 217 (2008).
PDG masses (black) and masses tentatively
introduced (red). (See text).
| Baryons | masses (in MeV) |
|---|---|
| N | 939, 1440, 1520, 1535, 1655, 1675, 1685 |
| 1700, 1710, 1720, 1750, 1780, 1820, 1900 | |
| 1990, 2000, 2080, 2090, 2100, 2190, 2200 | |
| 2220, 2275, 2600, 2700, 3000 | |
| 1232, 1600, 1630, 1700, 1750, 1890, 1900 | |
| 1910, 1920, 1930, 1940, 1940, 2000, 2150 | |
| 2200, 2300, 2350, 2390, 2400, 2420, 2750 | |
| 2950 | |
| , | 1115.68, 1405, 1520, 1600, 1670, 1690, 1720 |
| 1750, 1780, 1800, 1810, 1820, 1830, 1890 | |
| 2000, 2020, 2100, 2110, 2325, 2350, 2585 | |
| 1193, 1385, 1480, 1560, 1580, 1620 | |
| 1660, 1670, 1690, 1750, 1770, 1775, 1840 | |
| 1880, 1915, 1940, 2000, 2030, 2070, 2080 | |
| 2100, 2250, 2455, 2620, 3000, 3170 | |
| 1318.28, 1531.8, 1620, 1690, 1750, 1790 | |
| 1823, 1860, 1870, 1880, 1950, 1970, 1980 | |
| 2025, 2060, 2120, 2150, 2200, 2250 | |
| 2300, 2310, 2340, 2360, 2370, 2500 | |
| , | 2286.46, 2453.76, 2518.4, 2595.4 |
| 2628.1, 2766.6, 2802, 2881.53, 2939.3 | |
| 2469.5, 2577.8, 2645.8, 2789.2, 2817.4 | |
| 2931, 2974, 3054.2, 3077, 3122.9 |
| N∗ | ||||||||
|---|---|---|---|---|---|---|---|---|
| udq | uuu | uds | uus | qss | sss | qqc | qsc | |
| N∗ | 1 | 1.105 | 1.02 | 0.97 | 1.08 | 1.65 | 1.77 | |
| 1 | 0.94 | 0.884 | 0.99 | 1.6 | 1.6 | |||
| 1 | 0.963 | 1.06 | 1.6 | 1.705 | ||||
| 1 | 1.107 | 1.685 | 1.815 | |||||
| 1 | 1.54 | 1.64 | ||||||
| 1 | ||||||||
| 1 | 1.065 | |||||||
| 1 |
two different baryonic species. means implicitely
and .
| N∗ | ||||||||
|---|---|---|---|---|---|---|---|---|
| udq | uuu | uds | uus | qss | sss | qqc | qsc | |
| N∗ | 1 | 1.312 | 1.188 | 1.27 | 1.404 | 1.781 | 2.435 | 2.63 |
| 1 | .9056 | 0.9685 | 1.07 | 1.358 | 1.86 | 2.00 | ||
| 1 | 1.07 | 1.06 | 1 .50 | 2.05 | 2.21 | |||
| 1 | 1.105 | 1.40 | 1.92 | 2.07 | ||||
| 1 | 1.269 | 1.73 | 1.87 | |||||
| 1 | 1.367 | 1.467 | ||||||
| 1 | 1.08 | |||||||
| 1 |