Geometrical Cross Sections of Dust Aggregates and a Compression Model for Aggregate Collisions
Abstract
Geometrical cross sections of dust aggregates determine their coupling with disk gas, which governs their motions in protoplanetary disks. Collisional outcomes also depend on geometrical cross sections of initial aggregates. In the previous paper, we performed three-dimensional -body simulations of sequential collisions of aggregates composed of a number of sub-micron-sized icy particles and examined radii of gyration (and bulk densities) of the obtained aggregates. We showed that collisional compression of aggregates is not efficient and that aggregates remain fluffy. In the present study, we examine geometrical cross sections of the aggregates. Their cross sections decreases due to the compression as well as their gyration radii. It is found that a relation between the cross section and the gyration radius proposed by Okuzumi et al. is valid for the compressed aggregates. We also refine the compression model proposed in our previous paper. The refined model enables us to calculate the evolution of both gyration radii and cross sections of growing aggregates and reproduces well our numerical results of sequential aggregate collisions. The refined model can describe non-equal-mass collisions as well as equal-mass case. Although we do not take into account oblique collisions in the present study, oblique collisions would further hinder compression of aggregates.
1 INTRODUCTION
In the theory of planet formation, planets are thought to have formed in protoplanetary disks through mutual collisions and coalescence of planetesimals. The formation process of planetesimals, on the other hand, still has a large uncertainty. Before the planetesimal formation, dust grains grow through their collisional coalescence in a protoplanetary disk and settle to the disk mid-plane, which forms a dense dust layer at the mid-plane (e.g., Safronov, 1969; Nakagawa et al., 1981; Tanaka et al., 2005; Dullemond & Dominik, 2005). Planetesimals would be formed in the dust layer through gravitational instability (e.g., Goldreich & Ward, 1973; Sekiya, 1998; Youdin & Shu, 2002), streaming instability (e.g., Youdin & Goodman, 2005; Youdin & Johansen, 2007) or simple coalescence (e.g., Weidenschilling & Cuzzi, 1993; Brauer et al., 2008a, b). In these models of planetesimal formation, motion of dust grains is an important factor because it determines the spatial distribution of dust grains and the collision speed between them. Furthermore, their motion is governed by the drag forces from the disk gas.
Gas drag forces on dust grains strongly depend on their internal structure (or their bulk densities). Most studies of dust growth in protoplanetary disks have assumed compact structure of dust grains. However, dust grains growing through mutual collisions would actually be aggregates of (sub-micron) primitive grains and the aggregates have a fluffy structure with an extremely low bulk density, as reported by experimental and theoretical studies (e.g., Blum & Schräpler, 2004; Ormel et al., 2007; Suyama et al., 2008; Okuzumi et al., 2009; Zsom et al, 2011). Such fluffy aggregates have large ratios of their geometrical cross sections to masses, which significantly enhance gas drag forces on them compared with compact dust grains. Hence, in order to clarify dust growth and planetesimal formation in protoplanetary disks, we have to examine the internal structure and the geometrical cross sections of dust aggregates (we use a term ‘cross section’ in referring to ‘geometrical cross section’, hereafter).
Suyama et al. (2008) (hereafter S08) performed -body numerical simulations of sequential aggregate collisions to examine the compression process of growing aggregates. The sequential collisions mean that we repeat collisions of aggregates obtained at the previous collisions. With such a simulation, we can observe a natural evolution of the aggregate structure. Their numerical results showed that large aggregates have an extremely low bulk density in spite of compression at aggregate collisions. In the early stage of dust growth, aggregates just stick without any restructuring because of their low impact energy and they have a fluffy structure with an extremely low bulk density as they grow. In the later stage in which the impact energy exceeds a critical energy, aggregates are gradually compressed. Even in this compression stage, their density remains very low. It is found that the compressed aggregates have a low fractal dimension of 2.5. This structural feature causes the low density of the compressed aggregates. S08 also derived a formula describing the density evolution of growing aggregates. To estimate their bulk densities, S08 used the so-called gyration radii of the aggregates but did not examine their cross sections. However, cross sections are directly related to the gas drag forces rather than gyration radii. It is necessary to clarify the evolution of cross sections of dust aggregates during their growth.
Cross sections of aggregates depend on their internal structure. There are two simple aggregate models. One is Ballistic Cluster-Cluster Aggregation (BCCA). A BCCA cluster is formed through collisions between two equal-sized clusters. Second is Ballistic Particle-Cluster Aggregation (BPCA). A BPCA cluster is formed through deposition of small monomer particles on a large cluster. For both BCCA and BPCA, restructuring is assumed to be negligible at each collision. The BCCA clusters have very fluffy and open structures and the BPCA clusters have relatively compact structures. Figure 1 shows the ratios of cross sections to masses of aggregates. It is shown that the cross section per mass strongly depend on aggregate types. Cross sections of dust aggregates are expected to be between those of BCCA and BPCA clusters. One may consider that a cross section is approximately given by the square of a gyration radius. Cross sections of aggregates are, however, generally independent of their gyration radii, especially for highly fluffy aggregates. The non-dimensional ratio of the cross section to the square of the gyration radius gradually decreases with their growth for BCCA clusters (Minato et al. 2006; see also Fig. 6). On the other hand, this ratio is almost constant in the growth of BPCA clusters. Okuzumi et al. (2009) proposed a useful relation between the cross section and the gyration radius for various aggregates formed through hit-and-stick growth (as well as BCCA and BPCA). Paszun and Dominik (2009) also derived another relation. Nevertheless, it is not clear whether these relations are also valid for aggregates compressed at collisions. We check the validity of these relations, using the resultant aggregates obtained by S08.
Once we find a valid relation between the cross sections and the gyration radii, it would be very helpful to describe the evolution of the cross sections because the compression model by S08 can describe gyration radii of growing aggregates. The compression model by S08, however, has some limitations. This model is not directly applicable to low-energy collisions (i.e., hit-and-stick collisions) or to non-equal-mass collisions. In order to describe gyration radii and cross sections of aggregates for all growth stages seamlessly, we further refine the compression model, by removing these limitations.
In laboratory experiments, Weidling et al. (2009) examined compression of aggregates consisting of 1.5m-diameter SiO2 spheres at their multiple rebounds and also developed an empirical compression model. Initial aggregates in their experiments possess a volume filling factor of , which is approximately equal to that of BPCA clusters. On the other hand, S08 and the present paper focus on the compression of fluffier aggregates of which filling factor is between BCCA and BPCA clusters during their collisional growth. Hence our compression model and theirs are complementary to each other. As mentioned above, dust aggregates are expected to have much smaller bulk densities than BPCA clusters at the early stage of their growth in protoplanetary disks. Our compression model is useful as long as bulk densities of aggregates is lower than that of BPCA clusters.
It should be noticed that S08 only considered head-on collisions of aggregates in their numerical simulations of sequential collisions. The oblique collisions are expected to hinder the compression (Wada et al. 2007; Paszun and Dominik 2009). In the present study, however, we use the results in S08 as the first step. We will examine the effects of oblique collisions in future work.
In the next section, we briefly summarize the results of S08. In Section 3, we numerically calculate cross sections for the aggregates obtained by S08. We find that Okuzumi et al’s relation between the cross section and the gyration radius is valid for compressed aggregates, too. In Section 4, we refine the compression model by S08, by removing its limitations in a reasonable way. We find that the refined compression model reproduces well both of gyration radii and cross sections of aggregates obtained by the numerical simulation, with the help of Okuzumi et al’s relation. We also check the validity of the refined model for non-equal-mass collisions with additional numerical simulations of aggregate collisions. A summary is given in the last section.
2 RESULTS OF AGGREGATE COMPRESSION IN -BODY SIMULATIONS BY S08
Suyama et al. (2008) performed -body numerical simulations of head-on aggregate collisions and examined the density evolution of aggregates growing through the collisions. We examine the cross section of the resultant aggregates obtained by S08. Before that, we briefly describe the numerical results of S08.
In the simulations, aggregates consist of a large number of icy spherical particles with a radius of m. S08 adopted the particle-interaction model by Wada et al. (2007). In the interaction model, repulsive and adhesive forces in the normal direction between particles in contact are given by the JKR theory (Johnson et al. 1971). A tangential force and a torque also arise to resist the slide, roll, and twist motions between them. Aggregate compression is regulated mainly by inelastic rolling motions of the constituent particles (e.g., Dominik & Tielens 1997; Wada et al. 2007, 2008 [hereafter W07,W08] ; Güttler et al. 2010). The rolling energy is the energy required for rolling a particle on its contact neighbor by an angle of . The rolling energy is given by (W07, S08)
| (1) |
where is the critical displacement for inelastic rolling motion. The parameter range of is set to be from 2 to 16 Å in S08. A large rolling energy suppresses the restructuring of aggregates. To examine the structure evolution of growing aggregates, S08 performed -body simulations of sequential collisions. Each simulation starts from a collision of aggregates composed of two particles (i.e., dimers) and ends with a collision of aggregates composed of 16,384 particles. The resultant aggregate obtained in the previous collision is used as initial aggregates at each collision in the simulation of sequential collisions. The impact velocity is constant in sequential collisions. For various (constant) impact velocities and critical rolling displacements, they performed a large number of runs of sequential collisions.
As an index of the size of an aggregate, S08 adopted the radius of gyration, , defined by
| (2) |
where is the position of particle , is the position of the center of mass of the aggregate, and is the number of particles composing the aggregate. Using the radius of gyration, the volume and the bulk density of the aggregate are evaluated to be (Mukai et al. 1992; W08)
| (3) |
| (4) |
respectively, where is the so-called characteristic radius of an aggregate and is the mass of a constituent particle.
Aggregates are expected to have a BCCA structure for collisions at sufficiently low velocity because of sticking together of equal-mass aggregates without any restructuring. If the compression is effective at collisions, the gyration radii of aggregates would become smaller than those of BCCA clusters. It is meaningful to compare the obtained aggregates with BCCA clusters. Since BCCA clusters have a fractal dimension of , the radius of gyration of the BCCA cluster is given for large by (e.g., Mukai et al. 1992; W08 ) 111Exactly speaking, equation (5) is satisfied for BCCA clusters formed through head-on (hit-and-stick) collisions, which have the fractal dimension of 2.0. When offset collisions are also included at the formation of BCCA, their fractal dimension is 1.9 and the gyration radii proportional to (Okuzumi et al. 2009). Although the later BCCA is more realistic, the former BCCA is used in S08 and the present study since S08 consider only head-on collisions in their simulations.
| (5) |
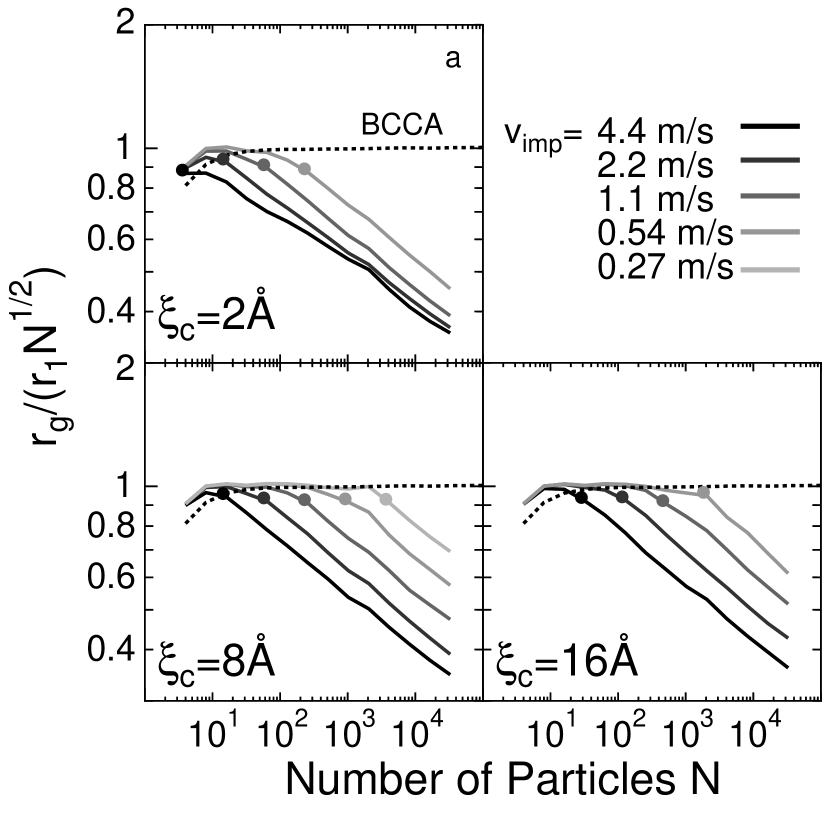
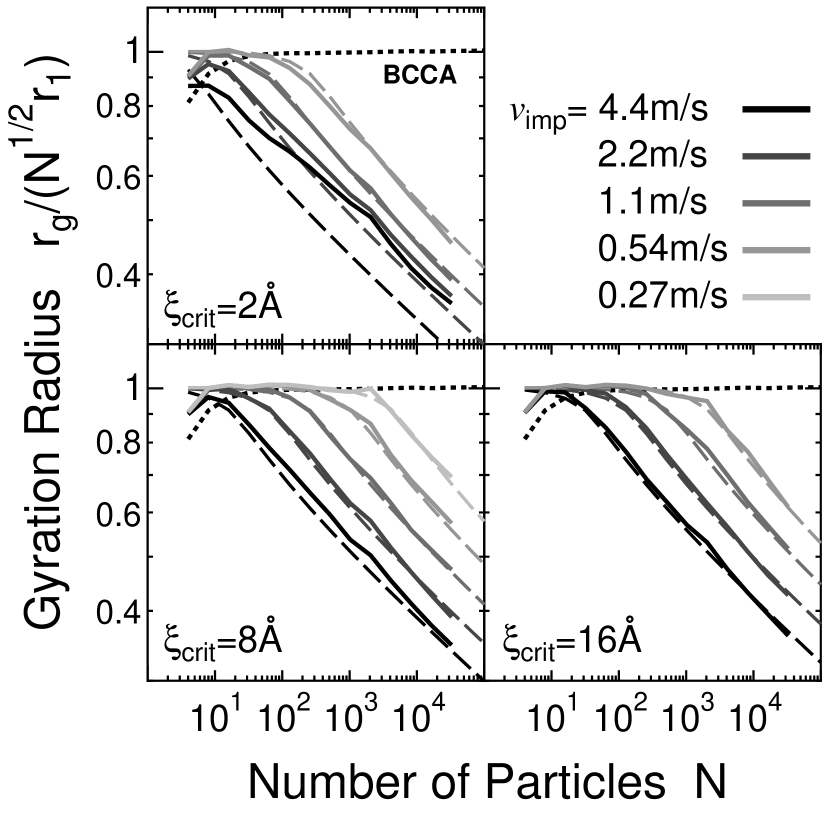
Figure 2a shows the gyration radius of the aggregates in the simulations of sequential collisions performed by S08 for various values of parameters, and the impact velocity . The density of monomer particles is given by . In the simulation of sequential collisions, the size of growing aggregates is dependent on the direction of each collision. S08 did 30 runs of the simulation of sequential collisions and obtained the averaged value of from 30 runs for each and . In Figure 2a, the horizontal axis is the number of the constituent particles, , in the growing aggregates and the vertical axis is the gyration radii divided by for comparison with BCCA clusters. The dashed line represents the radius of the BCCA cluster and it is almost flat for large as expected from equation (5). The size of small aggregates produced in our simulation is almost the same as that of BCCA clusters. This is because the impact energy is small enough at the early stage of the aggregate growth and the compression is ineffective at each collision. As the aggregates grow, the impact energy increases. When the impact energy attains to , the compression of the aggregate starts: aggregates become smaller than BCCA clusters. The critical number of particles, , in the aggregate for compression is given by (W08, S08)
| (6) |
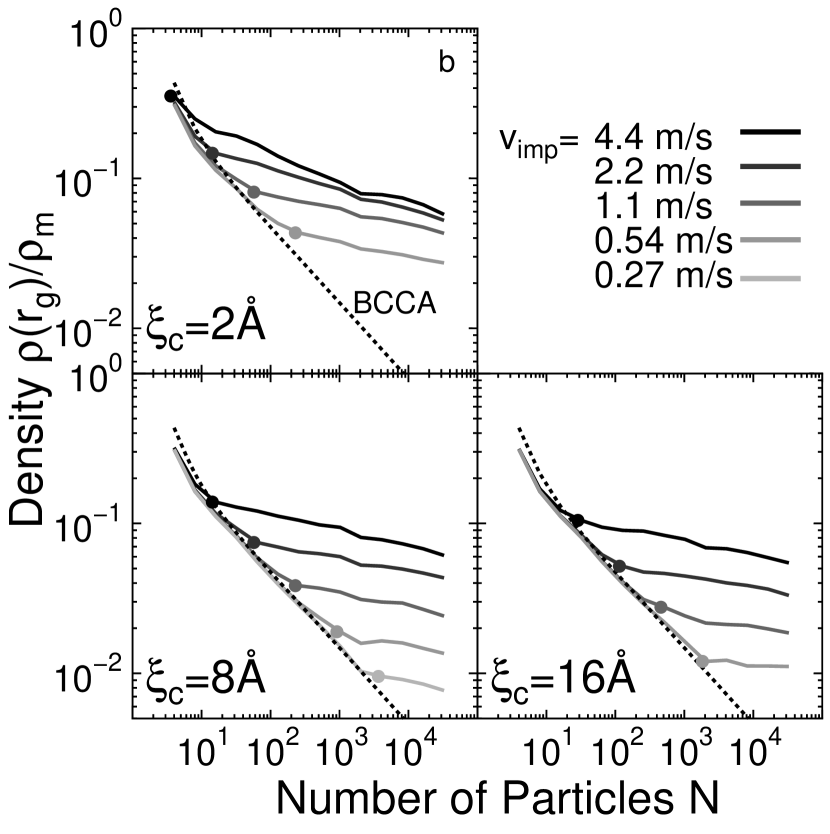
where is a non-dimensional coefficient. In Figure 2a, we also plot the critical number with filled circles on each curve, by setting . Figure 2b shows bulk densities of growing aggregates in these simulations, which evaluated with by equation (4). We also plot the density of BCCA clusters. It decreases as for large . After the onset of compression (i.e., ), the bulk densities of the aggregates obtained by the numerical simulation are larger than that of the BCCA but still keep on decreasing gradually in all cases, indicative of the inefficiency of collisional compression. S08 also developed the compression model, which reproduces the density evolution of growing aggregates in the compression stage. We will describe the compression model in Section 4.
3 GEOMETRICAL CROSS SECTIONS OF AGGREGATES PRODUCED IN THE SEQUENTIAL COLLISIONS
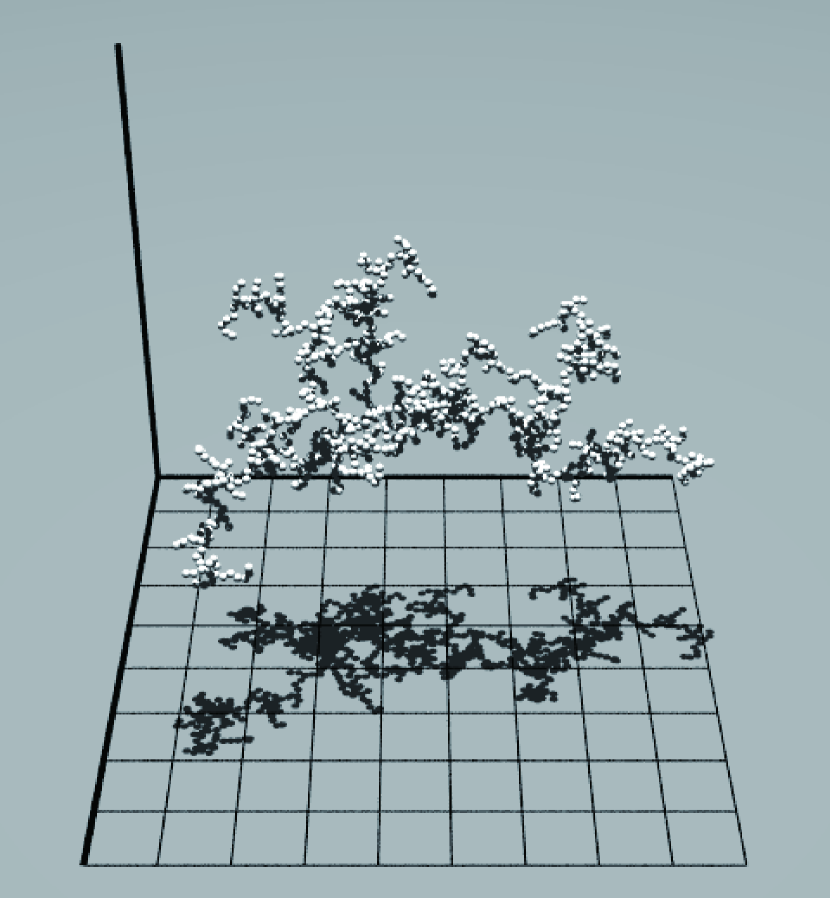
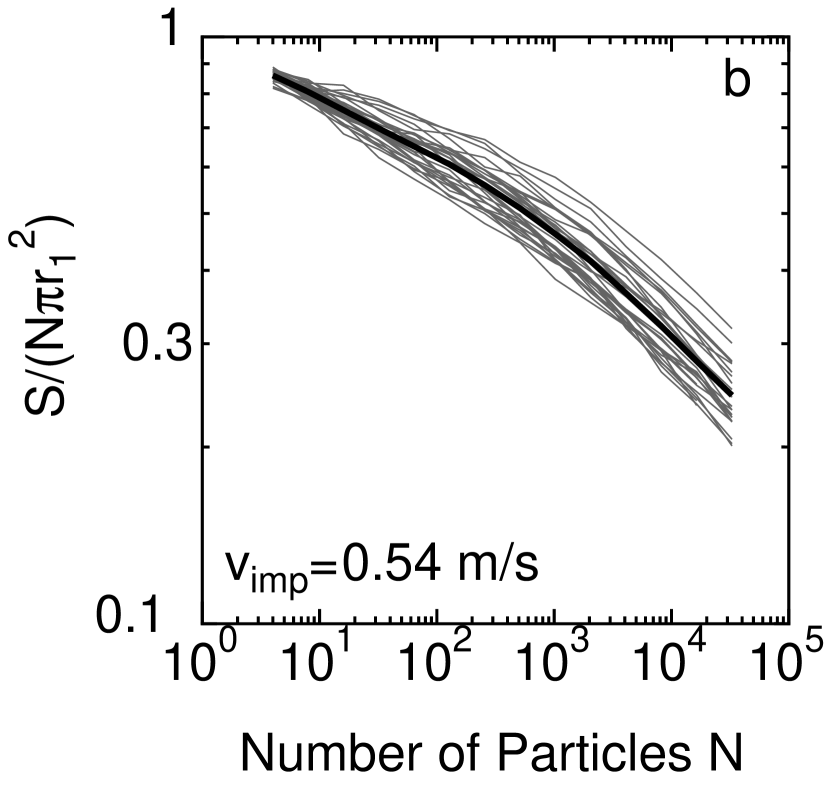
We numerically calculate cross sections of resultant aggregates obtained by S08. The cross section of a dust aggregate is given by the area of the shadow of the aggregate projected onto a plane. The area of the shadow is calculated by counting the number of square meshes in the shadow (Fig. 3). The width of the square meshes is set to be . This width is much smaller than the radius of the monomer particle, , though meshes with a much wider width are drawn to emphasize them in Figure 3. The area of the shadow is dependent on the plane onto which the shadow is projected. We calculate the areas of the shadows for 30 orientations randomly chosen and define the cross section of the aggregate by the mean values of the areas. Figure 4 shows the cross section calculated in this way for aggregates produced in the simulations of sequential collisions. The vertical axis is the cross section divided by , which corresponds to the (non-dimensional) cross section per mass. If the overlapping of the monomer particles in the shadow is negligibly small, the value of the vertical axis approaches unity. A filled circle in Figure 4a indicates the shadow area for each orientation and the line shows the mean of them. The cross section per mass decreases as an aggregate grows in the simulation of sequential collisions due to the overlapping of the constituent particles. Since S08 did 30 independent runs of sequential collisions, the mean cross sections are calculated and plotted as thin lines in Figure 4b. Then we obtain the averaged value of the 30 mean cross sections as shown by the thick line in Figure 4b. The dispersion of the mean geometrical cross section can be evaluated in Figure 4b. The standard deviation of the mean geometrical cross section is equal to or less than 11% of its averaged value during the aggregate growth. In this way, we did two kinds of averaging to calculate the cross section of growing aggregates in the simulation. We show and discuss the cross sections of aggregates by using these finally-obtained cross sections hereafter.
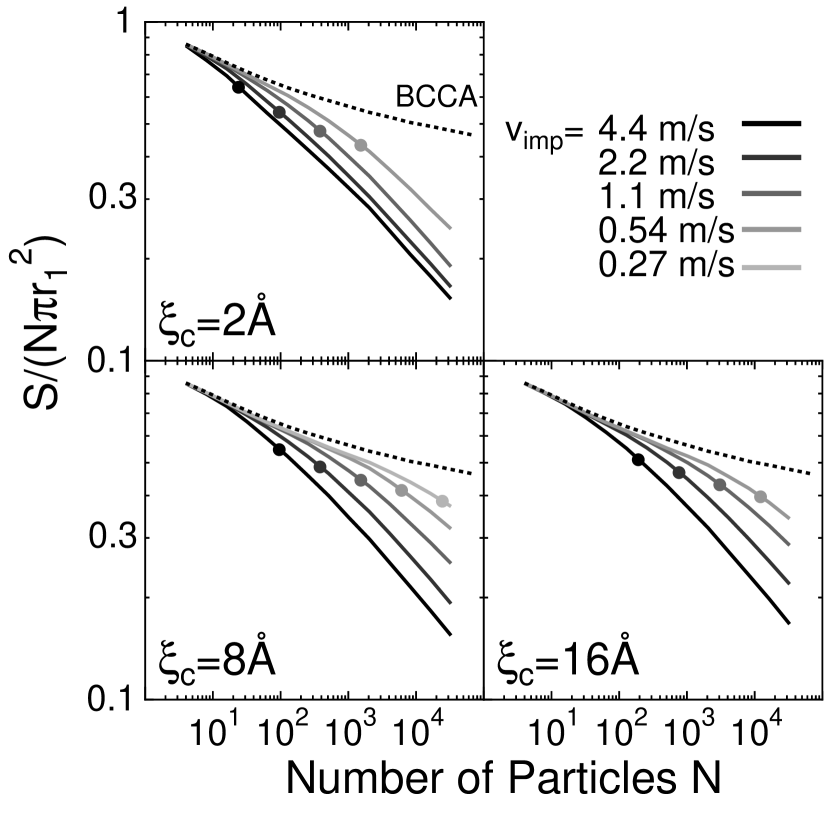
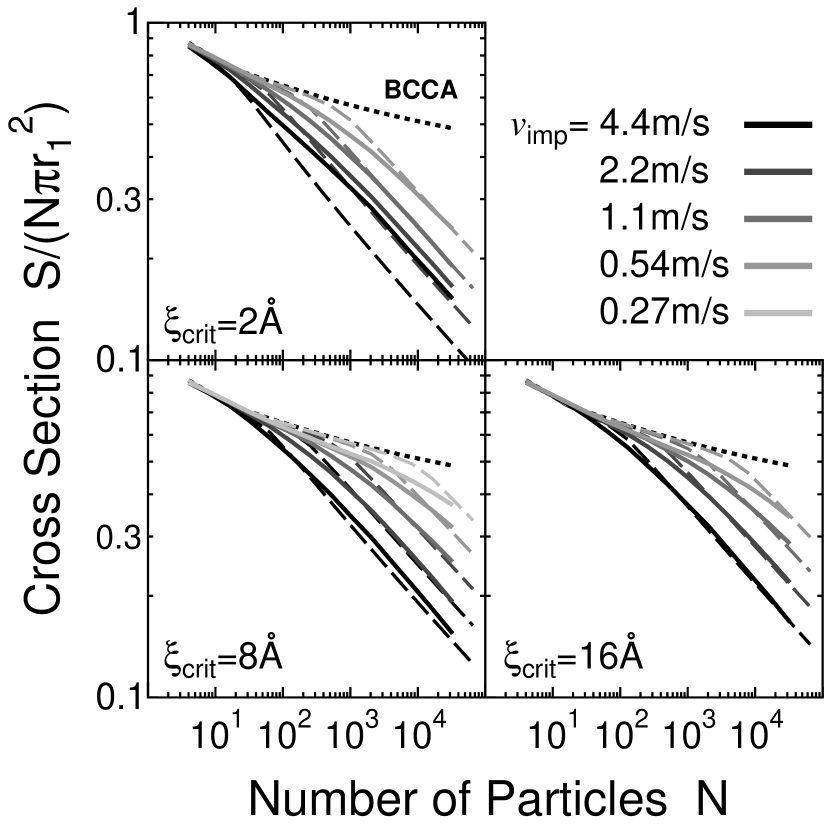
Figure 5 shows the cross section of resultant aggregates for various values of the parameter set (). The averaged cross section of the BCCA cluster is also calculated and plotted. The cross section of BCCA we obtained agrees with the result of Minato et al. (2006). Even for BCCA, the ratio gradually decreases with an increase in due to the overlapping of constituent particles. In the early stage of the aggregate growth (i.e. for small ), the cross sections of the resultant aggregates change almost along the line of BCCA. As the aggregates grow, however, their cross sections deviate from the line of BCCA and become much smaller than that of BCCA, which is due to compression at collisions. This qualitative tendency is consistent with the evolution of the radius of gyration (Fig. 2a). Although the change in the cross sections is gradual and the starting points of compression in the cross sections are not clear compared with those in the gyration radii, the starting points are also described by equation (6), by setting the parameter to be 2.0. The larger value of than Figure 2 indicates that the onset of compression in the cross section is later than that in the gyration radius.
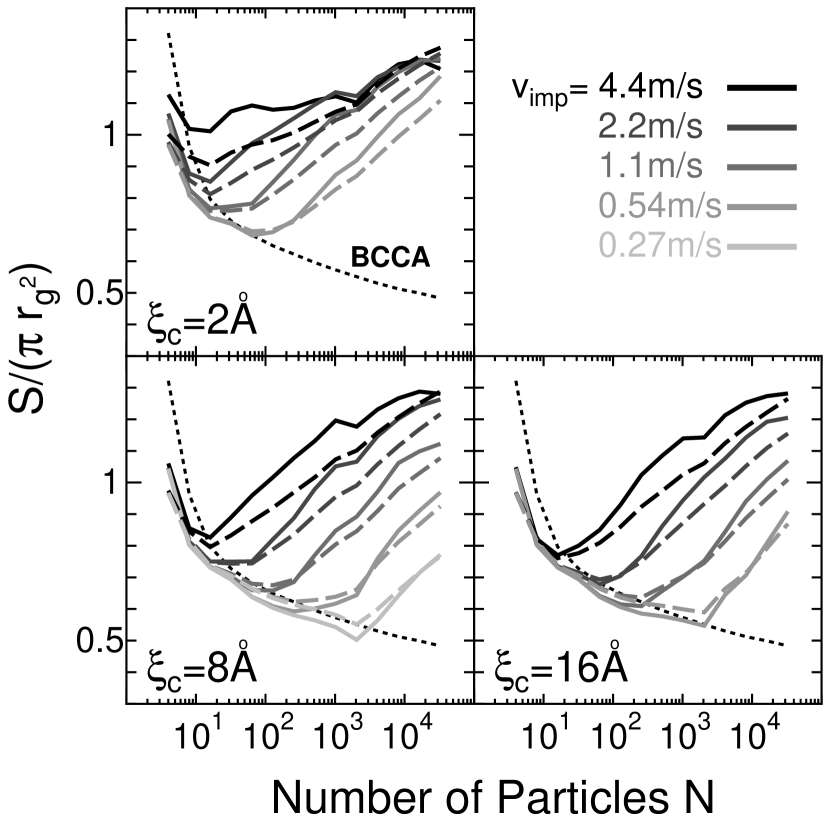
In Figure 6 we plot the ratio of the cross section to for all resultant aggregates with solid lines. The ratio of to decreases for small aggregates, which is consistent with the BCCA case (dotted lines). For sufficiently large aggregates, the ratio increases as a result of their compression. Okuzumi et al. (2009) proposed a useful expression of the cross section for aggregates formed through hit-and-sticks. The expression is given by
| (7) |
where the cross section of the BCCA cluster is given by (Minato et al. 2006)
| (10) |
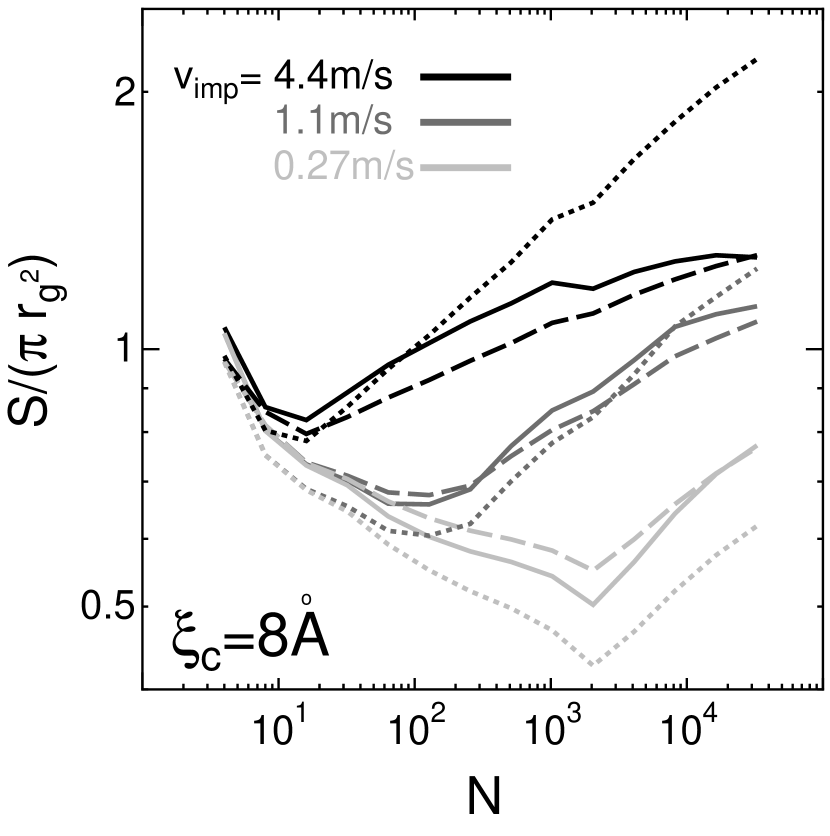
Equation (5) is used as the expression of . We also plotted the cross sections obtained from equation (7) with dashed lines in Figure 6. It is found that the expression by Okuzumi et al. (2009) reproduces the cross section surprisingly well for compressed aggregates as well as hit-and-stick aggregates, by using the gyration radius . In this expression, the information of compression is correctly included through the gyration radius. Paszun and Dominik (2009) also derived another relation between and the aggregate size (i.e., eq.[11] of their paper). Figure 7 is the same as the left-bottom panel of Figure 6 but the prediction by Paszun and Dominik is also plotted. Although the prediction by Paszun and Dominik is consistent with the numerical results, it overestimates when the ratio is larger than unity (i.e., for relatively compact aggregates) and underestimates for . The underestimation was also reported by Okuzumi et al. They found that the underestimation in Paszun and Dominik’s model is severe especially for large and fluffy aggregates. For other , we also find the same trend as in the case of shown in Figure 7. Hence it is concluded that the model of Okuzumi et al. is more accurate than that of Paszun and Dominik. Once an accurate compression model describing is obtained, it enables us to calculate the evolution of the cross section with the help of Okuzumi et al’s model.
4 COMPRESSION MODEL
A compression model describing was developed by S08 but it has two limitations. The model is not directly applicable to low-energy collisions (i.e., hit-and-stick collisions at the early growth stage) or to non-equal-mass collisions. In order to describe gyration radii and cross sections of aggregates for both the early hit-and-stick stage and the compression stage seamlessly, we refine our compression model, by removing these limitations in a natural way. Before that, we briefly describe the compression model by S08.
4.1 Compression Models of W08 and S08
W08 developed a compression model by introducing the pressure (or the strength) of aggregates to explain their numerical results on collisions between BCCA clusters. The compression model of S08 is based on that of W08. At a collision of two aggregates with the impact energy , the compression of the merged aggregate from the initial volume, , to the final volume, , is described in the model of W08 by
| (11) |
The initial volume is defined by the volume of the merged aggregate at the moment that the two aggregates just stick. After the moment of the sticking, the compression proceeds. The volumes before and after the compression are evaluated with the radius of gyration, , as in equation (3). The pressure of the aggregates is given by
| (12) |
where the fitting parameter is set to be 0.15. Note that the pressure of the aggregates is dependent on the total number of constituent particles (or the total mass) as well as the density. That is, is not an intensive variable. This strange property in the pressure comes from the fractal structure of the aggregates. W08 showed with their simulation of collisions between BCCA clusters that the compressed aggregates have internal structures with a fractal dimension of 2.5. The simulation of sequential collisions done by S08 showed that their resultant aggregates also have the same fractal dimension of 2.5.
In order to describe the compression of such fractal aggregates, W08 also introduced the fractal volume defined by
| (13) |
where the coefficient is given by . Using the fractal volume, the fractal density is defined by
| (14) |
The dimensions of the fractal volume and the fractal density differ from those of the ordinary volume and density. These fractal quantities are related with the ordinary quantities and as
| (15) | |||||
| (16) |
where () is the volume of a monomer and is given by . Using the fractal volume (and the fractal density ), equation (11) is rewritten as
| (17) |
where the fractal pressure is given by
| (18) |
It should be noticed that the fractal pressure is dependent on but not on the total mass. That is, is an intensive variable. Equation (17) (or [11]) reproduces the numerical results on the compression at collisions between BCCAs.
S08 pointed out that W08’s compression model needs a minor modification to describe the compression of partially compressed aggregates at their collisions, which occurs in their simulation of sequential collisions. At the moment of sticking at each collision, large voids are produced in the merged aggregate. The volume of the new voids is included in the initial volume of the merged aggregate, in equation (17). The energy required for compression of the new voids is and it is much smaller that that predicted by equation (17) at collisions between partially compressed aggregates. To describe the compression at such collisions, S08 modified W08’s model. Since the energy required for the crush of the new voids is negligible, the initial fractal volume of the merged aggregate in equation (17) is set to be the sum of the fractal volumes of two colliding aggregates, by removing the volume of the new voids. That is,
| (19) |
Using equations (17)-(19), we have the (final) fractal density of the merged aggregate, , produced at collisions of two equal-mass aggregates with the fractal density
| (20) |
where is the number of constituent particles in the merged one. Equation (20) describes the density evolution of partially compressed aggregates growing through mutual collisions. Equation (20) with reproduces the density evolution of growing aggregates in Figure 2 for , as seen in Figure 8 of S08.
4.2 Refinement of the Compression Model
The compression model by S08 is not applicable to the early growth stage () where the compression is ineffective. This is because the energy required for the crush of the new voids is neglected in the model. This limitation is removed, by taking into account the compression process of the new voids produced at sticking of two aggregates. Furthermore, the model of S08 assumes the collisions of equal-mass aggregates. We also remove this limitation in a reasonable way. At the extension of our compression model to non-equal-mass collisions, we assume that the compressed aggregates have the fractal dimensions of 2.5 as well as in the case of equal-mass collisions. The validity of the assumption will be discussed in Section 5.
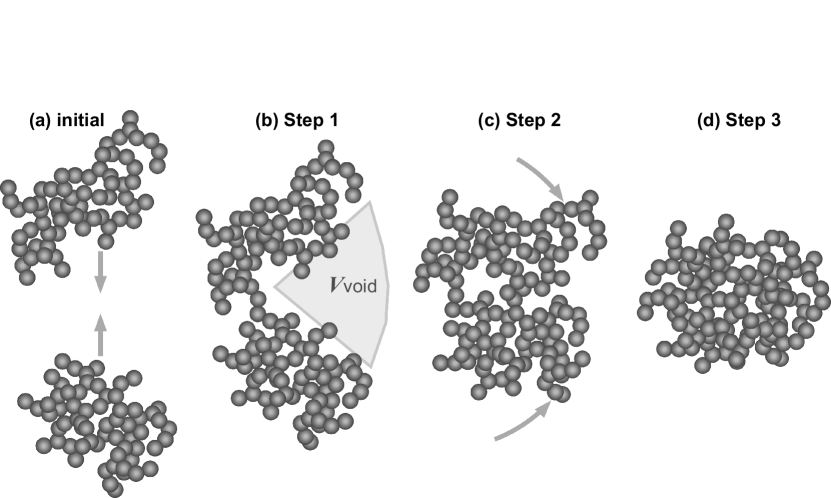
Density evolution of aggregates at each collisions is divided into the following three steps:
-
1.
Creation of new voids at the sticking of two aggregates.
-
2.
Compression of the new voids in the merged aggregate.
-
3.
Further compression of the merged aggregate after the crush of the new voids.
These steps are schematically explained by Figure 8. We describe the change in the volume or the density of the aggregates at each step in detail below.
In Step 1, the density decreases because of the new voids in the merged aggregate. The change in the density is described by Okuzumi et al. (2009). When the two aggregates with the masses , , and the volumes , () collide with each other, the volumes of the merged aggregate (before the compression) is given by
| (21) |
where the volume of the voids is obtained from the empirical formula
| (22) |
(see Okuzumi et al. [2009] for the derivation). The collision of equal-mass aggregates is not assumed in Okuzumi et al. (2009). Note that is 0.83 for BCCA clusters formed through head-on collisions having the fractal dimension . The density of the merged aggregates before the compression is given by (. The fractal volume and the fractal density are obtained from equations (15) and (16), respectively.
In Step 2 and 3, the merged aggregate is compressed and the density increases. Step 2 is the compression of the new voids. We put the energy required for the crush of the new voids to be , where is the non-dimensional parameter. By fitting with results of the simulation, this parameter is fixed to be , as will be shown in the next subsection. This relation would be reasonable because both parameters are related to the beginning of compression.
When the impact energy is smaller than , the new voids are only partially compressed at Step 2. In this case, the compression at Step 3 does not occur because of the small impact energy. The impact energy is evaluated using the reduced mass, . In this case, the decrease in the fractal volume of the merged aggregates, , is evaluated to be
| (23) |
where
| (24) |
It should be noticed that the fractal volume defined by equation (24) is negative in collisions where the volume ratio is larger than . A prescription for such high-volume-ratio collisions will be described at the end of this subsection. Here we consider the case where is positive. Then the final fractal volume after the compression is given by
| (25) |
and the final fractal density of the merged aggregate is given by .
When the impact energy is larger than , the new voids are crushed completely and the merged aggregate is further compressed at Step 3. Since the fractal volume of the merged aggregate is at the end of Step 2, the final fractal volume after Step 3 is obtained from the equation
| (26) |
Integrating the RHS of equation (26), we obtain the final fractal density for as
| (27) |
where we used
| (28) |
In the limit of , equation (27) is identical to equation (20) (or the compression model by S08). The final fractal volume is given by . ¿From the fractal density, we obtain the gyration radius , using equation (14). The cross section is also obtained from Okuzumi et al’s expression (eq.[7]). In this way, we can calculate the density evolution (i.e., the evolution of and ) at both low- and high-energy collisions, using equation (25) for and equation (27) for .
In high-volume-ratio collisions where , as noticed above, is negative and a special prescription is necessary. Since a negative means no voids, Step 2 should be omitted and the merged aggregate is compressed only with Step 3. That is, equations (26)-(28) are used for all impact energies in this case. In equations (26)-(28), the terms of is omitted and is replaced by because Step 2 does not occur.
4.3 Test of the Refined Compression Model
Let us test the refined compression model with the numerical results. Using the refined compression model, we calculate the evolution of gyration radius for the same condition as the numerical simulations by S08 and also obtain the cross sections of the aggregates with equation (7). The results are shown in Figures 9 and 10. In Figure 9, we plot the evolution of the gyration radius calculated with the refined compression model and compared it with the numerical results by S08. The parameters and are set to be and , respectively. With this setting of the parameters, the refined model reproduces well the numerical results at both the early growth stage and the compression stage. Figure 10 shows the evolution of the cross sections and indicates that the refined model also succeeds in describing the cross sections with the help of equation (7).
In the above, the evolution of gyration radius of growing aggregates are calculated with the refined compression model and their cross sections are indirectly calculated, by using and equation (7). We also propose another way to describe the cross sections of aggregates. We define alternative characteristic sizes of aggregates by
| (29) |
It would be possible to describe the evolution of directly (instead of the gyration radius) with the refined compression model in the following way. Using this characteristic size instead of , we can define the volume and the bulk density of the aggregate by the similar equations to (3) and (4). The fractal volume and the fractal density are also defined in the same way. Then, applying the refined compression model to the fractal density defined with , we can describe the evolution of as well as in the case of . The evolution of the cross section is calculated with equation (29). This is a direct way to describe the cross section rather than the above. In this calculation of , we have to be cautious with the following two points. One is the modification in equation (21). At a collision of sufficiently fluffy aggregates, equation (21) can give the volume larger than that of the BCCA cluster with the same mass, when the size is used instead of . Such a large is not realistic. In this case, we set the volume instead of equation (21). The other point is the parameter . Although is set to be 0.15 in the case of , we have to calibrate the parameter again in the case of as a result of the fitting with numerical results. In Figure 11, we plot the evolution of calculated with this direct way. In this calculation, the parameters are set to be and . We see that the refined model works well for the evolution of the cross sections with this direct way, too.222 In the early growth stage of Figure 11, we used instead of equation (21) when the volume of equation (21) is larger than , as mentioned above.
It is found that the refined compression model enables us to describe the whole evolution of the radius of gyration and the cross section of growing aggregates. Note that the refined model is applicable to non-equal-mass collisions though the tests in Figure 9-11 are done only in the equal-mass case. At the extension of the refined model to non-equal-mass collisions, the fractal dimension of compressed aggregates is assumed to be 2.5 even in the case of non-equal-mass collisions though it is not verified with -body simulations in non-equal-mass cases. It is possible that a very large mass ratio increases the fractal dimension, as seen in BPCA clusters. Okuzumi et al. (2009) examined the effect of the mass ratio on the fractal dimension for aggregates growing with hit-and-stick collisions with -body simulations. They showed that the collisions with the mass ratio of 10 increases the fractal dimension only by 0.1 (see their figure 6). Furthermore, collisions with such a mass ratio have a major contribution at dust growth in protoplanetary disks, as shown by Okuzumi et al. (2009,2012). Hence the effect of non-equal-mass collisions would not change largely the fractal dimension of compressed aggregates in the realistic growth process.
To confirm the validity of the refined model in non-equal-mass collisions, we have further performed additional -body simulations of aggregate collisions. Similar to W08, we consider collisions of two BCCA clusters but their masses are not equal in the present case. The projectile BCCA cluster consists of 1024 particles (or 4096 particles) while the number of constituent particles of the target BCCA cluster is 16384. Their mass ratio is (or ). The constituent particles are icy ones with the radius with 0.1 m. The impact velocity is a parameter. We set ms-1 since we focus on the compression process rather than fragmentation (Wada et al. 2007,2008). The numerical results of compression at the non-equal-mass collisions are shown in Figure 12. The predictions by the refined model with are plotted by solid lines and the dashed line indicates the formula by W08 (their equation [45]). The numerical results in the non-equal-mass collisions approximately agree with the predictions by the refined model though upper shifts by 20% are observed in the case of . As well as in the case of equal-mass collisions, the slope in - relation is approximately given by -0.1, which indicates that compressed aggregates have the fractal dimension of 2.5. The upper shifts in the numerical results indicate that the compression requires larger impact energy in non-equal-mass collisions than the equal-mass case. This effect in non-equal-mass collisions would be included by adopting a larger parameter in the refined model. Furthermore, for high-mass-ratio collisions with , the refined model is not verified through -body simulations yet although such collisions have only a minor contribution in dust growth (Okuzumi et al. 2009,2012). In the future work, the effect of non-equal-mass collisions should be further examined in the numerical simulation of sequential collisions as done by S08 in order to calibrate the parameter more accurately.
5 SUMMARY
We examined the evolution of the geometrical cross section of the growing (icy) aggregates obtained by -body simulations of sequential head-on collisions (S08) and constructed to construct a refined compression model, which is applicable to the description of the evolution of both geometrical cross sections and gyration radii of growing aggregates. The results are summarized as follows:
-
1.
We examined geometrical cross sections of the aggregates produced in the simulation of sequential collisions done in our previous paper. As aggregates grow, compression becomes effective and makes their cross sections smaller than those of the BCCA clusters. The beginning of the compression is given by equation (6), as seen in the evolution of the gyration radius.
-
2.
The relation between the cross section and the gyration radius seen in aggregates obtained by S08 is well described by Okuzumi et al’s expression. This indicates that Okuzumi et al’s expression is valid for compressed aggregates as well as hit-and-stick aggregates. If the evolution of the gyration radius is well described by a compression model, Okuzumi et al’s expression enables us to calculate the cross section, too.
-
3.
We further refined the compression model of S08, by including the compression energy for the voids produced at the sticking of two aggregates. The refined model is also extended to non-equal-mass collisions in a reasonable way. With the refined model, we can accurately reproduce the evolution of both the gyration radius and the cross section of aggregates obtained by S08 from their early growth stage. The validity of the refined compression model for non-equal-mass collisions is also checked by additional numerical simulations of BCCA collisions. Although S08 considered only icy aggregates in the numerical simulation, our compression model would be also applicable to silicate aggregates by using a suitable value of .
Our -body simulations of aggregate collisions and the refined compression model indicate that collisional compression is not so effective. As a result, dust aggregates (or initial planetesimal material) would have extremely low bulk densities, as suggested by S08. Okuzumi et al. (2012) showed that such extremely low bulk densities of aggregates accelerate their growth in protoplanetary disks and help their overcoming of the radial drift barrier against the planetesimal formation. However, solar-system bodies do not have such low densities at present. Dust aggregates (or planetesimals) should be compressed by other processes. A steady ram pressure due to the gas drag on aggregates and a self-gravity of sufficiently large aggregates would be candidates for aggregate compression, as indicated by S08 and Okuzumi et al. (2012). For relatively compact dust cakes (gcm3) made of micron-sized silicate particles, compression is observed at a pressure Pa (Blum and Schräpler 2004). However, for icy aggregates with very low bulk densities (gcm3), compressive strength has not yet been measured. In future work, compression strength of very fluffy aggregates should be measured in numerical simulations and laboratory experiments.
In the present study, we focus on the aggregates obtained at head-on collisions. At oblique collisions, the merged aggregates are elongated (W07; Paszun and Dominik 2009). Although our model indicates inefficient compression at aggregate collisions, the effect of oblique collisions would further hinder compression. In future work, we should clarify the validity of our compression model in the case where oblique collisions are included.
References
- Blum & Schräpler (2004) Blum, J., & Schräpler, R. 2004, Phys. Rev. Lett., 93, 115503
- Brauer et al. (2008a) Brauer, F., Dullemond, C. P., & Henning, Th. 2008a, A&A, 480, 859
- Brauer et al. (2008b) Brauer, F., Henning, Th., & Dullemond, C. P. 2008b, A&A, 487, L1
- Dominik & Tielens (1995) Dominik, C., & Tielens, A. G. G. M. 1995, Phil. Mag. A, 72, 783
- Dominik & Tielens (1996) Dominik, C., & Tielens, A. G. G. M. 1996, Phil. Mag. A, 73, 1279
- Dominik & Tielens (1997) Dominik, C., & Tielens, A. G. G. M. 1997, ApJ, 480, 647
- Dullemond & Dominik (2005) Dullemond, C. P., & Dominik, C. 2005, A&A, 434, 971
- Goldreich & Ward (1973) Goldreich, P., & Ward, W. R. 1973, ApJ, 183, 1051
- Goldstein (1950) Goldstein, H. 1950, Classical Mechanics (Reading: Addison-Wesley)
- Güttler et al. (2010) Güttler, C., Blum, J., Zsom, A., Ormel, C. W., & Dullemond, C. P. 2010, A&A, 513,A56
- Hayashi (1981) Hayashi, C. 1981, Prog. Theor. Phys. Suppl., 70, 35
- Heim et al. (1999) Heim, L.-O., Blum, J., Preuss, M., & Butt, H.-J. 1999, Phys. Rev. Lett., 83, 3328
- Johnson et al. (1971) Johnson, K. L., Kendall, K., & Roberts, A. D. 1971, Proc. R. Soc. London A, 324, 301
- Kempf et al. (1999) Kempf, S., Pfalzner, S., & Henning, T. K. 1999, Icarus, 141, 388
- Krause & Blum (2004) Krause, M., & Blum, J., 2004, Phys. Rev. Lett., 93, 021103
- Meakin (1991) Meakin, P. 1991, Rev. Geophys., 29, 317
- Min et al. (2006) Min, M., Dominik, C., Hovenier, J. W., de Koter, A., Waters, L. B. F. M. 2006, A&A, 445, 1005
- Minato et al. (2006) Minato, T., Köhler, M., Kimura, H., Mann, I., & Yamamoto, T. 2006, A&A, 452, 701
- Mukai et al. (1992) Mukai, T., Ishimoto, H., Kozasa, T., Blum, J., & Greenberg, J. M. 1992, A&A, 262, 315
- Nakagawa et al. (1981) Nakagawa, Y., Nakazawa, K., & Hayashi, C. 1981, Icarus, 45, 517
- Ossenkopf (1993) Ossenkopf, V. 1993, A&A, 280, 617
- Okuzumi et al. (2009) Okuzumi, S., Tanaka, H., & Sakagami, M. 2009, ApJ, 707, 1247
- Okuzumi et al. (2012) Okuzumi, S., Tanaka, H., Kobayashi, H., & Wada, K. 2012, ApJ, in press (arXiv:1204.5035)
- Ormel et al. (2007) Ormel, C. W., Spaans, M., & Tielens, A. G. G. M. 2007, A&A, 461, 215
- Paszun & Dominik (2006) Paszun, D., & Dominik, C. 2006, Icarus, 182, 274
- Paszun & Dominik (2008) Paszun, D., & Dominik, C. 2008, A&A, 484, 859
- Safronov (1969) Safronov, V. S. 1969, Evolution of the Protoplanetary Cloud and Formation of the Earth and the Planets (NASA TTF-677; Moscow: Nauka)
- Stepinski & Valageas (1997) Stepinski, T. F., & Valageas, P. 1997, A&A, 319, 1007
- Sekiya (1998) Sekiya, M. 1998, Icarus, 133, 298
- Suyama et al. (2008) Suyama, T., Wada, K., & Tanaka, H. 2008, ApJ, 684, 1310
- Tanaka et al. (2005) Tanaka, H., Himeno, Y., & Ida, S. 2005, ApJ, 625, 414
- Wada et al. (2007) Wada, K., Tanaka, H., Suyama, T., Kimura, H., & Yamamoto, T. 2007, ApJ, 661, 320
- Wada et al. (2008) Wada, K., Tanaka, H., Suyama, T., Kimura, H., & Yamamoto, T. 2008, ApJ, 677, 1296
- Weidenschilling & Cuzzi (1993) Weidenschilling, S. J., & Cuzzi, J. N. 1993, in Protostars and Planets III, ed. E. H. Levy & J. I. Lunine (Tucson: University of Arizona Press), 1031
- Weidling et al. (2009) Weidling, R., Güttler, C., Blum, J., & Brauer, F. 2009, ApJ, 696, 2036
- Youdin & Goodman (2005) Youdin, A. N., & Goodman, J. 2002, ApJ, 620, 459
- Youdin & Johansen (2007) Youdin, A. N., & Johansen, A. 2002, ApJ, 580, 494
- Youdin & Shu (2002) Youdin, A. N., & Shu, F. H. 2002, ApJ, 580, 494
- Zsom et al (2011) Zsom, A., Ormel, C. W., Dullemond, C. P., & Henning, Th. 2011, A&A, 534, A73