A Population of Dust-Rich Quasars at z 1.5
Abstract
We report Herschel111 Herschel is a ESA space observatory with science instruments provided by European-led Principal Investigator consortia and with important participation from NASA. SPIRE (250, 350, and 500 m) detections of 32 quasars with redshifts 0.5 3.6 from the Herschel Multi-tiered Extragalactic Survey (HerMES222http://hermes.sussex.ac.uk). These sources are from a MIPS 24 m flux-limited sample of 326 quasars in the Lockman Hole Field. The extensive multi-wavelength data available in the field permit construction of the rest-frame Spectral Energy Distributions (SEDs) from ultraviolet to the mid-infrared for all sources, and to the far-infrared (FIR) for the 32 objects. Most quasars with Herschel FIR detections show dust temperatures in the range of 25 K to 60 K, with a mean of 34K. The FIR luminosities range from to L☉, qualifying most of their hosts as ultra- or hyper-luminous infrared galaxies. These FIR-detected quasars may represent a dust-rich population, but with lower redshifts and fainter luminosities than quasars observed at 1 mm. However, their FIR properties cannot be predicted from shorter wavelengths (0.3–20 m, rest-frame), and the bolometric luminosities derived using the 5100 Å index may be underestimated for these FIR-detected quasars. Regardless of redshift, we observed a decline in the relative strength of FIR luminosities for quasars with higher near-infrared luminosities.
Subject headings:
galaxies: active, nuclei, starburst – infrared: galaxies – quasars: general1. INTRODUCTION
The far-infrared (FIR) properties of quasars are critical for our understanding of active galaxy evolution, as they probe the possible evolutionary connection between star formation and black hole (BH) accretion (e.g. Sanders et al., 1988; Lutz et al., 2007). Both starbursts and active galactic nuclei (AGN) could contribute to the rest-frame FIR emissions at various redshifts, although starbursts are considered to be dominant (e.g. Rowan-Robinson, 1995; Trichas et al., 2009). Other models have successfully explained FIR luminosity as originating from direct AGN heating, where cool dust at large distances from the AGN reside in a warped disk/torus (e.g. Sanders et al., 1989; Haas et al., 2003). Spectral information can be used to break this degeneracy. Polycyclic Aromatic Hydrocarbon (PAH) features, for instance, are used to indicate star formation activity (e.g. Lutz et al., 2007). Spitzer spectroscopic studies detected PAH emission in some of the Palomar-Green (PG) and Sloan Digital Sky Survey (SDSS) quasars, where strong star formation coexists with quasars, and is responsible for an average of 60% of the FIR emission (e.g. Hao et al., 2005; Netzer et al., 2007; Lutz et al., 2008; Veilleux et al., 2009; Shi et al., 2009).
Rest-frame FIR SED studies provide powerful constraints on the star formation in quasars. Despite large dispersions at different wavelengths for optically bright, unobscured quasars, their mean SEDs show surprising uniformity over redshift, luminosity, and Eddington ratio (e.g. Elvis et al., 1994, hereafter E94; Richards et al., 2006, hereafter R06; Hao et al., 2011). However, the SEDs at rest-frame 40 m were poorly defined at high redshifts (IRAS 100 m was the longest wavelength for E94 and R06). Several groups have tried to address this FIR gap with various sample selections (e.g. Papovich et al., 2006; Kartaltepe et al., 2010); others have taken advantage of (sub)millimeter observations, e.g., with the Infrared Space Observatory (ISO), the Institut de Radioastronomie Millimtrique (IRAM) telescope, and the Submillimetre Common-User Bolometer Array (SCUBA) (e.g. Omont et al., 2001, 2003; Haas et al., 2003; Priddey et al., 2003a). However, a single photometric point in the rest-frame FIR, as is the case for most (sub)mm quasar studies, does not strongly constrain the dust temperature distribution for these quasars. The sample sizes for (sub)mm quasars with enough photometric points that allow FIR SED studies, on the other hand, are limited due to the relatively long exposure times required for detections (e.g. Beelen et al., 2006; Wang et al., 2008, 2010). Only about 10 (sub)mm quasars reported to date have detailed rest-frame FIR SED measurements.
The Herschel Space Observatory (Pilbratt et al., 2010) has opened a new window (SPIRE: 250, 350, 500 m, Griffin et al., 2010) to directly study the rest-frame FIR properties for quasars with moderate redshifts ( 1.5). The Herschel Multi-tiered Extragalactic Survey (HerMES, Oliver et al., 2010; Oliver et al., 2011) covers 70 deg2 with rich multi-wavelength data. Along with other Herschel surveys, rest-frame 30–300 m emissions, likely due to cold dust in quasars and other AGNs, have been detected (Hatziminaoglou et al., 2010; Leipski et al., 2010; Serjeant et al., 2010).
In this paper, we report 32 Herschel SPIRE detections of 24 m flux-limited quasars in the HerMES Lockman Hole field. This SPIRE–detected sample constitute at least 10% of the 24 m selected quasar sample in this field, and allow construction of the complete FIR SEDs for these broad-line quasars at 1.5, which triples the size of (sub)mm observed quasars that have detailed FIR SEDs. Throughout the paper, we assume a concordance cosmology with H0=70 kms Mpc-1, =0.3, and =0.7.
2. MIPS 24 m-SELECTED QUASARS AND THEIR FIR COUNTERPARTS
The quasars used in this paper are from a 24 m flux-limited sample in the Spitzer Wide-area InfraRed Extragalactic Survey (SWIRE; Lonsdale et al., 2003). In the Lockman Hole–SWIRE (LHS) field, we selected targets that satisfy MIPS 0.4 mJy ( 8 ), and 94% of the flux-limited sample also satisfy SDSS 22.5. In 2009, Huang et al (in prep.) performed a spectroscopic survey of 3000 such 24 m targets with HECTOSPEC (Fabricant et al., 2005) on the Multiple Mirror Telescope (MMT), with an effective coverage of 8 deg2. 93% of these objects have reliable redshifts. SDSS objects with existing spectroscopic (Hatziminaoglou et al., 2008) that satisfy the same flux-limits were later added to the 24 m flux-limited sample, which increased the spectroscopic completeness to 70%. Broad line quasars were then selected, where MgII or CIV line width has a FWHM 1000 km s-1 (Schneider et al., 2007). The final sample of 326 24 m-selected sources includes 210 MMT and 116 SDSS quasars.
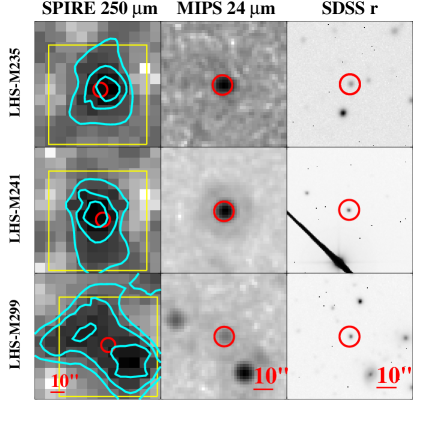
We matched these 326 quasars to the HerMES SPIRE cross-identification (XID) catalog (Roseboom et al., 2010). The XID catalog used SWIRE MIPS 24 m positions to minimize the source blending effects due to large beam sizes (18 FWHM for SPIRE 250 m images), and has a completeness of 80% at 20mJy. Among the 326 24 m-selected quasars, there are 41 SPIRE detections with S/N 5, of which three were detected at 350 or 500 m only. We dropped four sources whose SPIRE 250 m beam covers two 24 m counterparts (e.g. Fig. 1, bottom). We also excluded the five z 0.5 objects because their rest-frame FIR data points do not constrain the SED fitting. The final sample consists of 32 quasars (20 MMT and 12 SDSS objects) at 0.50 z 3.54, with a median z of 1.55 (Fig. 2, inset). This corresponds to a 10 detection rate. Since 29 of them were SPIRE 250 m detected, the 32 quasars used in this paper are hereafter referred to as FIR-detected quasars (Fig. 1, top and middle panels). Twenty-seven sources have at least one 350 or 500 m detection ( 3), and 16 sources also have SWIRE MIPS 70 or 160 m detections.
3. SPECTRAL ENERGY DISTRIBUTION
We constructed the rest-frame SEDs for the 32 FIR-detected quasars from the UV to the FIR bands. The LHS field was covered by the Galaxy Evolution Explorer (GALEX) in the ultra-violet (FUV, NUV), SDSS in the optical (u, g, r, i, and z), the UKIRT Infrared Deep Sky Survey (UKIDSS) in the near infrared (NIR; J,H,K), and the SWIRE survey in the mid-infrared (IRAC at 3.6, 4.5, 5.8, and 8.0 m; MIPS at 24, 70, and 160 m). A Chandra X-ray survey covered a small fraction of the LHS field (0.7 deg2), and only one source (LHS-S119) was detected out of the three FIR-detected quasars within that area (Wilkes et al., 2009). Fig. 1 shows the stamp images for two FIR-detected quasars and one poorly matched quasar in the optical and infrared bands.
The rest-frame FIR emissions of these quasars fall in the 30–300 m region, similar to those of ISO observed PG quasars (Haas et al., 2003) and (sub)mm-detected quasars (e.g. McMahon et al., 1999; Willott et al., 2003; Priddey et al., 2003a, b; Robson et al., 2004; Omont et al., 2001, 2003; Carilli et al., 2001; Beelen et al., 2006; Wang et al., 2007, 2008, 2010). Using the same method as was adopted in Beelen et al. (2006)333, where is the dust absorption coefficient. Here we used , and is from Alton et al. (2004)., we derived the dust mass for the FIR-detected quasars. is in the order of 108–109 M☉, similar to that of (sub)mm quasars. These values are 12 dex higher than values estimated for the PG quasars. Therefore, these FIR-detected quasars are associated with the (sub)mm detected quasars as a ‘dust-rich quasar’ population (Fig. 2).
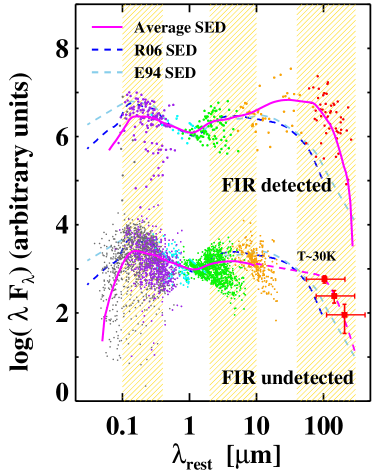
In 31 out of the 32 quasars, the rest-frame SEDs exhibit FIR excess over the E94/R06 quasar templates (Sec. 1) by 0.5 to 2.3 dex at 90 m, with an average of 1.4 dex. This suggests that the contribution from cool dust is present. We compared the mean SEDs for FIR-detected and the much larger sample of undetected quasars (Fig. 3). These mean SEDs were constructed by combining individual rest-frame SEDs. We first converted the flux densities to luminosities for each object. After shifting their bandpasses to the rest frame, we normalized each SED at 1–5 m to the R06 template. We then populated a grid of points separated by 0.03 in log wavelength and linearly interpolated between the effective detections from the UV to the FIR. The mean luminosities with this gap-repaired photometry were then connected as the average SED (magenta curves). For FIR-undetected objects, their mean SED was compensated in the FIR with the stacked mean fluxes at 250, 350 and 500 m from the SPIRE images. These values were estimated by first cutting out maps around the MIPS positions for individual sources (interpolation into sub-pixels was allowed for precisely centering), and then measured from the stacked map via a centered point-spread function (PSF) fitting. Errors associated with the mean fluxes were calculated using the bootstrap method. SEDs for both populations resemble the R06/E94 templates in the optical and the NIR, and differ mainly in the FIR: the stacked for FIR-undetected sources is 8 mJy, about 4 times lower than the median for FIR-detected quasars (31.1 mJy). UV-optical reddening is common in both populations, being present in 40% of the FIR-detected quasars. The reddening corrections are complicated (Hao et al., 2005) and beyond the scope of this paper, as we concentrate in the FIR.
3.1. Modeling the FIR quasar SED
For this work, we adopted a T-- model from Blain et al. (2003) to estimate the dust temperatures and quasar luminosities. Different from a pure modified blackbody (MBB) model, which uses an exponential thermal function with emissivity index to account for a single temperature dust component444, where is the blackbody spectrum.; in the T-- model, a power-law Wien tail () is introduced to the mid-IR SED to account for the warmer dust components (Fig. 4). This additional term is then matched to the MBB component at a transition point, where the two functions also have equal first order derivatives. This transition wavelength varies from case to case. We adopted here (Priddey et al., 2003a)555A change in from 2.0 to 1.5 does not significantly ( change the fitted and the (see also Sec. 3.2). Since real dust may have a temperature distribution, the fitted temperature only applies to the cold dust component defined by the rest-frame FIR data, while the fitted term indicates the relative strength of warm and hot dust.. At shorter wavelengths, we normalized the R06 template to each SED over the 1–5 m range for reference.
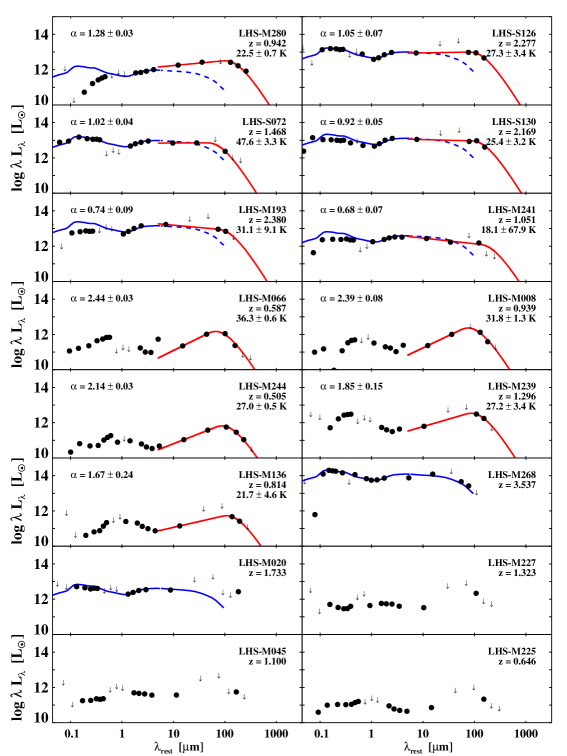
Out of the 32 quasars, four only have a single band rest-frame FIR detection. One (LHS-M020) of the four sources matches well to the R06 template in the optical and near infrared bands. The quasar with the highest z, LHS–M268, also has an SED that is well described by the R06 template alone (within 0.2 dex in the FIR). So no fit was attempted for these five objects.
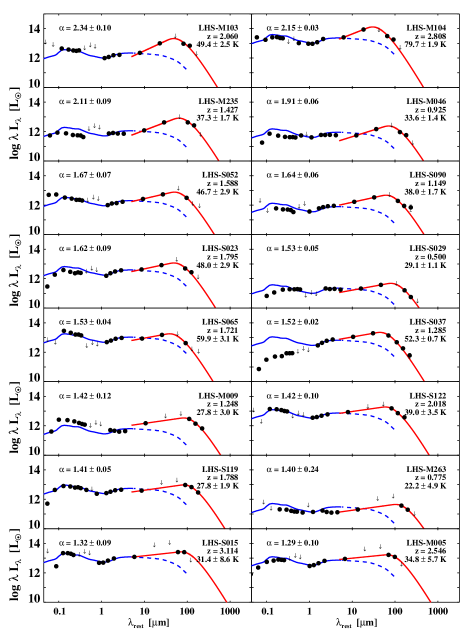
We carried out T-- fits to the remaining 27 SEDs, of which 9 objects have all three SPIRE detections. Longward of the Lyman break (912 Å), twenty-two quasars are well-defined by the R06 template and a T-- fit. All 12 SDSS quasars fall into this category. The remaining five less-well-defined SEDs show a strong stellar bump in the optical-NIR regime, presumably from the host galaxy, while their FIR SEDs are well described by a T-- fit. Fig. 4 presents the individual SED for each of the 32 FIR-detected quasars. The plots are labeled with their ID, redshift, fitted dust temperature and , and follow an decreasing order to match Table. 1. No host galaxy correction was applied.
3.2. Dust temperatures and luminosities
The fitted dust temperature () for these 27 quasars has a range of 18 K–80 K, with 87% of the sources in the range of 25–60 K, and a median and mean of 29 K and 34 K (Fig. 6, right). The fitting error for is less than 10% in 70% of the cases. However, it is worth noting that the derived from T-- fit is on average 30 lower than that from a pure modified blackbody fit, where no power-law term is present. The FIR luminosities are similar within 3 between these two fits.
The fitted for these 27 sources has a wide range of 0.68 to 2.44 (Table. 1). Starbursts are found to have higher values than normal star forming galaxies and quasars, as was shown in Blain et al. (2003). Different values suggest different dust temperature compositions in individual quasar systems, and may be associated with different evolutionary stages: flatter slopes () imply infrared SEDs with relatively stronger warmer dust emissions, likely heated directly by the quasar; while steeper slopes indicate a colder dust dominant infrared SED, similar to that of star forming galaxies (Fig. 6, left). Majority of the 27 quasars ( 70%) has an value of , possibly in a mixed condition between the two extremes.
The FIR luminosities (40–300 m) were estimated by integrating over the fitted SEDs, while the total infrared luminosities (8–1000 m) (Kennicutt, 1998) were integrated over the observed SEDs up to the redshifted MIPS 24 m data, and over the fitted SEDs at longer wavelength. ranges from to , while has a range of to L☉, qualifying most of their host galaxies as ultra- or hyper-luminous infrared galaxies (ULIRGs, ; HyLIRGs, , Sanders & Mirabel, 1996): in the 27 quasars with a T-- fit, there are 8 ULIRGs and 13 HyLIRGs. Twenty-one of the 27 quasars have , and 16 show , indicating major contribution from the FIR to the total . For FIR-undetected quasars, this ratio is 0.3 based on their mean SED (Fig. 3). We also estimated the ‘big blue bump’ luminosity, (0.1–0.4 m), and the near-infrared luminosity, (2–10 m), by integrating over the observed SEDs for all quasars. The 2–10 m range was chosen to minimize the stellar contribution, and to better represent the ‘hot dust bump’ emission likely to be directly heated by the quasar (Wang et al., 2008). These integration ranges can be found in Fig. 3 as shaded regions. The parameters used and derived from the SEDs are summarized in Table. 1 (See also Fig. 6). Errors for , , and are fitting errors only. The errors for and contain only the photometric errors, and are not listed in Table. 1 because of their small values: mostly at the one percent level or less for , and at most a few percent for .
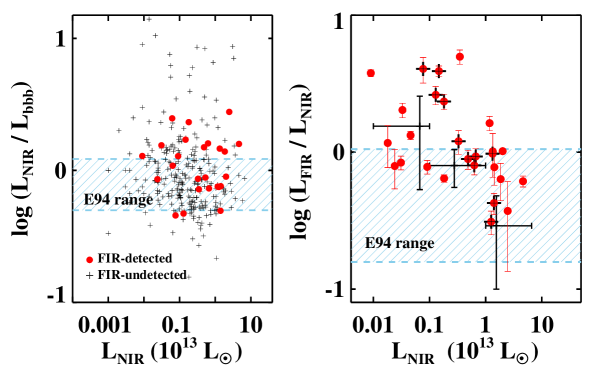
The FIR-detected and undetected quasars have similar and values and distributions, with 25% higher for FIR-detected quasars at higher redshifts (Fig. 7, left). The ratio, however, shows an obvious excess over the E94 template range especially at (Fig. 7, right). We also plot the mean ratios for FIR-undetected quasars in three bins. These values were derived from the mean SEDs at each bin in the range (covering the mean of 1.5), assuming and (mean for FIR-detected quasars). These SEDs were completed in the FIR using the stacked fluxes from the SPIRE images for the relevant FIR-undetected sources. For comparison, FIR-detected quasars in the same redshift range are marked with a cross in the center.
It is clear that at the same redshift (1 2 in this case) and luminosity bins, FIR-detected quasars have higher ratios than FIR-undetected objects, indicating differences in , , or AGN activities. This ratio seems to decrease at higher regardless of redshift, though the large scatter at prevents determination of a tight correlation. The quasars’ FIR properties cannot be predicted from shorter wavelengths, given the similar SED shapes and luminosities between FIR-detected and undetected quasars at optical and near-infrared regions (Fig. 7, left). Considering this similarity and the common UV extinctions, no bolometric luminosity was calculated for the FIR-detected quasars.
4. DISCUSSION
We constructed a sample of 32 quasars (0.5 3.6) with Herschel SPIRE detections, which triples the size of (sub)mm observed quasars that have detailed FIR SEDs. These FIR-detected quasars, as well as some FIR-undetected quasars in our sample (Fig. 3), show broad line features and strong cold dust emissions simultaneously. This is inconsistent with the evolutionary scenario that naked quasars are only seen when the dust has been blown out (e.g. Haas et al., 2003). The dust detected by Herschel show temperatures from 18 K to 80 K (§3.2), with 87% of the sources in a range of 25–60 K, similar to local and starburst galaxies and ULIRGs (20 K 60 K) (Calzetti et al., 2000; Magdis et al., 2010). The median and mean in our sample are 29 K and 34 K, respectively. Since the FIR emissions for these FIR-detected and the (sub)mm detected quasars (e.g. Omont et al., 2001, 2003; Carilli et al., 2001; Beelen et al., 2006) both fall in the rest-frame 30–300 m region, we associated these two populations as a ‘dust-rich quasar’ population (Fig. 2). Estimated dust mass confirmed this connection (See also Sec. 3). ISO-detected quasars (Haas et al., 2003) are possibly at the low-z end of this population, though their could to be 12 dex lower. A common assumption is that the dust-rich quasars are in transition between optically obscured and unobscured quasar phases, but near-infrared/(sub)mm spectroscopy and high resolution images are needed to test this.
The FIR-detected and undetected quasars have similar mean SEDs (Fig. 3), redshift (Fig. 2, inset) and luminosity distributions (Fig. 7, left) at shorter wavelengths (rest-frame 0.3–20 m). is higher for the FIR-detected population, likely affected by their FIR excess. The lack of correlation between properties at the FIR and shorter wavelengths tests the widely used conversion factor of 7 between (5100 Å) and for AGN and quasars (Shemmer et al., 2004). For these FIR-detected broad line quasars ( 10% of the flux-limited sample), if the rest-frame FIR emission is mainly due to quasar heating, this factor should be modified to 920 based on the ratio. Whether this applies to the flux-limited quasar population in general remains to be investigated.
At , the ratios for FIR-detected quasars are on average higher than FIR-undetected ones. and seem to be anti-correlated (Fig. 7, right). This trend is also observed for the overall population despite the large scatter at : the relative strength of — commonly associated with star formation (e.g. Lutz et al., 2007), decreases at higher , indicator of warm dust partially or mostly heated by AGN. This trend is consistent with the assumption that star formation is suppressed by the presence of a powerful AGN (Hopkins et al., 2006).
Both star forming galaxies and AGNs may contribute to the rest-frame FIR emission at various redshifts. If we attribute the FIR luminosity to star formation666Eq(4) in Kennicutt (1998): SFR () = 1.7 . Here we used instead of for a more conservative estimate that reduces further contamination from the AGN., as was adopted in some previous studies (e.g. Evans et al., 2006; Riechers et al., 2006; Netzer et al., 2007; Wang et al., 2010, 2011), about 40 of the sample will require a star formation rate (SFR) , similar to that of submillimeter galaxies (e.g. Lutz et al., 2008). However, for the high luminosity end (, Fig. 7), with only one source, the statistics are insufficient to prove whether there is a similar proportion of starburst dominated quasars, as was found for (sub)mm observed quasars (i.e.20-30%, Wang et al., 2008).
On the other hand, for some quasars, the SFR derived from reaches 5000 , which is unlikely and probably implies that part of the FIR emission is powered by AGN. In Fig. 7 (right), we found that for the more luminous quasars (), the ratio falls in the normal quasar range, suggesting pure quasar heating. Resolved CO and PAH emission from NIR/mm spectroscopy and high resolution imaging showing dust distribution will provide a better estimate of the relative contributions from AGN and starbursts for these dust-rich quasars.
References
- Alton et al. (2004) Alton, P. B., Xilouris, E. M., Misiriotis, A., Dasyra, K. M., & Dumke, M. 2004, A&A, 425, 109
- Beelen et al. (2006) Beelen, A., Cox, P., Benford, D. J., et al. 2006, ApJ, 642, 694
- Blain et al. (2003) Blain, A. W., Barnard, V. E., & Chapman, S. C. 2003, MNRAS, 338, 733
- Carilli et al. (2001) Carilli, C. L., Bertoldi, F., Rupen, M. P., et al. 2001, ApJ, 555, 625
- Calzetti et al. (2000) Calzetti, D., et al. 2000, ApJ, 533, 682
- Evans et al. (2006) Evans, A. S., et al. 2006, AJ, 132, 2398
- Elvis et al. (1994, hereafter E94) Elvis, M., et al. 1994, ApJS, 95, 1
- Fabricant et al. (2005) Fabricant, D., et al. 2005, PASP, 117, 14111998, ApJ, 498, 579
- Granato & Danese (1994) Granato, G. L., & Danese, L. 1994, MNRAS, 268, 235
- SPIRE: 250, 350, 500 m, Griffin et al. (2010) Griffin, M. J., et al. 2010, A&A, 518, L3
- Haas et al. (2003) Haas, M., et al. 2003, A&A, 402, 87
- Hatziminaoglou et al. (2008) Hatziminaoglou, E., et al. 2008, MNRAS, 386, 1252
- Hatziminaoglou et al. (2010) Hatziminaoglou, E., et al. 2010, A&A, 518, L33
- Hao et al. (2005) Hao, L., et al. 2005, AJ, 129, 1795
- Hao et al. (2011) Hao, H., Elvis, M., Civano, F., & Lawrence, A. 2011, ApJ, 733, 108
- Hopkins et al. (2006) Hopkins, et al. 2006, ApJS, 163, 1
- Kartaltepe et al. (2010) Kartaltepe, J. S., et al. 2010, ApJ, 709, 572
- Kennicutt (1998) Kennicutt, R. C., Jr. 1998, ARA&A, 36, 189
- Leipski et al. (2010) Leipski, C., et al. 2010, A&A, 518, L34
- SWIRE; Lonsdale et al. (2003) Lonsdale, C. J., et al. 2003, PASP, 115, 897
- Lutz et al. (2007) Lutz, D., Sturm, E., Tacconi, L. J., et al. 2007, ApJ, 661, L25
- Lutz et al. (2008) Lutz, D., et al. 2008, ApJ, 684, 853
- Magdis et al. (2010) Magdis, G. E., Elbaz, D., Hwang, H. S., et al. 2010, MNRAS, 409, 22
- McMahon et al. (1999) McMahon, R. G., Priddey, R. S., Omont, A., Snellen, I., & Withington, S. 1999, MNRAS, 309, L1
- Netzer et al. (2007) Netzer, H., et al. 2007, ApJ, 666, 806
- HerMES, Oliver et al. (2010) Oliver, S. J., et al. 2010, A&A, 518, L21
- Oliver et al. (2011) Oliver et al. 2011, MNRAS, submitted
- Omont et al. (2001) Omont, A., Cox, P., Bertoldi, F., et al. 2001, A&A, 374, 371
- Omont et al. (2003) Omont, A., Beelen, A., Bertoldi, F., et al. 2003, A&A, 398, 857
- Papovich et al. (2006) Papovich, C., et al., 2006, AJ, 132, 231
- Pilbratt et al. (2010) Pilbratt, G. L., et al. 2010, A&A, 518, L1
- Priddey et al. (2003a) Priddey, R. S., Isaak, K. G., McMahon, R. G., & Omont, A. 2003, MNRAS, 339, 1183
- Priddey et al. (2003b) Priddey, R. S., Isaak, K. G., McMahon, R. G., Robson, E. I., & Pearson, C. P. 2003, MNRAS, 344, L74
- Richards et al. (2006, hereafter R06) Richards, G. T., et al. 2006, ApJS, 166, 470
- Riechers et al. (2006) Riechers, D. A., Walter, F., Carilli, C. L., et al. 2006, ApJ, 650, 604
- Robson et al. (2004) Robson, I., Priddey, R. S., Isaak, K. G., & McMahon, R. G. 2004, MNRAS, 351, L29
- Roseboom et al. (2010) Roseboom, I. G., et al. 2010, MNRAS, 409, 48
- Rowan-Robinson (1995) Rowan-Robinson, M. 1995, MNRAS, 272, 737
- Sanders et al. (1988) Sanders, et al. 1988, ApJ, 325, 74
- Sanders et al. (1989) Sanders, D. B., Phinney, E. S., Neugebauer, G., Soifer, B. T., & Matthews, K. 1989, ApJ, 347, 29
- Sanders & Mirabel (1996) Sanders, D. B., & Mirabel, I. F. 1996, ARA&A, 34, 749
- Schneider et al. (2007) Schneider, D. P., Hall, P. B., Richards, G. T., et al. 2007, AJ, 134, 102
- Serjeant et al. (2010) Serjeant, S., et al. 2010, A&A, 518, L7
- Shemmer et al. (2004) Shemmer, O., et al. 2004, ApJ, 614, 547
- Shi et al. (2009) Shi, Y., Rieke, G. H., Ogle, P., Jiang, L., & Diamond-Stanic, A. M. 2009, ApJ, 703, 1107
- Trichas et al. (2009) Trichas, M., Georgakakis, A., Rowan-Robinson, M., et al. 2009, MNRAS, 399, 663 Ohta, K., & Miyaji, T. 2003, ApJ, 598, 886
- Veilleux et al. (2009) Veilleux, S., et al. 2009, ApJS, 182, 628
- Wang et al. (2007) Wang, R., Carilli, C. L., Beelen, A., et al. 2007, AJ, 134, 617
- Wang et al. (2008) Wang, R., Carilli, C. L., Wagg, J., et al. 2008, ApJ, 687, 848
- Wang et al. (2010) Wang, R., Carilli, C. L., Neri, R., et al. 2010, ApJ, 714, 699
- Wang et al. (2011) Wang, R., Wagg, J., Carilli, C. L., et al. 2011, AJ, 142, 101
- Wilkes et al. (2009) Wilkes, B. J., et al. 2009, ApJS, 185, 433
- Willott et al. (2003) Willott, C. J., Rawlings, S., & Grimes, J. A. 2003, ApJ, 598, 909


| Object ID | z | SFR | log | ||||||
|---|---|---|---|---|---|---|---|---|---|
| (K) | (10) | (10) | (10) | (10) | (yr) | (M☉) | |||
| (1) | (2) | (3) | (4) | (5) | (6) | (7) | (8) | (9) | (10) |
| LHS-M103 | 2.060 | 49.42.5 | 2.340.10 | 4.82 | 3.47 | 17.262.01 | 31.003.61 | 3000 | 8.9 |
| LHS-M104 | 2.808 | 79.71.9 | 2.150.03 | 29.18 | 46.30 | 28.382.59 | 115.8410.56 | 5000 | 8.9 |
| LHS-M235 | 1.427 | 37.31.7 | 2.110.09 | 0.86 | 1.47 | 5.740.49 | 8.680.74 | 1000 | 9.1 |
| LHS-M046 | 0.925 | 33.61.4 | 1.910.06 | 0.71 | 0.91 | 0.710.08 | 1.050.12 | 100 | 9.4 |
| LHS-S052 | 1.588 | 46.72.9 | 1.670.07 | 3.81 | 3.29 | 3.950.77 | 8.001.57 | 700 | 8.6 |
| LHS-S090 | 1.149 | 38.01.7 | 1.640.06 | 0.78 | 1.81 | 4.240.54 | 7.290.93 | 700 | 8.7 |
| LHS-S023 | 1.795 | 48.02.9 | 1.620.09 | 3.92 | 6.28 | 5.030.74 | 10.821.60 | 900 | 9.5 |
| LHS-S029 | 0.500 | 29.11.1 | 1.530.05 | 0.20 | 0.31 | 0.260.03 | 0.390.04 | 40 | 8.7 |
| LHS-S065 | 1.721 | 59.93.1 | 1.530.04 | 28.45 | 14.07 | 5.981.05 | 16.932.97 | 1000 | 8.5 |
| LHS-S037 | 1.285 | 52.30.7 | 1.520.02 | 0.81 | 13.26 | 12.920.50 | 29.861.15 | 2200 | 8.2 |
| LHS-M009 | 1.248 | 27.83.0 | 1.420.12 | 2.74 | 1.29 | 3.380.50 | 5.690.84 | 600 | 9.1 |
| LHS-S122 | 2.018 | 39.03.5 | 1.420.10 | 15.60 | 11.76 | 19.142.30 | 39.324.73 | 3300 | 9.3 |
| LHS-S119 | 1.788 | 27.81.9 | 1.410.05 | 9.13 | 6.67 | 6.200.85 | 10.941.49 | 1100 | 9.4 |
| LHS-M263 | 0.775 | 22.24.9 | 1.400.24 | 0.28 | 0.24 | 0.190.06 | 0.300.09 | 30 | 8.6 |
| LHS-S015 | 3.114 | 31.48.6 | 1.320.09 | 22.42 | 20.10 | 30.1621.82 | 58.8142.55 | 3500 | 8.7 |
| LHS-M005 | 2.546 | 34.85.7 | 1.290.10 | 9.15 | 13.38 | 13.544.75 | 27.999.82 | 2300 | 8.8 |
| LHS-M280 | 0.942 | 22.50.7 | 1.280.03 | 0.09 | 1.82 | 1.170.07 | 1.970.12 | 200 | 8.5 |
| LHS-S126 | 2.277 | 27.33.4 | 1.050.07 | 18.82 | 14.29 | 11.092.89 | 24.446.37 | 1900 | 9.3 |
| LHS-S072 | 1.468 | 47.63.3 | 1.020.04 | 16.73 | 12.53 | 3.890.76 | 10.662.08 | 700 | 8.5 |
| LHS-S130 | 2.169 | 25.43.2 | 0.920.05 | 13.33 | 18.53 | 11.773.58 | 28.018.51 | 2000 | 9.4 |
| LHS-M193 | 2.380 | 31.19.1 | 0.740.09 | 8.91 | 24.72 | 9.205.87 | 26.9317.20 | 1600 | 9.3 |
| LHS-M241 | 1.051 | 18.167.9 | 0.680.07 | 3.24 | 4.85 | 2.2122.06 | 5.2151.91 | 400 | … |
| LHS-M066 | 0.587 | 36.30.6 | 2.440.03 | 0.36 | 0.46∗ | 0.610.04 | 0.810.05 | 100 | 8.1 |
| LHS-M008 | 0.939 | 31.81.3 | 2.390.08 | 0.19 | 0.33∗ | 0.670.07 | 0.890.09 | 100 | 8.8 |
| LHS-M244 | 0.505 | 27.00.5 | 2.140.03 | 0.07 | 0.09∗ | 0.340.02 | 0.440.03 | 60 | 9.1 |
| LHS-M239 | 1.296 | 27.23.4 | 1.850.15 | 1.69 | 0.77∗ | 3.120.64 | 4.520.92 | 500 | 8.9 |
| LHS-M136 | 0.814 | 21.74.6 | 1.670.24 | 0.05 | 0.18∗ | 0.210.07 | 0.310.10 | 40 | 8.8 |
| LHS-M268† | 3.537 | … | … | 208.91 | 129.92 | … | … | … | … |
| LHS-M020 | 1.733 | … | … | 5.99 | 5.29 | … | … | … | … |
| LHS-M227 | 1.323 | … | … | 0.59 | 0.64∗ | … | … | … | … |
| LHS-M045 | 1.100 | … | … | 0.25 | 0.62∗ | … | … | … | … |
| LHS-M225 | 0.646 | … | … | 0.13 | 0.09∗ | … | … | … | … |
Note. — (1): Object ID. (2): Spectroscopic redshifts determined from Hectospec and SDSS spectra. (3) (4): Dust temperature and power-law index derived from the T-- fit (see also Sec. 3.1). (5) (6) (7) (8): Luminosities estimated from the SED (see also Sec. 3.2). (9): Star formation rate estimated using following the Kennicutt law (1998), see Sec. 4, footnote. (10): Dust mass calculated using S250, see Sec. 3, footnote.
: not corrected for host galaxy contamination. : SED well defined by R06 template, no T-- fit needed.