Deep silicate absorption features in Compton-thick AGN
predominantly arise due to dust in the host galaxy
Abstract
We explore the origin of mid-infrared (mid-IR) dust extinction in all 20 nearby () bona-fide Compton-thick () AGN with hard energy ( keV) X-ray spectral measurements. We accurately measure the silicate absorption features at in archival low-resolution (–127) Spitzer Infrared Spectrograph (IRS) spectroscopy, and show that only a minority (%) of nearby Compton-thick AGN have strong Si-absorption features () which would indicate significant dust attenuation. The majority (%) are star-formation dominated (AGN:SB0.5) at mid-IR wavelengths and lack the spectral signatures of AGN activity at optical wavelengths, most likely because the AGN emission-lines are optically-extinguished. Those Compton-thick AGN hosted in low-inclination angle galaxies exhibit a narrow-range in Si-absorption (–0.3), which is consistent with that predicted by clumpy-torus models. However, on the basis of the IR spectra and additional lines of evidence, we conclude that the dominant contribution to the observed mid-IR dust extinction is dust located in the host galaxy (i.e., due to disturbed morphologies; dust-lanes; galaxy inclination angles) and not necessarily a compact obscuring torus surrounding the central engine.
Subject headings:
galaxies: active – Infrared: galaxies – X-rays: galaxies1. Introduction
The unified model of active galactic nuclei (AGN; e.g., Antonucci 1993) is crucial to our understanding of the growth and evolution of massive black holes and their host galaxies. A key issue in AGN physics is the nature of the obscuring medium surrounding the central engine.
There are three competing models for the specific structure, geometry and composition of the obscuring material surrounding the central supermassive black hole (SMBH): (1) a uniform (smooth/continuous), heavily-obscuring, sub-parsec scale torus (Pier & Krolik, 1992, 1993); (2) an extended torus yielding moderate obscuration (Granato & Danese, 1994; Efstathiou & Rowan-Robinson, 1995; Granato et al., 1997); and (3) clumpy ‘torus’ of many individual optically thick clouds (Nenkova et al., 2002, 2008). Each of these theoretical models make clear predictions for the observed torus properties. The graphite/silicate dust contained within the torus is predicted to extinguish AGN emission at UV/optical wavelengths, and should be co-spatial with cool neutral gas which readily absorbs the X-ray emission from the AGN (e.g., Mushotzky et al. 1993). However, this dust/gas-rich torus is also predicted to (isotropically) re-emit in the mid-infrared (mid-IR; –) with a mid-IR spectral energy distribution characterized by a powerlaw-like AGN continuum, superposed with silicate absorption/emission features at 9.7 and 18. The strength of these dust features are expected to be dependent on the specific geometry and optical depth of the torus (e.g., Fritz et al. 2006; Schartmann et al. 2008). To distinguish between these torus models, we require well-constrained results from sensitive and high-quality observations.
In nearby optical and radio-selected AGN, a weak correlation between gas column density () and silicate (Si) absorption strength has been observed from Spitzer mid-IR spectroscopy (e.g., Shi et al. 2006; Wu et al. 2009). In turn, this suggests that selection of sources with strong Si-absorption is a good method to find the most heavily obscured AGN, i.e., Compton-thick sources with (e.g., Georgantopoulos et al. 2011). To first-order, these results would appear to agree with those predicted by simple uniform torus models. However, there is growing evidence that not all of the dust-extinction can be attributed to an obscuring central torus.
Using ground-based high-spatial resolution photometry, Gandhi et al. (2009) show that Compton-thick AGN do not require significant corrections for dust extinction to their AGN-produced mid-IR continuum, suggesting that Si-absorption features in Compton-thick AGN are not being produced in their nuclear regions (see also Hönig et al. 2010; Asmus et al. 2011). Furthermore, those AGN with strong Si-absorption features are often found to be hosted in highly inclined and/or merging galaxies (e.g., Deo et al. 2007, 2009), providing first-order evidence that significant dust attenuation can occur within the AGN host-galaxy (e.g., Alonso-Herrero et al. 2011 and references there-in). Moreover, dust in the host-galaxy appears to extinguish the optical emission-line signatures in –50% of nearby AGN (e.g., Goulding & Alexander 2009), and in a minority of cases, even the mid-IR AGN emission-lines (e.g., NGC 4945; Goulding et al. 2010). This apparent ambiguity among recent observations and theory raises two fundamental questions: (1) is Si-absorption a common feature amongst Compton-thick AGN, as predicted by a unified AGN model? and (2) does Si-absorption predominantly arise from dust in a central torus or from within the AGN host-galaxy?
To address these questions we explore the origins of apparent high optical-depth dust in the sample of all 20 nearby () Compton-thick AGN which are unambiguously identified with high-energy X-ray spectral observations. We use Spitzer-IRS observations to determine the average mid-IR spectral energy distribution of Compton-thick AGN, and establish whether silicate absorption is a signature common to the most heavily-obscured AGN. In §2 we describe the sample of Compton-thick AGN, outline the data reduction methods of the Spitzer-IRS observations and present the mid-IR spectra for the Compton-thick AGN sample. In §3 we compare the absorbing gas column and the apparent dust-extinction levels towards the central AGN and present the physical implications of these in light of a clumpy torus model. Finally, in §4 we review our results, finding that the mid-IR Si-absorption features observed in Compton-thick AGN are produced primarily due to dust in the AGN host-galaxy and not within a central torus.
2. Compton-thick AGN Sample & Data Analyses
Compton-thick AGN () are the most heavily obscured class of AGN; by their very nature, they are extremely difficult to detect and remain hidden in most X-ray surveys (e.g., Norman et al. 2002; Alexander et al. 2008, 2011; Comastri et al. 2011; Feruglio et al. 2011; Gilli et al. 2011; Luo et al. 2011). Conclusive identifications of Compton-thick AGN are made through spectroscopic X-ray observations performed at keV where the relatively unabsorbed high-energy emission can be directly detected. The current sensitivities of keV observatories (e.g., Beppo-SAX, Swift, Suzaku, INTEGRAL) are substantially limited by high backgrounds, relatively small effective areas and low spatial resolution. To date, only 20 bona-fide Compton-thick AGN have been unambiguously identified in the Universe at keV (for a review see Della Ceca et al. 2008 and references there-in; Awaki et al. 2009; Braito et al. 2009). These 20 Compton-thick AGN are all nearby () systems hosted in spiral (Hubble-type S0 or later) or merging galaxies with intrinsic X-ray luminosities – (–10 keV), and hence span the wide range of AGN power observed in local Seyfert systems.
| Common | Gal. | D-L/ | Opt. | X-ray | IRS | AOR | Obs. | Mid-IR | |||||||||
|---|---|---|---|---|---|---|---|---|---|---|---|---|---|---|---|---|---|
| Name | (Mpc) | Morph. | Pec. | Class | (erg s-1 | ( | Ref. | Type | # | Date | DecompIR | PAHFIT | AGN:SB | ||||
| cm-2) | ) | ratio | |||||||||||||||
| (1) | (2) | (2) | (3) | (4) | (5) | (6) | (7) | (8) | (9) | (10) | (11) | (12) | (13) | (14) | (15) | (16) | (17) |
| NGC424 | 01h11m27.6s | -38d05m00s | 0.0125 | 50.8 | SBa | 0.45 | - | Sy1/2 | 1,2 | M | 12444160 | 12-08-04 | 0.00 | ||||
| NGC1068 | 02h42m40.7s | -00d00m47s | 0.0116 | 13.7 | SAb | 0.85 | - | Sy2 | 3,4,5,6,7 | M | 12461568 | 01-12-05 | 0.08 | 0.12 | |||
| E005-G004 | 06h05m41.6s | -86d37m55s | 0.0062 | 26.7 | Sb | 0.21 | - | HII | 8 | S | 18947328 | 10-25-06 | 0.61 | 0.47 | 0.60 | ||
| Mrk3 | 06h15m36.4s | +71d02m15s | 0.0134 | 60.6 | S0 | 0.89 | - | Sy2 | 9,10,11 | S | 3753472 | 03-04-04 | 0.33 | 0.15 | |||
| NGC2273 | 06h50m08.7s | +60d50m44s | 0.0038 | 26.5 | SBa | 0.78 | - | Sy2 | 12 | S | 4851712 | 10-03-04 | 0.24 | 0.20 | 0.49 | ||
| NGC3079 | 10h01m57.8s | +55d40m47s | 0.0061 | 16.2 | SBc | 0.18 | - | L/Sy2 | 13 | S | 3755520 | 04-19-04 | 0.65 | 0.58 | 0.32 | ||
| NGC3281 | 10h31m52.1s | -34d51m13s | 0.0038 | 49.6 | SAab | 0.52 | Y | Sy2 | 4,10,14 | S | 4852224 | 05-23-05 | 1.41 | 1.28 | 0.87 | ||
| NGC3393 | 10h48m23.5s | -25d09m43s | 0.0115 | 56.2 | SB0 | 0.91 | - | Sy2 | 7,15 | S | 4852480 | 05-22-05 | 0.13 | 0.14 | 0.77 | ||
| Arp299 | 11h28m30.4s | +58d34m10s | 0.0110 | 44.8 | Irr | - | Y | HII | 16,17 | M | 3840256 | 04-15-04 | 0.90 | 0.92 | 0.63 | ||
| Mrk231 | 12h56m14.2s | +56d52m25s | 0.0420 | 186.0 | SAc | 0.77 | - | QSO | 18 | S | 4978688 | 04-14-04 | 0.18 | 0.13 | 0.77 | ||
| NGC4939 | 13h04m14.4s | -10d20m22s | 0.0104 | 44.8 | SAbc | 0.51 | - | Sy2 | 15 | S | 4853760 | 01-06-04 | 0.00 | 0.00 | |||
| NGC4945 | 13h05m27.5s | -49d28m05s | 0.0019 | 3.9 | Scd | 0.19 | Y | HII | 4,5,6,19 | S | 8768928 | 03-01-04 | 1.40 | 0.74 | |||
| NGC5194 | 13h29m52.7s | +47d11m42s | 0.0015 | 8.6 | SAbc | 0.99 | - | L/Sy2 | 20 | M | 9480192 | 05-12-04 | 0.00 | 0.04 | 0.43 | ||
| Circinus | 14h13m09.9s | -65d20m20s | 0.0014 | 3.7 | SAb | 0.43 | Y | Sy2 | 11,21,22 | S | 9074176 | 03-01-04 | 1.28 | 1.25 | 0.88 | ||
| NGC5728 | 14h42m23.9s | -17d15m11s | 0.0094 | 40.9 | SABa | 0.58 | - | Sy2 | 10,23 | S | 18945536 | 08-05-07 | 0.14 | 0.12 | 0.52 | ||
| E138-G001 | 16h51m20.1s | -59d14m05s | 0.0091 | 38.6 | S0 | 0.99 | - | Sy2 | 2,6 | S | 17643264 | 04-30-07 | 0.00 | 0.00 | |||
| NGC6240 | 16h52m58.9s | +02d24m03s | 0.0243 | 105.0 | Irr | - | Y | L | 11,24 | S | 4985600 | 03-04-04 | 0.82 | 0.62 | 0.44 | ||
| IRAS19254-7245 | 19h31m21.4s | -72d39m18s | 0.0620 | 266.0 | Irr | - | Y | QSO | 27 | S | 12256512 | 05-30-05 | 1.07 | 0.58 | 0.64 | ||
| NGC7582 | 23h18m23.5s | -42d22m14s | 0.0053 | 22.7 | SBab | 0.42 | Y | Sy2 | 10,25 | M | 12445184 | 05-25-05 | 0.76 | 0.79 | 0.37 | ||
| NGC7674 | 23h27m56.7s | +08d46m44s | 0.0289 | 127.0 | SAbc | 0.91 | - | Sy2 | 26 | M | 12468736 | 12-11-04 | 0.10 | 0.00 |
Notes:- 1Common galaxy name;
2J2000 positional co-ordinates from the NASA Extragalactic Database (NED);
3Spectroscopic redshift;
4Luminosity distance in Megaparsecs assuming and and corrected for non-cosmological flows;
5-6Galaxy morphology and major/minor axis ratio taken from the Third Reference Catalog of Bright Galaxies (de Vaucouleurs et al., 1991);
7Y – denotes dust-lanes or peculiar morphology are evident in the optical image of the source;
8Optical classification in NED;
9Logarithm of intrinsic (2–10 keV) X-ray luminosity in units of corrected for Compton-thick absorption for those sources with ;
10Neutral hydrogen column density derived from hard X-ray spectroscopy in units of ;
11Reference for X-ray data (see below);
12Type of Spitzer-IRS observation (M: Mapping; S: Staring);
13Spitzer observation record indicator;
14Date of Spitzer-IRS observation;
15Depth of Si-absorption at
derived from spectral fits to Spitzer-IRS data using the formalism of
Mullaney et al. (2011);
16Depth of Si-absorption at
derived from spectral fits to Spitzer-IRS data using PAHFIT;
17AGN–starburst ratio derived from fitting IRS spectrum with DecompIR (AGN-dominated system ).
References:-
(1) Iwasawa et al. (2001);
(2) Collinge & Brandt (2000);
(3) Matt et al. (1997);
(4) Sazonov et al. (2007);
(5) Beckmann et al. (2006);
(6) Bassani et al. (2007);
(7) Levenson et al. (2006);
(8) Ueda et al. (2007);
(9) Cappi et al. (1999);
(10)Markwardt et al. (2005); (11) Bassani et al. (1999);
(12) Awaki et al. (2009);
(13) Iyomoto et al. (2001);
(14) Vignali & Comastri (2002);
(15) Maiolino et al. (1998);
(16) Della Ceca et al. (2002);
(17) Ballo et al. (2004);
(18) Braito et al. (2004);
(19) Guainazzi et al. (2000);
(20) Fukazawa et al. (2001);
(21) Matt et al. (1999);
(22) Iwasawa et al. (1997);
(23) Comastri et al. (2007);
(24) Vignati et al. (1999);
(25) Turner et al. (2000);
(26) Malaguti et al. (1998);
(27) Braito et al. (2009)
2.1. Spitzer-IRS Data Reduction
All 20 bona-fide Compton-thick AGN identified to date have archival low-resolution Spitzer-IRS spectroscopy. Specifically, these 20 AGN have been observed with the low-resolution modules (short-low [SL; 5.2–] and long-low [LL; 14.0–]; –127) in either staring or mapping mode as part of multiple programs, and hence these data form a heterogeneous, but still complete sample. Our sample of nearby Compton-thick AGN and their basic properties are given in Table 1. The mid-IR data for many of our AGN sample have been analyzed using different reduction techniques in previous papers (e.g., Deo et al. 2007; Hao et al. 2007; Wu et al. 2009; Mullaney et al. 2010, 2011; Sazonov et al. 2012, submitted). However, in order to ensure self-consistency for the measurement of the spectral absorption/emission features which are integral to the analyses presented here, we have re-extracted each of the IRS observations using our own custom idl reduction routine (see Goulding 2010; Goulding et al. 2011; Mullaney et al. 2011).
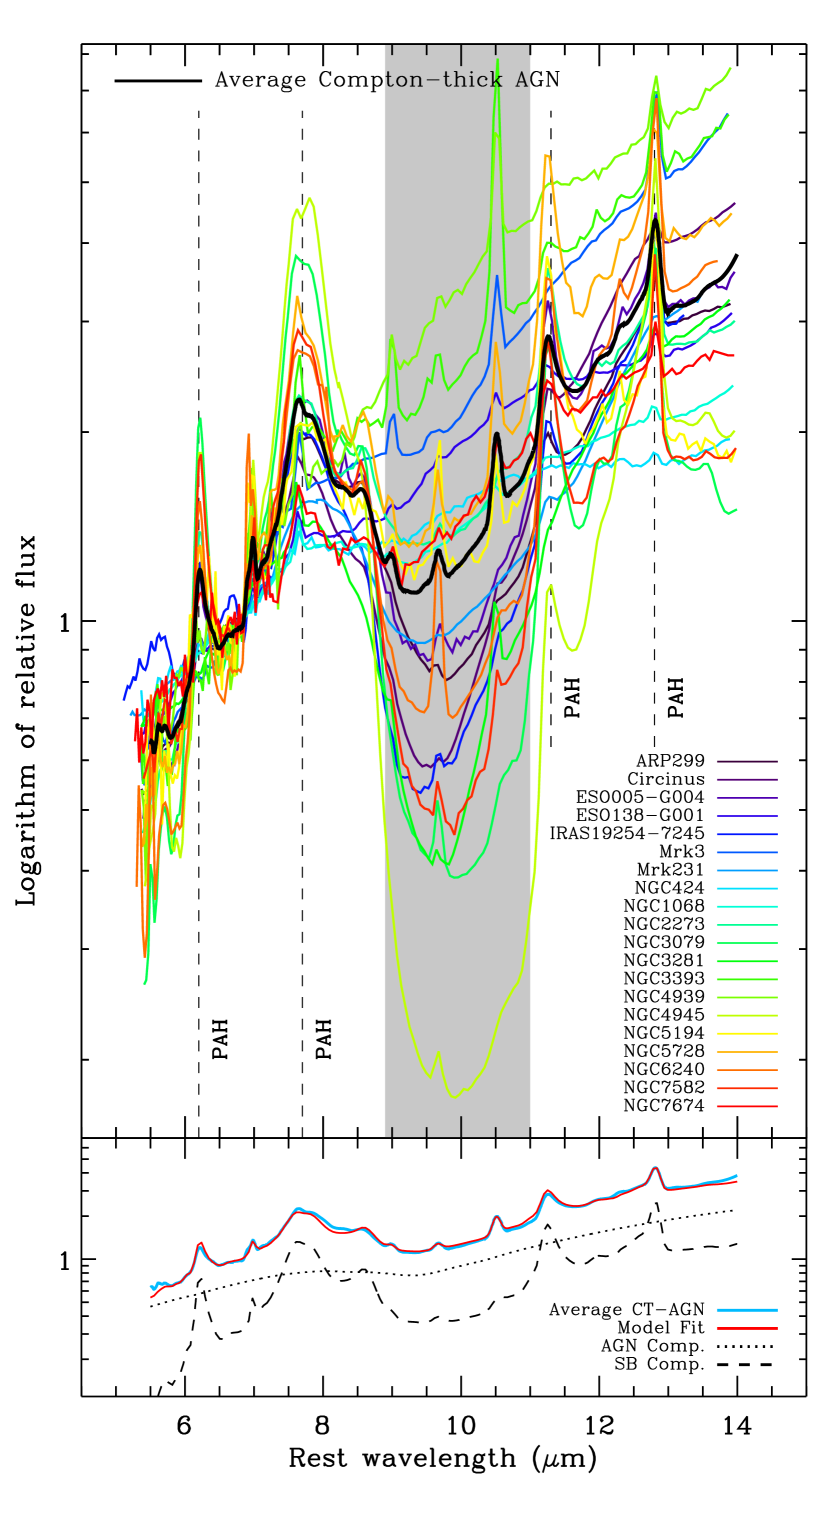
Briefly, the two-dimensional Basic Calibrated Data (BCDs) images, produced by the S18.18.0 Spitzer Science Center (SSC) pipeline, were retrieved and rigorously cleaned of rogue ‘hot’ pixels using our customized version of irsclean. Next, individual rows were fit as a function of time to remove latent charge which exists on the detector after bright and/or long observations. The IRS Staring observations were averaged in the different nod positions, which were then used to perform alternate background subtractions of the source in each nod position and final spectra were extracted using the Spitzer-IRS Custom Extraction (spice) software provided by the SSC. Cleaned and processed IRS Mapping observations were input to the SSC package cubism to build the spectral data cubes and extract the 1-D spectroscopy. Individual IRS orders in the 1-D spectra were clipped of noise (see the Spitzer-IRS handbook for further information) and stitched together by fitting low-order polynomials to produce the final continuous spectra for each source. In the upper-panel of Fig. 1, we show the resulting low-resolution Spitzer-IRS spectroscopy for our complete sample of nearby Compton-thick AGN.
2.2. Spitzer-IRS Spectral Decomposition & Silicate Absorption Measurement
On the basis of uniform dust torus models produced from radiative transfer theory (e.g., Dullemond & van Bemmel 2005; Schartmann et al. 2005; Fritz et al. 2006), the mid-IR spectral energy distributions of intrinsically heavily-absorbed Type-2 AGN are expected to be dominated by an AGN-produced powerlaw and most, if not all, are expected to exhibit significant Si-absorption features at . Throughout this manuscript, we define as the depth of the Si-absorption feature at where . Following many previous studies, we use as a good proxy for the apparent optical depth and dust-extinction in our sample (e.g., Spoon et al. 2007; Shi et al. 2006; Levenson et al. 2007; Deo et al. 2007, 2009; Georgantopoulos et al. 2011). Though we note that the relation between and true optical depth is most-likely non-linear and somewhat model and orientation dependent (see Levenson et al. 2007; Nenkova et al. 2008; Schartmann et al. 2008).
Previous investigations have often employed simple extrapolation methods to estimate the depth of the silicate feature in mid-IR spectroscopy (e.g., Spoon et al. 2007; Levenson et al. 2007; Georgantopoulos et al. 2011). This involves measurement of the observed continuum blue-ward and red-ward of the silicate feature, extrapolating a powerlaw between the continuum points and comparing this to the observed flux at . In principle, this extrapolation method is sufficient for AGN-dominated spectra. However, as shown in Fig. 1, the majority of the mid-IR spectra for Compton-thick AGN contain strong polycyclic-aromatic hydrocarbon (PAH) features (at 6.3, 7.7, 11.3 and ) indicative of substantial circumnuclear star-formation activity. These PAH features provide significant contributions to the mid-IR spectra blue-ward of the Si-absorption feature, having the effect of artificially increasing the continuum strength at –, and hence, over-estimating the intrinsic AGN continuum flux at . In a pure synthetic star-forming template with no evidence for extinction, a substantial Si-absorption feature () would be inferred using this basic method. Therefore, we choose to use a spectral decomposition method to remove the host-galaxy emission, and measure the depth of the Si-absorption feature only within the AGN component. Furthermore, to constrain any systematic uncertainties derived from using any one spectral decomposition method we use two independent spectral decomposition procedures.
First, we use the idl software package DecompIR (Mullaney et al. 2011), which performs a Chi-squared minimization of the observed spectrum to a combination of starburst templates (i.e., a host-galaxy component) and an absorbed power-law (i.e., an AGN component). Here, we employ a simple screen extinction curve (Draine, 2003) to account for absorption of the AGN component; thus, we do not attempt to constrain the physical region where dust extinction is occurring. Following Goulding et al. (2011), we allow for a range of star-forming templates, including that of the archetypal nearby starburst, M82; a combined Brandl et al. (2006) starburst template;111We do not include NGC 660, NGC 1365, NGC 3628 and NGC 4945 as part of the Brandl et al. (2006) template as these sources are known to harbor AGN. and a range of compact nuclear and extra-nuclear theoretical starburst templates (Siebenmorgen & Krügel, 2007). From the fitted AGN component, we predict the intrinsic power of the AGN at , and compare this to the observed luminosity to establish an estimate for (column 15 of Table 1). Second, we employ the widely used spectral-fitting package, PAHFIT (Smith et al. 2007) to fit a range of heated dust continua combined with PAH and emission line features to derive (column 16 of Table 1). Following, Georgantopoulos et al. (2011), we change the default dust continuum temperatures in PAHFIT and additionally allow hotter dust temperatures (400–1400K) to be fit to the spectra, these are expected to arise from an accretion heated AGN torus. In general, we find very good agreement for derived using DecompIR and PAHFIT (see columns 15 and 16 of Table 1). In §3, we compare these two measures of the Si-absorption feature to gas column density in Compton-thick AGN.
2.3. The Average mid-IR Spectra of Compton-thick AGN
In Figure 1 we show that Compton-thick AGN at are characterized by a variety of spectral shapes with AGN–starburst ratios of –1. Of the 20 AGN in our sample, only four appear to be dominated by a featureless power-law continuum, while eleven show strong PAH features indicative of circumnuclear starburst activity which, for seven (%) of the sources, even dominates the bolometric output of the galaxies at mid-IR wavelengths (AGN:SB ; see Column 17 of Table 1). By contrast, Sazonov et al. (2012, submitted) find that only % of all hard X-ray selected Compton-thin (–) Type-2 AGN detected by INTEGRAL are dominated by star-formation at mid-IR wavelengths. It is therefore possible that enhanced star-formation activity may be a characteristic specific to the most heavily absorbed () AGN, and not merely a hard X-ray selection effect, at least in the nearby Universe.
Through spectral stacking, we find that Compton-thick AGN, on average, show strong star-formation activity. We stacked all 20 mid-IR spectra to produce a mean mid-IR spectral energy distribution for Compton-thick AGN. We chose to normalize the rest-frame mid-IR spectra for each of the Compton-thick AGN at – (i.e., a wavelength range with a relatively featureless continuum). In the lower panel of Fig. 1, we show the spectral decomposition of the average spectrum modeled using DecompIR. Our modified Brandl et al. (2006) template provides the best -fit ‘starburst’ to the mean Compton-thick AGN spectrum, and contributes % of the overall luminosity to Compton-thick AGN at mid-IR wavelengths.
As we show in Table 1 and Fig. 1, the detection of Si-absorption features in nearby Compton-thick AGN is far from ubiquitous. The Compton-thick AGN cover a wide range in Si-absorption depth, –1.4. While the mid-IR spectra for eight of the Compton-thick AGN do appear to be moderately extinguished, we also find that the spectral decomposition (using DecompIR) of NGC 424 shows strong evidence for Si-emission (); based on unified models, Si-emission features are expected only in unobscured Type-1 AGN, irrespective of specific torus geometry/composition. This result is also partially confirmed by PAHFIT which produces a relatively poor fit () for NGC 424 and by design does not allow apparent optical depths of . Explanations for Si-emission features in Type-2 AGN (e.g., NGC 2110, Mason et al. 2009; SST1721+6012, Nikutta et al. 2009) are that the emission is either (i) arising from the innermost region of the AGN narrow-line region, above the scale-height of the torus (Mason et al., 2009); or (ii) from an unobscured inner region of a low-mass clumpy torus (e.g., based on the models of Schartmann et al. 2008).
From the AGN powerlaw component of the stacked Compton-thick AGN spectrum, we directly measure the depth of the Si-absorption feature at . We find that, on average, the re-radiated AGN emission of a Compton-thick source experiences an apparent attenuation of only , equivalent to an optical extinction of –4.9 mags.222Throughout we assume a standard optical-IR extinction curve (Draine & Li, 2007) in the direction of the Milky-way galactic center such that . Optical depths such as these are readily observed in nearby galactic star-forming regions (e.g., Draine 2003). In § 3.2, we further explore whether this measured dust extinction in Compton-thick AGN can be attributed only to that arising in the host-galaxy and not necessarily from an obscuring torus.
3. Gas Absorption and Dust Extinction in Compton-thick AGN
Unified AGN models postulate that obscuring gas and dust are both located in the circumnuclear torus, so that large gas columns are associated with heavy dust extinction and, for a uniform torus, deep Si-absorption features. With this in mind, a number of recent studies use the existence of high apparent optical depth () to identify Compton-thick AGN (e.g., Georgantopoulos et al. 2011; Nardini & Risaliti 2011; Dasyra et al. 2011). However, as shown in Fig. 1, the large range in seen across our complete Compton-thick AGN sample suggests that the dust producing the Si-absorption features may not be co-spatial with the X-ray absorbing gas.
3.1. Compton-thick AGN with little apparent dust extinction
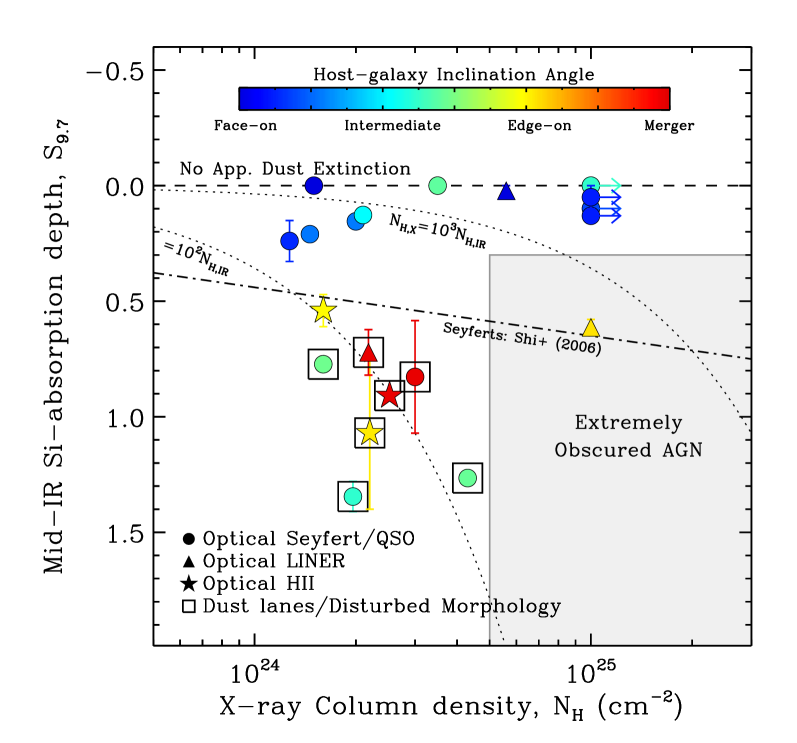
To establish if a physical link exists between the gas and dust in Compton-thick AGN, as expected by a unified model, in this section, we compare the depth of the Si-absorption feature and the gas column density. In Fig. 2, we plot the measured X-ray gas column density versus mid-IR Si-absorption strength (). For each AGN, we use the average value for derived independently from DecompIR and PAHFIT in the previous section. Error bars represent the spread in the values of for a particular source. We find little or no observed correlation between gas absorption and dust extinction in Compton-thick AGN (Spearman’s rank, , ). At least eight of the sources exhibit little or no evidence for dust extinction (), and moreover, NGC 424 has silicate emission features (), in general, such emission features require a direct line-of-sight to the inner AGN torus. By contrast, 9 of the 20 (%) Compton-thick AGN in our sample appear moderately (–1.0) to heavily () obscured at mid-IR wavelengths, as would be expected by unified AGN models that invoke a smooth uniform dust torus. However, the fraction of Compton-thick AGN with high apparent optical depth () is similar to that measured for lower column density (–) AGN detected by Swift-BAT, % (derived from the spectroscopy presented in Mullaney et al. 2010), suggesting that large does not necessarily predicate large dust extinction. Indeed, at least four (%) Compton-thin Swift-BAT AGN presented in Mullaney et al. (2010) have .
In Fig. 2 we additionally show curves of constant gas column density predicted using assuming a standard optical–IR Milky-way extinction curve (Draine & Li, 2007) and a gas–dust ratio of (Fitzpatrick 1985; Draine 2003 for ). We show that Compton-thick AGN are required to have gas–dust ratios which are a factor –10,000 greater than observed galactically, which may suggest there is no single gas–dust ratio in these sources (e.g.,Maiolino et al. 2001). These large gas–dust ratios may be explained by additional absorption of X-ray emission by large quantities of neutral gas residing within the dust-sublimation radius ( pc) of the obscuring torus, so-called ‘partial covering’.
Recent X-ray monitoring campaigns of variable absorption state AGN (e.g., Mrk766; NGC 1365; NGC 4151) have observed short-term occultations of the X-ray source by high-velocity () circumnuclear gas clouds residing at pc (e.g., Risaliti et al. 2009a, b; Wang et al. 2010). The motion and distance from the central source of these gas clouds is consistent with that expected for X-ray absorption arising from the AGN broad-line region (BLR; e.g., Risaliti et al. 2009b, 2011). Within these relatively small radii, SiO dust grains are preferentially destroyed due to the high temperatures (K). Hence, the gas-dust ratio of the BLR may be far larger than that of the dusty-torus. However, partial-covering may not explain the high gas–dust ratio observed in all of the Compton-thick AGN included here. Recent, spatially-resolved results of Marinucci et al. (2012) suggest that the majority of the Compton-thick absorption in NGC 4945 may be at far larger radii ( pc) than the BLR. These variations in BLR and torus absorptions, as well as inclination effects (e.g., Nenkova et al. 2008) may add substantial scatter to an expected gas-dust ratio for nearby AGN. Taken together, these results give rise to several interesting scenarios for: (1) the spatial extent of the intervening gas and dust; (2) the density gradient of the materials across the torus; and (3) possible gas–dust separation boundaries within a torus. Given our small sample and (by design) our limited range in , these issues are beyond the scope of this investigation. We may still robustly conclude that all Compton-thick AGN (i.e., large sources) are not necessarily obscured by cool dust with high apparent optical depth. However, the reverse of this statement may still also be true, in that all systems observed to have may all contain Compton-thick AGN, but are currently missed due to the lack of sufficiently sensitive instrumentation; although these extreme sources are only a limited subset (%) of the Compton-thick AGN population.
3.2. Evidence for dust extinction arising in the host galaxy of Compton-thick AGN
The apparent lack of a correlation between gas and dust attenuation in Compton-thick AGN presented in the previous section suggests that the gas and dust may not be co-spatial. Indeed, Sturm et al. (2005) suggested an extranuclear origin for the Si-absorption features observed in both low and high-luminosity AGN. This is supported by Gandhi et al. (2009) showing in high spatial resolution ground-based photometry of nuclear regions in nearby AGN, that the AGN-produced mid-IR continuum appears almost isotropic and unaffected by Si-absorption. Furthermore, the inclination angle of the host galaxy may have a significant obscuring effect on the AGN emission (e.g., Malkan et al. 1998; Matt et al. 2000; Alonso-Herrero et al. 2011; Lagos et al. 2011). In particular, those AGN presenting strong Si-absorption features are often found to be hosted in highly-inclined and/or merging galaxies (Deo et al. 2007, 2009). For some host-galaxy types and inclinations, the dust extinction may be so over-whelming that it has the ability to completely obscure an AGN (e.g., at optical and even mid-IR wavelengths; Goulding & Alexander 2009). Indeed, the mid-IR AGN emission in the late-type edge-on AGN, NGC 4945 is almost entirely obscured based on Spitzer-IRS spectroscopy. Hence, in this section, we test for a link between the observed mid-IR extinction and the properties of the host galaxy in Compton-thick AGN.
| Sub-sample | AGN:SB | |
|---|---|---|
| (1) | (2) | (3) |
| All sources | 0.36 | 0.62 |
| Optical Seyfert* | 0.14 | 0.83 |
| Optical LINER/HII* | 0.55 | 0.43 |
| Face-on/Intermediate Inclination | 0.19 | 0.75 |
| Edge-on Inclination or Merger | 0.96 | 0.44 |
Notes:- 1Host galaxy properties of sub-sample of main Compton-thick AGN sample; 2Average depth of Si-absorption feature () within stacked mid-IR spectra of sub-sample, measured using DecompIR; 3AGN–starburst ratio derived from decomposition of stacked mid-IR spectra using DecompIR (AGN-dominated ). ∗Excluding QSOs.
In Fig. 2, we highlight the optical classifications and host-galaxy inclinations for the Compton-thick AGN sample.333The host-galaxy inclination angles are derived from the major–minor axis ratio as defined in the Third Reference Catalog of Bright Galaxies (de Vaucouleurs et al., 1991). As noted previously, each of the 20 Compton-thick AGN are hosted in late-type (S0–Scd) or irregular/merging galaxies. From stacked mid-IR spectra, we find that the galaxies classified optically as Seyferts (i.e., using standard optical emission-line diagnostic diagrams) have lower average apparent dust extinction () than the Compton-thick AGN hosted in the optically-classified Low-Ionization Nuclear Emission Line Regions (LINERs; i.e., sources with optical spectra characteristic of LINERs) and HII galaxies (). This dichotomy between apparent dust extinction and galaxy classification provides further evidence that the optical class may be influenced by high-levels of intervening dust in the host galaxy. Additionally, we show that Compton-thick AGN hosted in face-on (low-inclination) galaxies have mid-IR spectra exhibiting little or no apparent dust extinction (). By contrast, Compton-thick AGN hosted in edge-on and/or merging systems have significantly greater dust extinction (; see Table 2) clearly suggesting that the Si-absorption features observed at mid-IR wavelengths have an extra-nuclear origin.
There are also three optically-classified Seyferts (NGC 3281; NGC 4939; Circinus) within our Compton-thick sample which have larger Si-absorption features (–1.5) than would necessarily be expected given their moderate inclination angles (). Visual inspection of optical images used to derive the morphological classifications shows that these three Compton-thick AGN have disturbed nuclear morphologies and/or dust-lanes aligned along the galaxy nucleus. These additional extra-nuclear features may provide further regions of cool-dust, and hence, larger Si-absorption strengths. Taken together, these results suggest that the dominant source of dust-extinction observed at mid-IR wavelengths is not necessarily linked with an obscuring torus, but instead is arising from extended kilo-parsec-scale regions which lie far outside the expected dust-sublimation region of an accreting SMBH. Indeed, this galactic scale origin for the cool dust, which is required to produce deep Si-absorption features, is consistent with the wide range of observed in nearby starburst-dominated Ultra-luminous IR galaxies (e.g., Spoon et al. 2007; Desai et al. 2007; Farrah et al. 2008).
Despite our relatively small sample of sources, the 20 Compton-thick AGN considered here cover a wide range of apparent dust extinction values, –1.7. However, in Fig. 2 we note a clear dearth of sources with and . AGN in this regime are likely to be heavily obscured at both mid-IR and optical wavelengths due, in part, to large quantities of intervening dust within the host galaxy, as well as being heavily obscured at X-ray energies due to large gas columns within the torus. Such heavily-obscured AGN are still not robustly identified in the nearby Universe. Observational expectations are that the number of Compton-thick AGN with – and are roughly constant (e.g., Risaliti et al. 1999; Salvati & Maiolino 2000). Based on the – distribution of our Compton-thick AGN sample, we should expect –8 sources in this ‘heavily-obscured’ parameter space; however, we find only one source, suggesting % still remain unidentified in the nearby Universe. From the sources currently identified with , we expect the majority of the ‘heavily-obscured’ systems to be optically-unidentified due to large quantities of host-galaxy dust as well as being starburst dominated in the mid-IR. Hence, they will still remain unidentified in high-redshift multi-wavelength blank-field surveys. This will potentially cause a bias in our current perceived view of the heavily-obscured AGN population and their place in galaxy evolution models.
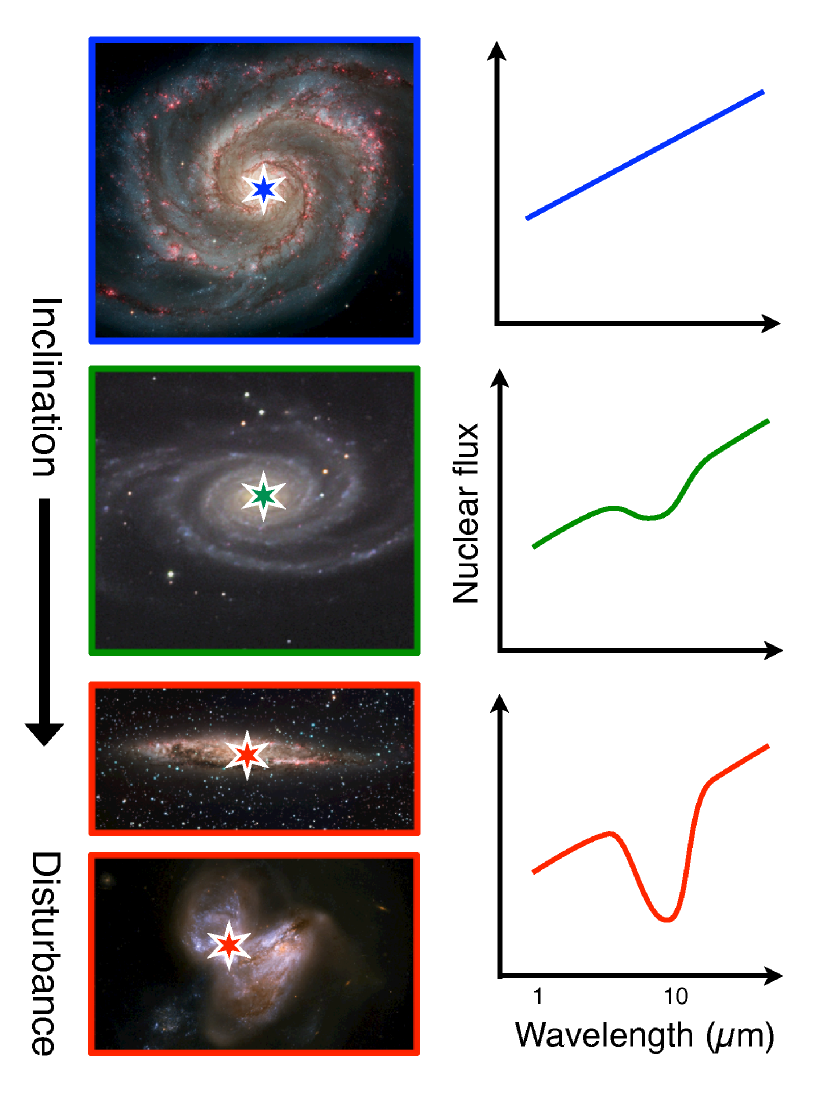
As we have shown, the Si-absorption features in many edge-on Compton-thick AGN appear to be unassociated with the dusty torus surrounding the central engine; we therefore cannot use these sources to constrain theoretical models for the AGN infrared emission. However, based on our results those Compton-thick AGN hosted in face-on galaxies appear relatively unobscured in the mid-IR with –0.3. Such AGN are unlikely to have significant host-galaxy dust extinction along the line-of-sight; hence, any observed Si-absorption will be intrinsic to the torus. For a sensible (physical) range of AGN torus parameters (see Table 1 of Fritz et al. 2006; Table 1 of Schartmann et al. 2008), clumpy torus models (e.g., Nenkova et al. 2002; Schartmann et al. 2008), where-by the dust is randomly distributed in discrete dust clouds, predict similarly weak Si-absorption () for optically-thick edge-on () tori. By contrast, uniform torus models (e.g., Pier & Krolik 1992; Fritz et al. 2006) predict large silicate features () for similar input parameters. Indeed, for a Compton-thick system, uniform torus models reproduce only when invoking a steep dust-density gradient across an extremely compact () and somewhat unphysical torus. Therefore, under the paradigm of a clumpy torus, we suggest that the additional Si-absorption measured in those Compton-thick AGN which are hosted in edge-on host-galaxies becomes entirely consistent with extinction arising from dust which is distributed at very large radii ( parsecs) within the main host galaxy. In light of these findings, in Fig. 3 we present a schematic cartoon of the effect of the host-galaxy inclination and morphology on the observed mid-IR Si-absorption feature.
4. Summary & Conclusions
We have investigated mid-infrared (mid-IR) dust extinction in all hard X-ray ( keV) detected, bona-fide Compton-thick () AGN in the nearby Universe to constrain the dominant source of attenuating dust in heavily obscured AGN and build a more complete understanding of Compton-thick AGN at mid-IR wavelengths. We measured Si-absorption features at 9.7 in archival low-resolution (–127) mid-IR Spitzer-IRS spectroscopy to infer the attenuating dust column in these highly gas absorbed systems and determine the average mid-IR properties of Compton-thick AGN. We found that the mid-IR SEDs of Compton-thick AGN are diverse, and only in a minority of sources (9/20) do we find strong Si-absorption features (). In turn, we suggest that sample selection based solely on the mid-IR absorption features (for ) may miss % of Compton-thick AGN. From analysis of the average mid-IR spectrum, we find that Compton-thick AGN are characterized by roughly equal (40:60 ratio) quantities of starburst and AGN components which is only mildly dust obscured (; –4.9), i.e., average dust-extinction levels which are consistent with those which are observed in host galaxy star-forming regions. Furthermore, the high-levels of star-formation observed in these Compton-thick AGN appears to be a feature specific to the most heavily-obscured AGN in the nearby Universe. If such a trend continues towards higher redshifts, then infrared photometric and X-ray surveys which focus on the detection of powerlaw components to infer AGN activity within a source (e.g., Daddi et al. 2007; Donley et al. 2007, 2008) will be partially biased against the detection of a significant proportion of the Compton-thick AGN population, and hence, may still miss the majority of the most heavily obscured AGN.
We compared and in Compton-thick AGN, and find no significant correlation between these two measures of apparent obscuration. We find that the most heavily attenuated sources () appear to be hosted in galaxies with visible dust-lanes, disturbed morphologies and/or galaxies which are highly-inclined along the line-of-sight. By contrast, we show that sources hosted in face-on galaxies present only weak dust extinction features (–0.3). A similarly narrow-range in Si-absorption is predicted by those theoretical torus models which invoke clumpy distributions for the obscuring material. We suggest that the deeper silicate features (), which are observed in only a minority of Compton-thick AGN (%), arise from intervening dust at much larger scales than predicted for a torus (i.e., from within the host galaxy). When combined with previous investigations, this provides further evidence that the obscuring cool dust, which dominates the extinction seen at mid-IR (and optical) wavelengths, may not necessarily be co-spatial with a gas-rich central torus.
References
- Alexander et al. (2008) Alexander, D. M., et al. 2008, ApJ, 687, 835
- Alexander et al. (2011) —. 2011, ApJ, 738, 44
- Alonso-Herrero et al. (2011) Alonso-Herrero, A., et al. 2011, ApJ, 736, 82
- Antonucci (1993) Antonucci, R. 1993, ARA&A, 31, 473
- Asmus et al. (2011) Asmus, D., Gandhi, P., Smette, A., Hönig, S. F., & Duschl, W. J. 2011, A&A, 536, A36
- Awaki et al. (2009) Awaki, H., Terashima, Y., Higaki, Y., & Fukazawa, Y. 2009, PASJ, 61, 317
- Ballo et al. (2004) Ballo, L., Braito, V., Della Ceca, R., Maraschi, L., Tavecchio, F., & Dadina, M. 2004, ApJ, 600, 634
- Bassani et al. (1999) Bassani, L., Dadina, M., Maiolino, R., Salvati, M., Risaliti, G., della Ceca, R., Matt, G., & Zamorani, G. 1999, ApJS, 121, 473
- Bassani et al. (2007) Bassani, L., Malizia, A., Stephen, J. B., & INTEGRAL AGNs Survey Team. 2007, in ESA Special Publication, Vol. 622, ESA Special Publication, 165
- Beckmann et al. (2006) Beckmann, V., Soldi, S., Shrader, C. R., Gehrels, N., & Produit, N. 2006, ApJ, 652, 126
- Braito et al. (2009) Braito, V., Reeves, J. N., Della Ceca, R., Ptak, A., Risaliti, G., & Yaqoob, T. 2009, A&A, 504, 53
- Braito et al. (2004) Braito, V., et al. 2004, A&A, 420, 79
- Brandl et al. (2006) Brandl, B. R., Bernard-Salas, J., Spoon, H. W. W., Devost, D., Sloan, G. C., & et al. 2006, ApJ, 653, 1129
- Cappi et al. (1999) Cappi, M., et al. 1999, A&A, 344, 857
- Collinge & Brandt (2000) Collinge, M. J., & Brandt, W. N. 2000, MNRAS, 317, L35
- Comastri et al. (2007) Comastri, A., Gilli, R., Vignali, C., Matt, G., Fiore, F., & Iwasawa, K. 2007, Progress of Theoretical Physics Supplement, 169, 274
- Comastri et al. (2011) Comastri, A., et al. 2011, A&A, 526, L9
- Daddi et al. (2007) Daddi, E., et al. 2007, ApJ, 670, 173
- Dasyra et al. (2011) Dasyra, K. M., Georgantopoulos, I., Pope, A., & Rovilos, M. 2011, in SF2A-2011: Proceedings of the Annual meeting of the French Society of Astronomy and Astrophysics, ed. G. Alecian, K. Belkacem, R. Samadi, & D. Valls-Gabaud, 91–94
- de Vaucouleurs et al. (1991) de Vaucouleurs, G., de Vaucouleurs, A., Corwin, Jr., H. G., Buta, R. J., Paturel, G., & Fouque, P. 1991, Third Reference Catalogue of Bright Galaxies (Volume 1-3, XII, 2069 pp. 7 figs.. Springer-Verlag Berlin Heidelberg New York)
- Della Ceca et al. (2002) Della Ceca, R., et al. 2002, ApJ, 581, L9
- Della Ceca et al. (2008) —. 2008, Memorie della Societa Astronomica Italiana, 79, 65
- Deo et al. (2007) Deo, R. P., Crenshaw, D. M., Kraemer, S. B., Dietrich, M., Elitzur, M., Teplitz, H., & Turner, T. J. 2007, ApJ, 671, 124
- Deo et al. (2009) Deo, R. P., Richards, G. T., Crenshaw, D. M., & Kraemer, S. B. 2009, ApJ, 705, 14
- Desai et al. (2007) Desai, V., et al. 2007, ApJ, 669, 810
- Donley et al. (2008) Donley, J. L., Rieke, G. H., Pérez-González, P. G., & Barro, G. 2008, ApJ, 687, 111
- Donley et al. (2007) Donley, J. L., Rieke, G. H., Pérez-González, P. G., Rigby, J. R., & Alonso-Herrero, A. 2007, ApJ, 660, 167
- Draine (2003) Draine, B. T. 2003, ARA&A, 41, 241
- Draine & Li (2007) Draine, B. T., & Li, A. 2007, ApJ, 657, 810
- Dullemond & van Bemmel (2005) Dullemond, C. P., & van Bemmel, I. M. 2005, A&A, 436, 47
- Efstathiou & Rowan-Robinson (1995) Efstathiou, A., & Rowan-Robinson, M. 1995, MNRAS, 273, 649
- Farrah et al. (2008) Farrah, D., et al. 2008, ApJ, 677, 957
- Feruglio et al. (2011) Feruglio, C., Daddi, E., Fiore, F., Alexander, D. M., Piconcelli, E., & Malacaria, C. 2011, ApJ, 729, L4
- Fitzpatrick (1985) Fitzpatrick, E. L. 1985, ApJ, 299, 219
- Fritz et al. (2006) Fritz, J., Franceschini, A., & Hatziminaoglou, E. 2006, MNRAS, 366, 767
- Fukazawa et al. (2001) Fukazawa, Y., Iyomoto, N., Kubota, A., Matsumoto, Y., & Makishima, K. 2001, A&A, 374, 73
- Gandhi et al. (2009) Gandhi, P., Horst, H., Smette, A., Hönig, S., Comastri, A., Gilli, R., Vignali, C., & Duschl, W. 2009, A&A, 502, 457
- Georgantopoulos et al. (2011) Georgantopoulos, I., et al. 2011, A&A, 531, A116
- Gilli et al. (2011) Gilli, R., et al. 2011, ApJ, 730, L28
- Goulding (2010) Goulding, A. D. 2010, PhD thesis, Durham University, UK
- Goulding & Alexander (2009) Goulding, A. D., & Alexander, D. M. 2009, MNRAS, 398, 1165
- Goulding et al. (2010) Goulding, A. D., Alexander, D. M., Lehmer, B. D., & Mullaney, J. R. 2010, MNRAS, 406, 597
- Goulding et al. (2011) Goulding, A. D., Alexander, D. M., Mullaney, J. R., Gelbord, J. M., Hickox, R. C., Ward, M., & Watson, M. G. 2011, MNRAS, 411, 1231
- Granato & Danese (1994) Granato, G. L., & Danese, L. 1994, MNRAS, 268, 235
- Granato et al. (1997) Granato, G. L., Danese, L., & Franceschini, A. 1997, ApJ, 486, 147
- Guainazzi et al. (2000) Guainazzi, M., Matt, G., Brandt, W. N., Antonelli, L. A., Barr, P., & Bassani, L. 2000, A&A, 356, 463
- Hao et al. (2007) Hao, L., Weedman, D. W., Spoon, H. W. W., Marshall, J. A., Levenson, N. A., Elitzur, M., & Houck, J. R. 2007, ApJ, 655, L77
- Hönig et al. (2010) Hönig, S. F., Kishimoto, M., Gandhi, P., Smette, A., Asmus, D., Duschl, W., Polletta, M., & Weigelt, G. 2010, A&A, 515, A23
- Iwasawa et al. (1997) Iwasawa, K., Fabian, A. C., & Matt, G. 1997, MNRAS, 289, 443
- Iwasawa et al. (2001) Iwasawa, K., Matt, G., Fabian, A. C., Bianchi, S., Brandt, W. N., Guainazzi, M., Murayama, T., & Taniguchi, Y. 2001, MNRAS, 326, 119
- Iyomoto et al. (2001) Iyomoto, N., Fukazawa, Y., Nakai, N., & Ishihara, Y. 2001, ApJ, 561, L69
- Lagos et al. (2011) Lagos, C. D. P., Padilla, N. D., Strauss, M. A., Cora, S. A., & Hao, L. 2011, MNRAS, 414, 2148
- Levenson et al. (2006) Levenson, N. A., Heckman, T. M., Krolik, J. H., Weaver, K. A., & Życki, P. T. 2006, ApJ, 648, 111
- Levenson et al. (2007) Levenson, N. A., Sirocky, M. M., Hao, L., Spoon, H. W. W., Marshall, J. A., Elitzur, M., & Houck, J. R. 2007, ApJ, 654, L45
- Luo et al. (2011) Luo, B., et al. 2011, ApJ, 740, 37
- Maiolino et al. (2001) Maiolino, R., Marconi, A., Salvati, M., Risaliti, G., Severgnini, P., Oliva, E., La Franca, F., & Vanzi, L. 2001, A&A, 365, 28
- Maiolino et al. (1998) Maiolino, R., Salvati, M., Bassani, L., Dadina, M., della Ceca, R., Matt, G., Risaliti, G., & Zamorani, G. 1998, A&A, 338, 781
- Malaguti et al. (1998) Malaguti, G., et al. 1998, A&A, 331, 519
- Malkan et al. (1998) Malkan, M. A., Gorjian, V., & Tam, R. 1998, ApJS, 117, 25
- Marinucci et al. (2012) Marinucci, A., Risaliti, G., Wang, J., Nardini, E., Elvis, M., Fabbiano, G., Bianchi, S., & Matt, G. 2012, MNRAS, L440
- Markwardt et al. (2005) Markwardt, C. B., Tueller, J., Skinner, G. K., Gehrels, N., Barthelmy, S. D., & Mushotzky, R. F. 2005, ApJ, 633, L77
- Mason et al. (2009) Mason, R. E., Levenson, N. A., Shi, Y., Packham, C., Gorjian, V., Cleary, K., Rhee, J., & Werner, M. 2009, ApJ, 693, L136
- Matt et al. (1997) Matt, G., et al., , & . 1997, A&A, 325, L13
- Matt et al. (2000) Matt, G., Fabian, A. C., Guainazzi, M., Iwasawa, K., Bassani, L., & Malaguti, G. 2000, MNRAS, 318, 173
- Matt et al. (1999) Matt, G., et al. 1999, A&A, 341, L39
- Mullaney et al. (2011) Mullaney, J. R., Alexander, D. M., Goulding, A. D., & Hickox, R. C. 2011, MNRAS, 414, 1082
- Mullaney et al. (2010) Mullaney, J. R., Alexander, D. M., Huynh, M., Goulding, A. D., & Frayer, D. 2010, MNRAS, 401, 995
- Mushotzky et al. (1993) Mushotzky, R. F., Done, C., & Pounds, K. A. 1993, ARA&A, 31, 717
- Nardini & Risaliti (2011) Nardini, E., & Risaliti, G. 2011, MNRAS, 415, 619
- Nenkova et al. (2002) Nenkova, M., Ivezić, Ž., & Elitzur, M. 2002, ApJ, 570, L9
- Nenkova et al. (2008) Nenkova, M., Sirocky, M. M., Nikutta, R., Ivezić, Ž., & Elitzur, M. 2008, ApJ, 685, 160
- Nikutta et al. (2009) Nikutta, R., Elitzur, M., & Lacy, M. 2009, ApJ, 707, 1550
- Norman et al. (2002) Norman, C., et al. 2002, ApJ, 571, 218
- Pier & Krolik (1992) Pier, E. A., & Krolik, J. H. 1992, ApJ, 401, 99
- Pier & Krolik (1993) —. 1993, ApJ, 418, 673
- Risaliti et al. (1999) Risaliti, G., Maiolino, R., & Salvati, M. 1999, ApJ, 522, 157
- Risaliti et al. (2011) Risaliti, G., Nardini, E., Salvati, M., Elvis, M., Fabbiano, G., Maiolino, R., Pietrini, P., & Torricelli-Ciamponi, G. 2011, MNRAS, 410, 1027
- Risaliti et al. (2009a) Risaliti, G., et al. 2009a, MNRAS, 393, L1
- Risaliti et al. (2009b) —. 2009b, ApJ, 696, 160
- Salvati & Maiolino (2000) Salvati, M., & Maiolino, R. 2000, in Large Scale Structure in the X-ray Universe, ed. M. Plionis & I. Georgantopoulos, 277
- Sazonov et al. (2007) Sazonov, S., Revnivtsev, M., Krivonos, R., Churazov, E., & Sunyaev, R. 2007, A&A, 462, 57
- Schartmann et al. (2008) Schartmann, M., Meisenheimer, K., Camenzind, M., Wolf, S., Tristram, K. R. W., & Henning, T. 2008, A&A, 482, 67
- Shi et al. (2006) Shi, Y., et al. 2006, ApJ, 653, 127
- Siebenmorgen & Krügel (2007) Siebenmorgen, R., & Krügel, E. 2007, A&A, 461, 445
- Smith et al. (2007) Smith, J. D. T., et al. 2007, ApJ, 656, 770
- Spoon et al. (2007) Spoon, H. W. W., Marshall, J. A., Houck, J. R., Elitzur, M., Hao, L., Armus, L., Brandl, B. R., & Charmandaris, V. 2007, ApJ, 654, L49
- Sturm et al. (2005) Sturm, E., et al. 2005, ApJ, 629, L21
- Turner et al. (2000) Turner, T. J., Perola, G. C., Fiore, F., Matt, G., George, I. M., Piro, L., & Bassani, L. 2000, ApJ, 531, 245
- Ueda et al. (2007) Ueda, Y., et al. 2007, ApJ, 664, L79
- Vignali & Comastri (2002) Vignali, C., & Comastri, A. 2002, A&A, 381, 834
- Vignati et al. (1999) Vignati, P., et al. 1999, A&A, 349, L57
- Wang et al. (2010) Wang, J., Risaliti, G., Fabbiano, G., Elvis, M., Zezas, A., & Karovska, M. 2010, ApJ, 714, 1497
- Wu et al. (2009) Wu, Y., Charmandaris, V., Huang, J., Spinoglio, L., & Tommasin, S. 2009, ApJ, 701, 658