Early-type galaxies at z = 1.3. I. The Lynx supercluster: cluster and groups at z=1.3. Morphology and color–magnitude relation
Abstract
We confirm the detection of three groups in the Lynx supercluster, at , through spectroscopic follow–up and X–ray imaging, and we give estimates for their redshifts and masses.
We study the properties of the group galaxies as compared to the two central clusters, RX J0849+4452 and RX J0848+4453. Using spectroscopic follow-up and multi-wavelength photometric redshifts, we select 89 galaxies in the clusters, of which 41 are spectroscopically confirmed, and 74 galaxies in the groups, of which 25 are spectroscopically confirmed.
We morphologically classify galaxies by visual inspection, noting that our early–type galaxy (ETG) sample would have been contaminated at the 30% –40% level by simple automated classification methods (e.g. based on Sersic index).
In luminosity selected samples, both clusters and groups show high fractions of bulge–dominated galaxies with a diffuse component that we visually identified as a disk, and which we classified as bulge–dominated spirals, e.g. Sas. The ETG fractions never rise above in
the clusters, which is low compared to the fractions observed in other massive clusters at . In the groups, ETG fractions never exceed . However, overall bulge–dominated galaxy fractions (ETG plus Sas) are similar to those observed for ETGs in clusters at . Bulge–dominated galaxies visually classified as spirals might also be ETGs with tidal features or merger remnants. They are mainly red and passive, and span a large range in luminosity. Their star formation seems to have been quenched before experiencing a morphological transformation. Because their fraction is smaller at lower redshifts, they might be the spiral population that evolves into ETGs.
For mass–selected samples of galaxies with masses within , the ETG and overall bulge–dominated galaxy fractions show no significant evolution with respect to local clusters, suggesting that morphological transformations might occur at lower masses and densities.
The ETG mass–size relation shows evolution towards smaller sizes at higher redshift in both clusters and groups, while the late–type mass–size relation matches that observed locally.
When compared to the clusters,the group ETG red sequence, shows lower zero points (at ), and larger scatters, both expected to be an indication of a younger galaxy population. However we show that any allowed difference between the age in groups and clusters would be small when compared to the differences in age in galaxies of different masses.
1 Introduction
The currently favored cosmological model, CDM (e.g. Komatsu et al. 2011), predicts that some of the galaxies in clusters formed at the peaks of dark matter fluctuations (a pristine population) while others were accreted from surrounding infalling groups and the field (infalling population). During this accretion process, we expect galaxy interactions with the environment to quench star formation and trigger a stellar population (from active to passive) and morphological (from late to early–type) transformation (e.g. Diaferio et al. 2001; De Lucia et al. 2006; Poggianti et al. 2006, 2010; Faber et al. 2007; Moran et al. 2007). Various transformation mechanisms have been proposed, some driven by the galaxy environment – including merging, galaxy harassment, and gas stripping – some related to intrinsic galaxy properties, such as mass, and still others to both (for a review see Boselli & Gavazzi 2006; for a critical summary of transformation mechanisms in clusters: Treu et al. 2003).
The primary mechanisms driving galaxy transformations in clusters arise from galaxy–galaxy and galaxy–cluster (mainly tidal) interactions, dynamical friction, and interaction with the hot cluster medium (ram pressure stripping, strangulation). Dynamical friction drags galaxies towards the cluster center where they can merge with the central galaxy. For galaxy–galaxy mergers to occur, however, the internal velocity dispersion of the galaxies must be greater than their orbital energy. In galaxy clusters, where cluster velocity dispersions are high, galaxy mergers are therefore unlikely, while groups present an ideal environment for such interactions.
CDM semianalytical models (e.g. McGee et al., 2009) predict that of galaxies in a Coma-sized cluster at z=0.5 are accreted from groups with masses larger than . At higher redshift, the number of galaxies accreted by a cluster and the fraction of galaxies that suffered a transformation by the environment are both lower. This model implies that at , environmental effects should not yet be significant, but will be predominant only at .
Moreover, both star formation and morphological transformations are observed to occur mainly at redshifts when star formation decreases and the early–type population increases. While the elliptical fractions show little evolution, this increase is due to a lack of S0 galaxies at higher redshift (e.g. Postman et al. 2005; Poggianti et al. 2006, 2010; Moran et al. 2007).
Both models and observations agree that at high redshift, e.g. , we should observe galaxies before or during these transformations and structures in the very first phases of their assembly. As a result, we can observe galaxies in groups before their infall into the denser cluster environment and disentangle galaxy transformations occurring in different environments.
Recent work (e.g. Poggianti et al. 2009; Just et al. 2010) has shown that the evolution of the S0 galaxy fraction is stronger in poor clusters and groups compared to more massive clusters over the redshift range , suggesting that transformation mechanisms associated with these environments (e.g. galaxy-galaxy interactions as opposed to galaxy-cluster interactions) dominate the S0 transformations.
At higher redshifts (), however, Capak et al. (2007), have shown that early–type galaxy fractions change faster in high density environments. Since this is the range in redshift where most of the group accretion takes place in , we would like to understand which galaxies are accreted by galaxy clusters at this epoch. Their morphology, and stellar population before accretion should provide clues to understanding how the accretion process changes the high-density population. With this aim, we have studied in detail the cluster and group population of a supercluster at , the Lynx supercluster.
Superclusters are the largest structures observed in the Universe and the ideal laboratory for studying galaxy transformations in different environments. Their dimensions can range from 10 to 100 Mpc, and they are composed of two or more galaxy clusters and surrounding groups. Studies of these large structures at high redshift have proliferated in recent years (e.g. Gal et al. 2008; Lubin et al. 2009; Tanaka et al. 2009), and reveal the different star formation rates and histories of galaxy populations in different environments at . Only in recent years have superclusters been discovered at redshifts .
Thanks to recent wide–field multi–wavelength imaging with the Suprime-Cam on the Subaru telescope, and infrared follow–up, the first supercluster at was discovered by Nakata et al. (2005), the Lynx supercluster, followed by the discovery of a supercluster around RDCS J1252.9-2927 by Tanaka et al. (2007). A recent paper by Tanaka et al. (2009) confirmed this last superstructure through spectroscopic follow–up with FORS2 and GMOS on Gemini-South, and presented detailed studies of the cluster and group galaxy star formation activity. Their results show a population of red star-forming galaxies in the groups that are not found in the the central cluster. They interpret their observed spectral line strengths and colors by the presence of star formation heavily obscured by dust. They suggest that this is driven by galaxy–galaxy interactions that are more active in galaxy groups.
In this paper we study galaxy transformations in the Lynx supercluster at , confirming the detection of a supercluster with spectroscopic follow–up and X-ray imaging.
The Lynx supercluster is composed of two clusters and numerous surrounding groups. The two clusters, RX J0849+4452 (the Eastern cluster; hereafter Lynx E) and RX J0848+4453 (the Western cluster; hereafter Lynx W) were detected in the near–infrared (Lynx W; Stanford et al. 1997) and through their X–ray emission in the ROSAT Deep Cluster Survey (Rosati et al. 1999), and spectroscopically confirmed respectively at z=1.261 (Rosati et al. 1999) and z=1.273 (Stanford et al. 1997).
While Lynx E presents a more compact galaxy distribution, with a central bright galaxy merger (van Dokkum et al. 2001, Yamada et al. 2002) (that might eventually lead to a central cD, cluster dominant galaxy), the galaxies in Lynx W are more sparsely distributed in a filamentary structure, and do not present an obvious central bright cD galaxy. Their X–ray emission as seen by Chandra (Stanford et al. 2001) follows the optical distribution, with Lynx E showing a more compact spherical shape and Lynx W a more elongated one, and luminosities of erg and erg , respectively (Rosati et al. 1999; Stanford et al. 2001; Ettori et al. 2004). Together with a more compact galaxy distribution, this is an indication that Lynx E is likely to be more dynamically evolved with respect to Lynx W. The velocity dispersion for Lynx W was measured at km/s (Stanford et al. 2001). This value is consistent with estimates from the Jee et al. (2006) weak lensing analysis of km/s and km/s for Lynx E and Lynx W, respectively. The most recent estimates of the cluster temperatures are keV and keV, respectively (Jee et al. 2006 measurements that are consistent with Stanford et al. 2001).
Deep, panoramic multi–color (–bands) imaging with Suprime–Cam on the Subaru telescope identified seven galaxy groups around these two central clusters (Nakata et al. 2005). This makes the Lynx region a unique laboratory, being one of the very few superclusters observed at such a high redshift, and for this reason one of the best regions at in which we to study properties of evolving galaxies in different environments within a structure that is in the process of assembly.
This paper is the first of a series of papers centered on the Lynx supercluster, and will be followed by an analysis of galaxy masses and ages (Raichoor et al. 2011, Paper II), their star formation histories as compared to the field (Rettura et al. 2011; hereafter Paper III), and the evolution of the Kormendy and mass–size relations in different environments (Raichoor et al. 2012, hereafter Paper IV). In this paper, we will mainly concentrate on galaxy morphology and the build–up of the color–magnitude relation. Our observations are presented in Section 2. In Section 3 we describe our sample selection. In Section 4 we describe our galaxy morphology and color measurements. In Section 5, we present and discuss our results, and we conclude with Section 6.
We adopt the WMAP cosmology (, , ; Komatsu et al. 2011). All ACS filter magnitudes are given in the AB system (Oke & Gunn 1983; Sirianni et al. 2005).
2 Observations
2.1 Imaging and spectroscopy
We have observed the main two clusters of the Lynx superstructure as part of the ACS Intermediate Redshift Cluster Survey (IRCS; Postman et al. 2005), in the F775W (from hereafter ) and F850LP (from here after ) bandpasses with the ACS Wide Field Camera (WFC) in March and April 2004, for a total of 7300 and 12200 secs, respectively. The surrounding Lynx groups were observed with the ACS WFC as part of an HST GO program (PI: Mei) between December 2005 and February 2006, in the same bandpasses, and , for a total of 6300 and 10500 secs, respectively. The ACS WFC resolution (pixel size) is 0.05 ″/pixel, and its field of view is 202 ″x 202 ″. The ACS images were processed with the APSIS pipeline (Blakeslee et al. 2003b), with a Lanczos3 interpolation kernel. Our photometry was calibrated to the AB system, with synthetic photometric zero-points of 25.678 and 24.867 mag, respectively, in and from the HST/ACS website111http://www.stsci.edu/hst/acs/. A reddening of was adopted (Schlegel et al. 1998), with and .
Spitzer/IRAC (Fazio et al. 1998) 3.6m and 4.5m band imaging of the clusters was obtained in April 2004 in 30 exposures of 200 s each for a total exposure time of 6000 s. Lynx groups were observed in November 2005 and May 2006, in 12 exposures of 100 s each, for a total exposure time of 1200s (PI: S.A. Stanford). The data were reduced using standard Spitzer procedures. The basic calibrated data (hereafter BCD) frames were first corrected for muxbleed and pulldown using custom IDL scripts (now available from the Spitzer Science Center), and then processed with MOPEX to produce coadded mosaics.
Spitzer/MIPS 24 m were also used, from program 83 (PI Rieke; AORs 4758016 and 4758784) and were observed April 9, 2004 in the photometry mode. To produce a mosaic, we combined the pointings towards the two clusters in the larger Lynx supercluster. The BCD frames were combined using the available MOPEX software from the Spitzer Science Center in 2006. The processing required eliminating the first two BCD frames in each exposure sequence, and constructing an effective flatfield frame to remove some detector artifacts. A total of 224 BCD frames were combined into a single mosaic with 2.45 pixels. We used the available mask files to eliminate bad pixels. The final mosaic had median background value of 35.21 MJy sr-1 with a dispersion of 0.018 MJy sr-1 or 2.53 Jy per pixel. The mosaic was aligned with the existing ACS imaging using sources in common between the two mosaics. Using tool APEX, we constructed a source catalog of the mosaic. The resulting catalog has a 5 flux limit of 68 Jy at the deepest part of the mosaic. However, because of source confusion and the low effective exposure times in the rest of the data, the effective flux limit of the catalog is 125 Jy.
The entire supercluster has been observed with Suprime-Cam at the SUBARU telescope in the V, R, i’, and z’ bandpasses between November 2000 and March 2001. The Suprime-Cam has a field of view of 27 x 27 with a resolution of 0.2 arcsec/pixel. Details can be found in Nakata et al. (2005). These observations have been used to obtain galaxy photometric redshifts and to identify seven groups around the two main clusters. We will refer to Groups 1 through 7, with the same identifications as given in Nakata et al (2005).
To complement space and Suprime-Cam observations, we added to our analysis ground–based observations in the R, J, and Ks–band (PI: S. A. Stanford), described in our companion paper Paper II. Here, we briefly summarize these observations. The two clusters were observed in the R–band with the red camera on the Keck/LRIS Spectrograph (Oke 1995 ), for a total exposure time of 8750 s. The groups have Palomar/COSMIC (Kells 1998) –band imaging, obtained in November 1999 with the COSMIC instrument , for a total exposure time of 16200 s. The near-infrared and band imaging was obtained in December 2003 at the KPNO 2.1 m telescope with the FLAMINGOS instrument (Elston 1998), for a total exposure time of about 24000 s and 26700 s, respectively.
The imaging observations were followed by spectroscopic campaigns at the SUBARU, Keck, and Gemini telescopes.
Cluster spectroscopy was obtained from published data (9 members from Stanford et al. 1997, 8 from Rosati et al. 1999) and spectroscopic runs at the Keck telescope with the Low Resolution Imaging Spectrograph (LRIS; Oke et al. 1995) and the Deep Imaging Multiobject Spectrograph (DEIMOS) (for details see Mei et al. 2006). In total, we have 41 confirmed cluster members with spectroscopic redshifts between 1.25 and 1.28.
Group spectroscopy was obtained from the Subaru, Keck and Gemini telescopes. FN conducted a spectroscopic follow-up observation on January 2007 with FOCAS (Kashikawa et al. 2002) in MOS mode, at the Subaru telescope. We used a 300 line grating blazed at 6500 Å with the order-cut filter SO58. The wavelength coverage was between 5800 Å and 10000 Å with a pixel resolution of 1.34 Å . A slit width was set to , which gave a resolution of . We selected four FOCAS fields which efficiently cover the large-scale structure found by Nakata et al. (2005). Target galaxies were primarily selected on the basis of their photometric redshifts, as in Nakata et al. Observing conditions were good with arcsec seeing. Total on-source exposures ranged between 8100 s and 14400 s. Data reduction was performed by FN in a standard manner using IRAF. All the reduced 1d/2d spectra were visually inspected to estimate the redshift of each object. In this work we only use spectroscopic redshifts with a good quality measurement.
Keck spectroscopy was performed with the instrument DEIMOS by AS and BH on 18 and 19 October 2009 UT to cover Groups 1 and 2. On 18 October, three exposures of 1800s each were obtained when conditions were clear with 0.7 arcsec seeing. On 19 October four exposures of 1800s were obtained when conditions were clear with 0.9 arcsec seeing. The data were reduced by BH using the DEEP pipeline.
We obtained 20 hours of spectroscopic observations with GMOS-N at the Gemini North Telescope, between January and April 2006, on five (Group 1, Group 2, Group 3, Group 6 and 7) of the original seven groups observed for a total of 14400 secs each. These observations were reduced by SM, RC and RD with the standard Gemini IRAF package released from the Gemini Observatory.
From the spectroscopic redshifts obtained at SUBARU and Gemini, Groups 6 and 7 from Nakata et al. (2005) were confirmed to be structures at . Three groups, Groups 1, 2 and 3 were confirmed to be at the same redshift as the two main clusters. The two clusters have a relative projected distance of 2 and the two clusters and three spectroscopically confirmed groups (see below) cover a scale of around 30 , in the WMAP cosmology (Komatsu et al. 2011).
This paper will concentrate only on those three spectroscopically confirmed groups, whose properties are summarized in Table 1 .
2.2 XMM Newton imaging
We retrieved XMM Newton imaging (Jansen et al. 2001; OBSID 0085150101, 0085150201, 0085150301) covering the Lynx supercluster region to evaluate group detection and estimate masses. We use the data collected by the European Photon Imaging Cameras (EPIC): the pn-CCD camera (Struder et al. 2001) and the MOS-CCD cameras M1 and M2 (Turner et al. 2001), with total exposure time of 150ks before cleaning, and net time of 70.0 ks, 89.8 ks, 90.7 ks, respectively, after cleaning (see below).
Initial data processing was performed using the XMMSAS version 7.1 (Watson et al. 2001; Kirsch et al. 2004; Saxton et al. 2005). We then remove time intervals affected by solar flares to create the calibrated event file, as in Zhang et al. (2004), and apply the four-stage background subtraction of Finoguenov et al. (2007) to increase our capability to detect extended emission. High background in some of the MOS chips (Kuntz & Snowden 2008) was checked and no instances were found. To create a final mosaic of cleaned images in the area, we estimate the background in each image for each instrument and correct for differences in sensitivity between instruments.
The residual map of extended sources is obtained by subtracting a PSF model using the detected point sources from the background subtracted image and smoothing the image with a Gaussian kernel of 32” width. The same technique has been used to estimate the emission in Tanaka, Finoguenov, Ueda (2010) and Gobat et al. (2011).
Fig. 1 shows the XMM composite image. We detect Group 3 at 2.6 , Group 2 at 1.6 . Group 1 shows a 0.5 excess, and there is an excess of the X-ray emission (at around 2 ) just close to it. From the X-ray emission and scaling relations (Markevitch et al. 1998; see also Bielby et al. 2010 for a detailed description of our X–ray analysis), we obtain a mass estimate for Groups 2 and 3 of and , respectively, and a 95% upper limit for the mass of Group 1 of .
3 Cluster and Group sample selection
Our ACS images were aligned on the center of the cluster X–ray emission from Stanford et al. (2001), for the two clusters, and on the center of the density overdensities as estimated from Nakata et al. from a 10 nearest neighbor algorithm for the groups. For this analysis, we selected cluster and group galaxies using newly estimated photometric redshifts from our space and ground–based data, and a Friend–of–Friends algorithm (FoF, Geller & Huchra 1983; see also Postman et al. 2005) with scale derived from the two clusters (see below).
As a first step in the galaxy selection, we consider as potential group members all galaxies with SUBARU photometric redshifts from Nakata et al. (2005), ACS magnitude brighter than (the limit magnitude for dependable visual morphological classification; see Postman et al. 2005), and ACS color . This first selection is larger than the initial range proposed by Nakata et al. (2005). It is based on the range in SUBARU photometric redshifts and ACS colors covered by spectroscopically confirmed early and late–type cluster members from our spectroscopic follow-up (see below) and the large range of ACS colors predicted from Bruzual & Charlot (2003; BC03) stellar population models for early and star–forming galaxies at . With this choice we obtain 195 objects with estimated completeness at more than 90% (from the spectroscopic follow–up, and the photometric redshift uncertainties) at our limiting magnitude mag.
From our spectroscopic runs on the groups, we obtained 52 redshift measurements, of which 25 are spectroscopically confirmed members with redshifts between 1.25 and 1.28, with average spectroscopic redshift (Group 1; from 9 members), (Group 2; from 7 members), (Group 3; from 9 members). These values are slightly different from those published in Paper II because we have obtained new spectroscopically confirmed members since publication.
Using our spectroscopic redshifts, we then eliminated from this sample all 27 spectroscopically confirmed outliers (9 in Group 1, 11 in Group 2, 7 in Group 3). The contamination rate in all group spectroscopic samples, selected with SUBARU photometric redshifts, is and similar for the early and late–type (see below for morphological classification) samples.
For the remaining 168 objects, we eliminated Sextractor multiple identifications (in the ACS images) and derived a new set of photometric redshifts using our space and ground–based multi–wavelength photometry (in the range 0.6-4.5 ) as described in our companion paper Paper II. We also re-estimated photometric redshifts for the 94 cluster galaxies selected with the same criteria in color and photometric redshift.
To estimate new photometric redshifts, we used the photometry from Raichoor et al. (2011; see this paper for details on photometry and the sky background subtraction) and the public software Le Phare (Arnouts et al. 2002; Ilbert et al. 2006), based on a template fitting method. The best photometric redshift is calculated using the median of the Probability Distribution Function. For our input parameters, we followed Ilbert et al. (2010): BC03 templates, solar metallicity, an exponentially decaying star formation with in the range 0.1 to 5 Gyr, and a Calzetti et al. (2000) extinction law with E(B−V) in the range 0 to 0.5.
These new photometric redshifts include optical photometry, ACS and , near–IR and intermediate IR photometry from Spitzer/IRAC, and help us to better define the statistics of our sample. In total we have 41 and 25 spectroscopically confirmed members in the clusters and groups, respectively, for a total of 66 spectroscopically confirmed members. At z=1.3, photometric redshift uncertainties are larger than a galaxy group extension in redshift space (e.g. Evrard et al. 2008, George et al. 2011). We use an empirical approach to estimate the completeness and purity of our sample. Most (90% of the entire sample; 95% of the early–type, 83% of the late–type ) of our spectroscopically confirmed members show new photometric redshifts in the range . The remaining 10% show . We use this new range in photometric redshift (e.g. ) to select our final sample. In this range, we also find only 12 group outliers, making our estimated contamination level decrease from 50% to 20% with this new photometric redshift selection. From these empirical estimates, we consider our sample to be (for the early–type galaxies) and (for the late–type galaxies) complete and contaminated at .
To verify these estimates, we used as test sample the George et al. (2011) COSMOS group and field sample, that uses Ilbert et al. (2009) photometric redshifts obtained with SED fitting using 30 bandpasses and with the software Le Phare with the same input parameters as ours (once considering our adaptations to a z=1.26 sample). When using Ilbert et al. (2009) photometric redshifts as reference redshifts (hereafter ), calibrated on VIMOS/VLT and DEIMOS/Keck spectroscopy, and estimating photometric redshift for the COSMOS sample using only the four bandpasses we use in this paper (hereafter ), we obtain a difference in photometric redshifts (-) consistent with zero, with a standard deviation . Ilbert et al. (2009) estimates the uncertainty on their photometric redshifts to be , at and at the magnitude depth of our sample. We estimate then the uncertainty on our photometric redshift measurement to be . When we estimate how many COSMOS galaxies with in the range are recovered within the range in , we find of the objects. On the other hand, when estimating how many objects with in the range , also have in that range, we obtain . When instead of , we use our empirical selection, e.g. the range in redshift , these percentages become and , very similar to the percentage of completeness and purity, respectively, that we have estimated based on our empirical analysis. These value are also compatible with more sophisticated estimates of uncertainties on photometric redshift and group membership estimated in George et al. (2011).
Therefore, we estimate our photometric redshift uncertainty to be at , and that our photometric redshift selection is complete for the early–type galaxies ( for the late–type), with a contamination of .
To further select group members, we applied a FoF algorithm. As starting center we initially used the overdensity centers defined by Nakata et al. (2005). When galaxies have morphological classifications (see below), we redefine our final group centers as luminosity–weighted centers from our early–type red population. Our linking scale was normalized on the two main clusters, and chosen as the scale at which we select all spectroscopically confirmed cluster members. We obtain a linking scale corresponding to a local distance of Mpc, normalized to z=1.26 and to our magnitude range as in Postman et al. (2005).
We have also re-selected the cluster galaxy sample exactly in the same way as the group sample, using photometric redshifts and the ACS GTO spectroscopic follow-up described in Mei et al. (2006, 2009). Our cluster sample remains unchanged.
Our final sample comprises 89 galaxies in the clusters, of which 41 are spectroscopically confirmed, and 74 galaxies in the groups, of which 25 are spectroscopically confirmed.
4 Morphological classification and photometry
4.1 Morphological classification
All our selected group members have been morphologically classified using the same visual classification as Postman et al. (2005), based on the ACS images, the closest to rest frame B–band (conventionally used for morphological classification) at . Specifically, we classified galaxies as early-type (ETGs, defined as elliptical and S0s), late-type (Sa, Sb, Sc), and irregular/undefined. With respect to Postman et al. (2005), we have added a new class of clumpy/uncertain objects, and objects presenting interactions or visible tidal tails to study their occurrence in the cluster and group population. We will refer to these objects as disturbed. Three of us, SM, MP and AS, have independently classified all galaxies in this sample and compared our results. As already noted in other work (e.g. Postman et al 2005), our classification of early-type vs late-type galaxies was the same in around of the cases, while it is the same in approximately of the cases when distinguishing the early (e.g. elliptical from S0) and late-type subclasses. From here on, the terms early–type and late–type galaxy refer, respectively, to galaxies morphologically classified as elliptical and S0, and as spiral galaxies according to this visual classification. Sa galaxies are classified so because they show diffuse features that look like spiral arms around a massive bulge. We call this class of galaxies bulge–dominated spirals (hereafter BDS or galaxies visual classified as Sa), and we cannot exclude that the diffuse component that we identify as a disk might be tidal structures or merger remnants. We show our new visual classification in Figs. 2 to 4.
For each of the galaxies, we also measured the 180∘ rotational asymmetry and image concentration parameters (Abraham et al. 1994; Conselice et al. 2000) using the PyCA software (Menanteau et al. 2006). In Fig. 5, we show our visual morphology in a concentration/asymmetry plane. Most of our visually classified ETGs have and . In this region, we found 89% of our total early–type population (excluding the bright early–type pair and triplet - see below), 50% of the Sa, 13% of the late spirals, irregulars or disturbed.
The distribution of the morphological types in this region is 66% of visual early–type, 18% of Sa galaxies, 16% of late–type spirals. We can separate at 10% early from late–type galaxies (excluding Sa galaxies) just by simple cuts in the C/A plane, and both samples will have more or less concentrated Sa, around half among the highly concentrated/early-type dominated region and the other half in the less concentrated/late–type region. Sa galaxies, because of their large/concentrated bulges are then a class that highly contaminates the ETGs.
If we draw a line in the log(A) vs log(C) plane, following Abraham et al. (1996) and Menanteau et al. (2006), and optimizing it for our sample, we obtain two regions that maximize the recovery of two separate classes of early and late–type galaxies (e.g. maximizing the maximum percentage of early–type and the less of late–type contamination in the early-type region ). When we use this line to separate classes, we classify as early–type 96% of the visually classified early-type galaxies, 45% of the Sa and 8% of the late–type spirals. The distribution of the morphological types in this new “early–type” region is visual early–type 73%, Sa 23%, Late type 4%. When we exclude Sa galaxies, late-type galaxies are a small contamination for ETGs selected in this way. However, when the entire late–type population is considered, they would contaminate the ETG sample at 30%, mostly because of the Sa galaxies. This classification would do better than the simple cut above, but we will still have 30% of the “early–type” that do visually show a disk, and that we visually classify as Sa.
In Fig. 5, we also show galaxies with Sersic index (see Sect. 4.2), often used to separate early from late–type galaxies. In the combined cluster and group sample, we find that 70% of the early-type galaxies have , and 78% of the late-type galaxies have . Moreover, 57% of the galaxies with are ETGs, 86% of the galaxies with are late-type. If we would classify early–type galaxies objects with , our ETG sample would be contaminated at % by late–type galaxies.
Early–type galaxies identified only by their compactness (or Sersic index) are highly contaminated by BDS. Bernardi et al. (2009) obtain similar results in the local Universe with a detailed analysis of the local Sloan Digital Sky Survey (SDSS; York et al. 2000) ETG sample.
When using more advanced non–parametric techniques from Huertas-Company et al. (2008, 2009, 2011) 222the code and the training sets are available at http://gepicom04/galsvm.htm, calibrated on the SDSS visual classifications, they are more efficient and we recover 89% of our visual ETGs with 5% contamination (2 galaxies which are visually classified as Sas). Interestingly, the algorithm manages also to isolate Sa galaxies with reasonably good accuracy: 6/9 visual Sas are classified by the algorithm as early-spirals, 1 as a late spiral and 2 of as early-type.
In this paper, we only use our visual morphological classification and discuss how some of our results would change based on a simple automated classification.
Our first result is an absence of massive/bright red bulge pairs or triplets (dry mergers) in the groups. While we do observe a double red bulge and a triple red bulge merger in the two clusters (see also van Dokkum et al. 2001, Yamada et al. 2002, Mei et al. 2006b), no merger of this kind is visible in any of the groups.
Four disturbed objects are observed in the two clusters (3 in the less evolved Lynx W), and 9 were found in the groups (Fig 4). Disturbed morphologies appear as blue compact galaxies with a companion of the same mass (ID 1282) or smaller (ID 1093), clumpy galaxies, with clumps of similar sizes (9 gal., see Fig 4) or with a central bulge and smaller clumps (ID 910, ID 2043), or as clumps/bulges with large tidal tails (ID 2635, ID 1794). This confirms that galaxies in groups are going through transformations, driven in part by wet/blue late–type mergers, or smaller companion. Most of them show clumpiness, with clumps of similar sizes. These transformations are rarely seen in Lynx W (1), while Lynx E shows three clumpy galaxies.
These observations indicate that wet merger activity is present both clusters and groups and dry merger activity is only present in the two clusters. Clearly though, since we are studying a single supercluster, these results are not statistically significant (as in the case of other work at these high redshifts) and should be confirmed by larger statistical samples of superclusters of galaxies at these redshifts, unfortunately unavailable at this time (e.g. at present, this is the best we can do).
In Fig 6, we show the spatial distribution of our selected sample, the morphological types and the red – – overdensities in the clusters and the groups. Group 1 is very close to Lynx W, and its galaxies are connected by a FoF algorithm. We consider them as two separate structures, nevertheless, because the center of the group lies at from the center of the cluster and extends to , with an area of very low density between and 1 . It might be close to merging, or in the merger process. High resolution X–ray imaging would give us more elements to understand the nature of their interaction.
4.2 Structural parameters, color and magnitude measurement
We derived galaxy structural parameters using GALFIT (Peng et al. 2002) in the ACS imaging, fitting elliptical Sersic models to each galaxy image. With respect to our previous work (e.g. Mei et al. 2009), in this work we did not constrain the values of the Sersic index for most of the sample, as suggested in Peng et al. (2002). Only the five galaxies found in double or triplets in the clusters required simultaneous fitting and a constraint in order for the fit to converge. For each galaxy, we obtain its ellipticity (defined as 1-, where is the axial ratio), its average half-light radius , and Sersic index . In Fig. 7, we plot size as a function of the Sersic index for our different morphological types. While most galaxies have Sersic index , for some the fit converged to higher values of . In these latter cases, we do not see any evidence for a bias in size estimation. To see if there is a bias in size estimation, e.g. a correlation between and , we calculate Pearson coefficients and the probability of correlation between these two variables. We obtained a probability of correlation and a probability to have a random distribution , for both the entire sample and for the early and late–type populations separately.
We measured galaxy colors following Mei et al. (2006a,b; see also Blakeslee et al. 2006). Our colors were measured inside a circular aperture scaled by the galaxy average half-light radius (van Dokkum et al. 1998, 2000; Scodeggio 2001), to avoid galaxy gradient effects.
For early-type galaxies, we have checked (Mei et al. 2006a) that our colors do not change (within the uncertainties) if the effective radii are calculated via a two component (Sersic bulge + exponential disk) surface brightness decomposition technique using GIM2D (Marleau & Simard 1998; Rettura et al. 2006) that better fits the galaxy light profiles. For late-type galaxies, we used a single profile decomposition, so that their aperture radius would be larger than their bulge, but this doesn’t take into account the extension of their disk. For early-type spirals (Sas), this value is very close to their bulge size.
We estimate uncertainties on the color by adding the uncertainty due to flat fielding, PSF variations, and ACS pixel–to–pixel correlations in quadrature to the flux uncertainties (Sirianni et al. 2005). Our average color uncertainties range from 0.01 to 0.03 mag.
As an estimate of galaxy total magnitude, we used SExtractor’s MAGAUTO. This quantity is not a perfect estimator (see discussion in Mei et al. 2009, and references therein), which must be borne in mind when comparing to other samples.
5 Results
5.1 Morphology–density relation
Morphology–density relations in the Lynx clusters and groups, as derived from our visual morphological classification, are shown in Fig. 8 and Fig. 9. Here, we have counted early–type mergers as early–type, and late–type mergers or unknown morphologies as late–type. Projected densities were estimated following Postman et al. (2005). We used a seven nearest neighbor algorithm with a . To correct for background contamination, we subtract from galaxy type counts an estimated number of non-cluster members, as (see Postman et al. Appendix B for details). is the total number of galaxies in a density bin, the total number of contaminants, estimated from our spectroscopic sample with the new photometric redshifts, and as the contamination rate expected for each morphological class.
Fig. 8 shows the visual early (E, S0) and late–type fractions. In the two clusters, the early–type fraction increases with density, as expected in galaxy clusters. However the early–type fraction in the two Lynx clusters never increases beyond , as compared to the observed in massive clusters at (Postman et al. 2005). In the top panel of Fig. 8, we show Postman et al. (2005) results for the entire seven cluster sample from the ACS IRCS. Compared to the entire sample, the early fraction in the Lynx clusters shows a further lack of early–type galaxies, with a confidence of . This is mainly due to a strong presence of late–type galaxies in the Lynx W sample. Note that Lynx W was not used in the Postman et al. (2005) analysis.
The group populations are dominated by late–type galaxies, with the fraction of early–types never exceeding of the sample, a fraction consistent with that in the two Lynx clusters in regions of the same density as the groups, and similar to field fractions at these redshifts (e.g. Fig. 9 in Postman et al. 2005). Part of this is due to an overdensity of late–type galaxies in Group 1 (see Fig. 6, top right of Group 1). We have verified that galaxy fractions don’t change significantly even when this overdensity is excluded from the analysis, with early–type fractions remaining close to .
Since we cannot exclude that diffuse features around Sa galaxies might be tidal structures or merger remnants (instead of a disk), we estimated fractions of what we call bulge–dominated galaxies (hereafter BDGs): visual early–type galaxies, Es and S0s, plus BDS (BDS are the visual Sas by definition). In this way we want to verify if, when added to the early–type galaxies, the galaxies that we classify as Sas might be the galaxies we are missing when counting only early–type galaxies. In Fig. 9, we show the fraction of BDGs and later–type (e.g. not counting the Sas) galaxies. When the entire BDG population is shown, its fraction in the clusters increases to that expected from the entire Postman et al. (2005) sample. In the groups, BDG fractions contribute at , more consistent with ETG fractions observed in groups at these redshifts (e.g. Poggianti et al. 2009; Just et al. 2010).
As observed in Mei et al. (2009), such a high fraction of BDS not observed in the other clusters of the ACS IRCS. A similar evolution of early–type spirals is found in the COSMOS field (Bundy et al. 2010), where this population increases at for galaxies with masses similar to those of our sample. Since the fraction of early to late–type galaxies changes between these two clusters and clusters at , while the number of BDG does not, as pointed out in Mei et al. (2009), these populations, whether they are spiral or early–type galaxies with tidal features or merger remnants, could eventually evolve into the ETG morphologies as we observe them at . We might speculate that a similar evolution might have occurred in the groups, but with the small statistics we have, we are unable to address this question.
5.2 The color-magnitude relation in groups and clusters
The color–magnitude relations (CMRs) for the clusters and groups are shown in Fig. 10. Two of the bright spirals in the clusters are spectroscopically confirmed, the brightest is in the very center of the Lynx E. The fits to the red sequence have been performed as in Mei et al. (2009) for different early–type populations in the clusters and the groups. We fit three parameters: the zero point, slope and scatter around the red sequence:
| (1) |
The CMR was fit using a robust linear fit based on Bisquare weights (Tukey’s biweight; Press et al. 1992), and the uncertainties on the fit coefficients were obtained by bootstrapping on 1,000 simulations. The scatter around the fit was estimated from a biweight scale estimator (Beers, Flynn & Gebhardt 1990) that is insensitive to outliers in the same set of bootstrap simulations. A linear, least–squares fit with three-sigma clipping and standard RMS scatter gives similar results to the biweight scale estimator within 0.001-0.002 mag for the slope and the scatter.
To estimate the intrinsic galaxy scatter (i.e., not due to galaxy color measurement uncertainties), we estimated the additional scatter needed beyond the measurement error to make the observed per degree of freedom of the fit equal to one. Again, the uncertainty on the internal scatter was calculated by bootstrapping on 1,000 simulations.
Our results are given in Table 2 and Table 3, for all cluster and group selected galaxies and for the galaxies within one virial radius, respectively. The continuous lines in Fig. 10 show the fit to the cluster elliptical red sequence within one virial radius. The dashed lines show the fit and the 3 scatter around the elliptical red sequence in the groups, within one virial radius. For the group ETG red sequence, we found lower zero points (at ), and larger scatters, both indicating a younger galaxy population (e.g., Kodama & Arimoto 1997; Kauffman & Charlot 1998; Bernardi et al. 2005; Gallazzi et al. 2006).
To quantify these differences, we use predictions from stellar population models (e.g. Mei et al. 2009). In Paper II, we demonstrated that galaxy age and mass predictions change significantly for galaxies with ages around 1-2 Gyrs, when using stellar population models in which the contribution of the thermally pulsing asymptotic giant branch (TP-AGB) phase is better modeled (Maraston 2005 - M05; Charlot & Bruzual 2007-CB07 ). Since Lynx galaxies lie at an epoch in which the Universe is 5 Gyrs old, and we have shown the early-type galaxies to have formation epochs between 1-4 Gyrs (Paper II and III), it is important that we quantify differences in ages with both BC03 and models with a better accounting of the TP-AGB, in order to test the stability of our results.
Using simple BC03 and CB07 (similar to MA05) stellar population models, we find similar results. As in Mei et al. (2009), we consider three models: 1) a simple, single burst solar metallicity CB07 stellar population model; 2) a model with solar metallicity and constant star formation rate over a time interval to , randomly chosen to lie between the age of the cluster and the recombination epoch; 3) a model with solar metallicity and with an exponentially decaying star formation rate. Models (1), (2) and (3) yield similar results, as already noted in Mei et al. (2009).
With both the single burst and the constant star formation rate model, we find the average luminosity-weighted age for ellipticals and ETGs in the groups to be Gyr younger than the cluster ellipticals, similar to peripheral ellipticals, and S0 galaxies in the two clusters (Mei et al. 2009). A model with solar metallicity and an exponentially decaying star formation rate, however, predicts that if galaxies with larger scatters had a different star formation history (exponential decay versus single burst), they would have an average luminosity-weighted age similar to the cluster ellipticals. This scenario also predicts bluer color residuals, as observed in our groups.
Galaxies in the groups have then either formed in a short episode of star formation (approximated here as a single burst) later than galaxies in the clusters, or formed at the same time, but following a star formation history with longer timescales. Fitting galaxy spectral energy distributions in Paper II, we studied galaxy ages and masses in detail, and showed that discriminating between these two hypotheses depends on the adopted stellar population model (see Fig. 9 of that paper). Using M05 and CB07, we find older populations in the two clusters with respect to the groups and the field, in agreement with results from the CMR. In Paper III, we show how, using BC03 models, we obtain different exponential decaying times in the clusters and the field.
A difference between the age in groups and clusters, if it exists, is small when compared to the differences in age in galaxies of different masses in the same sample, as pointed out and discussed in Paper II.
The double and triple bulge mergers observed in the clusters all lie on the red sequence, and involve galaxies with luminosity larger than the characteristic ( mag at z; Mei et al. 2006b). We do not observe red bulge mergers in the groups. Moreover, 4 disturbed objects are observed in the clusters, and 9 in the groups. Only 4 (1 in the clusters, 3 in the groups) of these objects lie on the red sequence (they show clumps, irregular structure and are probably reddened by dust), and their luminosity is equally distributed to high and low luminosities.
Luminous red bulge mergers occur in clusters, while both the clusters and the groups show disturbed objects that indicate late–type interactions at all luminosities, and mainly in the blue cloud. These disturbed objects show late–type merging, tidal features and complex morphology that suggest a higher incidence of galaxy transformations in the groups, in terms of mergers and other galaxy interactions, mainly happening in the blue cloud. The 4 disturbed objects in the cluster are not all in peripheral regions, but lie mostly at around half of the virial radius.
BDGs have mostly red colors, e.g. they tend to lie on the red sequence. While their red colors might indicate a lack of star formation, it could be also hidden by the presence of dust. We estimated their star formation rate using galaxy spectral energy distribution (SED) fitting, following our procedure as described in Paper II. On the red sequence, their star formation rates are always estimated at less than and , in the clusters and the groups, respectively. One BDG in Lynx W has a star formation rate of and lies at (bluer) than the best fit to the ETG red sequence. In the groups, two BDGs have star formation rates , and both lie at (bluer) than the best fit to the ETG red sequence, and one BDG has star formation rate of and lies at (bluer) than the best fit to the ETG red sequence. BDGs are therefore mostly passive.
In Fig. 11, we plot colors as a function of stellar mass, and can define a mass–limited sample. Galaxy stellar masses were derived by galaxy SED fitting, as described in Paper II, using templates from the three different stellar population models: BC03, M05, CB07.
As expected, galaxies with the same luminosity range in the color–magnitude diagram have different masses, since the mass–to–light ratio differs between quiescent and star forming galaxies. As discussed in Paper II, ranges in mass are different because we are using different stellar population models: the BC03 model overestimates masses and ages to account for the missing light from the TP-AGB phase (see Paper II for a detailed analysis at our redshift, and MA05).
If we define mass–limited samples, some of the spiral galaxies that were previously included in the luminosity limited sample are now excluded. If we use as a conservative lower mass limit in our early–type sample , 30% (44%/57%) of the spirals have lower masses when using BC03 (MA05/CB07). At a mass limit of , 20% (30%/39%) of the spirals have lower masses when using BC03 (MA05/CB07).
5.3 Morphological content of the red sequence
The morphological content of the red sequence is shown in Fig. 12. On the left, we compare early to late–type fractions in the clusters and groups. On the right, we show the BDG to later–type spiral fraction on the red sequence. As pointed out when analyzing total fractions, ETG fractions on the red sequence are low in the two Lynx clusters when compared to average ETG fractions observed in the other ACS Intermediate Cluster survey clusters at (see also Mei et al. 2009). The red sequence in the groups is dominated by late–type galaxies.
Comparing the fraction of BDG and later–type spirals, the BDG fraction is close to the fraction of ETG observed in the other clusters at , and the groups show results consistent with the ETG fractions in clusters at the same projected density and group fractions at (George et al., 2011). The BDS population in both clusters and groups seems to compensate for the lack of an early–type population. This suggests that at , they might evolve into the early–type population on the red sequence, or that they will leave the red sequence later in time.
5.4 Morphological fractions in a mass limited sample
Fig. 13 shows early and late-galaxy fractions in a mass–limited sample. We selected galaxies with , to be conservative with respect to the completeness of our ETG sample. The uncertainties on morphological fractions are calculated following Gehrels (1986; see Section 3 for binomial statistics; see also Mei et al. 2009). These approximations apply even when ratios of different events are calculated from small numbers, and yield the lower and upper limits of a binomial distribution within the 84% confidence limit, corresponding to 1.
In the mass–limited sample, we observe the same trends as in the luminosity-limited sample: the fraction of ETGs is lower than that observed in the rest of the ACS IRCS. BDG fractions, though, show once again fractions that are similar to those of ETGs in the ACS IRCS. Considering galaxies with , , and projected density larger than a given , we obtain the total early-type/BDG fractions as given in Table 4.
Holden et al. (2007) show that in mass–limited samples, early-type fractions can change dramatically with respect to those in luminosity–selected samples (e.g. while in both elliptical fractions do not show significant evolution, in luminosity selected samples S0s show evolution). In fact, their work demonstrates that the early-type fraction of galaxies with does not evolve from z=0.83 to the present (opposite to the evolution shown by the luminosity–selected cluster samples from e.g. Postman et al. 2005, Desai et al. 2007, Poggianti et al. 2009). At z=0.83, they report a fraction of for ETGs in regions of density , at that mass limit.
Fig. 14, compares our results to Holden et al. (2007). In the Lynx clusters, we do observe a lack of ETGs in our mass–limited sample, selected in a manner similar to Holden et al. (2007), with an early-type fraction of independent of the stellar population model used for mass estimation. However, when estimating the BDG fraction, we obtain , consistent with the ETG fraction found from Holden et al. (2007) at z=0.83.
These results are consistent with a lack of a significant evolution in the fractions of ETGs with masses . We obtain similar results for a mass limit of . We expect our photometric redshift sample to be contaminated at . Even in the extreme case in which all early–types are real cluster members (i.e., no contamination), and of the spirals are not, we would obtain fractions of , and , for the cluster ETGs and bulges, respectively.
5.5 Galaxy sizes for different morphological types
The analysis of evolution in morphological fractions has led us to the hypothesis that at z1.3, we observe a BDS population that, losing their disk (or merger remnants or tidal features if these galaxies are not spirals but merger remnants or ETG with tidal features), might have evolved into an ETG population, to obtain the ETG fraction observed in clusters at .
In this scenario, we should also observe a similarity in galaxy size between BDS and ETG galaxies. As we discuss in depth in Paper IV, while field ETGs at , selected from the GOODS-CDFS, show a distribution in sizes similar to the local cluster distribution (notice this might be different than the field local distribution, we will discuss further this point in future work), Lynx cluster ETGs are more compact than local galaxies at a given mass (refer to Paper IV for the quantitative analysis). These results, consistent with recent results from Valentinuzzi et al. (2010), lead us to conclude that, while we do not need an evolution in the overall mass–size relation for field ETGs, cluster ETGs require an evolution of their mass–size distribution from to the present. As mechanisms of evolution, we propose that either part of the cluster ETGs become larger with time and/or arise from transformations of cluster late–type population (non–ETG progenitors), and/or a new population of larger ETGs is accreted onto the cluster.
In this paper, we explore late–type sizes to understand if part of the larger ETG local population might have evolved from BDS. In Fig. 15, we plot the mass–size relation for our cluster and group sample, compared to the standard SDSS local relation from Shen et al. (2003). In this figure (and hereafter) we use stellar masses derived with CB07. Our results are the same when using masses derived with BC03 and MA05. Shen et al. (2003) use as morphological classification a simple separation in Sersic index or compactness. We plot their local relation for early () and late () galaxies and compare to our results using exactly the same classification (see Fig. 5 and Fig. 7) (notice that here we are not using our visual morphological classification as in all other analysis in this paper). We find that neither galaxies in the clusters nor in the groups show evolution in the overall mass–size relation. The mass–size relation in the Lynx superstructure is similar to the Shen et al. (2003) mass–size relation.
However, a simple morphological classification based on one structural parameter is highly contaminated by a mixing of different morphologies, as shown in Section 4, and does not correspond to a visual morphological classification. In Fig. 16, we therefore compare galaxies separated into our visual morphological classes (as used in the other analysis in this paper). As a local sample, we use the morphological classified sample from Valentinuzzi et al. (2010), corrected for masses estimated with a Salpeter IMF.
When a visual morphological classification is used at both high and low redshift, ETGs in both clusters and groups show a size distribution more compact than ETGs in the local sample (see Paper IV for a detailed analysis of the ETG Kormendy and mass–size relations in our sample), while spirals do not show evolution in their overall mass–size relation (when their sizes are estimated by a single Sersic fit).
While our Lynx galaxies do lie within 3 from the average Valentinuzzi et al. (2010) mass–size relation, at a given mass, the two gaussian distributions are statistically different for masses which dominate our sample. Using results from Table 1 of Paper IV, and a Kolmogorov-Smirnov and Kuiper statistical test for galaxies with masses , from all three stellar population models, we obtain a probability close to zero that the Valentinuzzi et al. (2010) Gaussian distribution and ours are driven by the same distribution. In the analysis of the ETGs in Paper IV, we concluded that to obtain the local ETG mass–size distribution, the ETG population in clusters and groups must have either accreted larger ETGs, or formed new ones from non-ETG progenitors or have gone through transformations that enlarged their own size, e.g. by minor dry mergers (Naab et al. 2009, Shankar et al. 2011), or stellar winds and/or quasar feedback (Fan et al. 2008).
Most of our Sas do show larger sizes than ETGs, and their size distribution is in agreement with the hypothesis that (at least part of) this population would transform into early–types (even if this does not demonstrate that they will). This new population might enlarge the ETG mass–size distribution and reproduce that observed in the local sample. Larger samples are needed to understand the relative importance of this possible transformation with respect to the accretion of larger galaxies and galaxy–galaxy transformations (major/minor–dry/wet mergers and tidal interactions).
6 Discussion and conclusions
We have examined galaxy color and morphology in the clusters and the groups of the Lynx supercluster at . Our primary aim is to identify galaxy properties and their transformation in the cluster and group environment at redshifts where typical clusters are still being assembled.
We confirm the detection of three groups in the Lynx supercluster (Nakata et al. 2005), by XMM Newton X-ray imaging and spectroscopic follow–up at Subaru, Keck and Gemini telescopes. From XMM Newton X–ray imaging, we detect Group 3 at 2.6 and Group 2 at 1.6 . Group 1 shows a 0.5 excess, and there is 2 excess of the X-ray emission close to it. From the X-ray emission and scaling relations (Markevitch et al. 1998) we obtain a mass estimate for Groups 2 and 3 of and , respectively, and a 95% upper limit for the mass of Group 1 at . From our spectroscopic runs in the groups, we obtained redshifts for the three confirmed groups: (Group 1; from 9 members), (Group 2; from 7 members), (Group 3; from 9 members).
These measurements confirm that these three groups are at the same redshifts as Lynx E and Lynx W, the central clusters of the Lynx supercluster (see the Introduction). Group 1 is very close to Lynx W, and their galaxies are connected by a FoF algorithm. We consider the group as a separate structure, however, because its center lies at from the center of the cluster and extends to , with an area of very low density between and 1 . The group might be close to merging, or in the merger process. Our present XMM imaging does not permit us to detail this interaction.
We classify galaxies in the groups as early–type (E, S0; ETG), late–type (Sa, Sb and Sc), irregular and disturbed (possible mergers, tidal features), using the same visual classification as used for the two main clusters by Postman et al. (2005). We compare our visual classification to automated methods. We show that if we would have used the log(A) vs log(C) plane or the Sersic index to separate early from late–type galaxies, our ETG sample would have been contaminated (especially by compact bulge–dominated spirals, Sas) at the 30% and 40% level, respectively (see also Capak et al. (2007)). More sophisticated automated classification (Huertas–Company et al. 2008, 2009, 2011) show only a 5% contamination.
From the analysis of cluster and group galaxy morphologies and colors, we find that while the color–magnitude relation is already in place, this supercluster shows high fractions of red, bulge–dominated spirals (BDS). We classify BDS as Sa galaxies, e.g., spirals with large bulges but with a clearly visible diffuse component that we identify as a disk but that might also be due to merger remnants and tidal features.
From analysis of the cluster and group color–magnitude relation, we found lower zero points (e.g., bluer average colors), and larger intrinsic scatters in the ETG CMR for the groups, both indicating a younger galaxy population or more complex star formation histories with respect to the cluster ellipticals (e.g. Mei et al. 2006ab, 2009). We quantified this difference in age/star formation history with simple stellar population models, and found the average luminosity-weighted age of ellipticals in the groups to be Gyr younger than cluster ellipticals. This difference in age is similar to that between the cluster core population and the peripheral ellipticals and S0s in the two clusters (Mei et al. 2009).
Our ETG sizes, ages and star formation histories are analyzed in detail in three companion papers. In Paper II, we study cluster and group ETG formation epochs as a function of stellar mass and compare them to the field. In Paper III, we compare ETG ages and star formation histories in the two main clusters and the field. Paper IV examines the ETG Kormendy and mass–size relations. In Paper II and Paper III, we study galaxy stellar populations in detail. We find that the dependence of age on mass (older galaxies are the most massive) is more important than the dependence of age on environment (Paper II). Star formation histories in the clusters are less extended than in the field (Paper III). We also show (Paper II) the importance of understanding limitations of stellar population models when interpreting results.
We find that the early–type fraction increases with the density in the two clusters, as in other galaxy clusters at this redshift (e.g. Postman et al. 2005). However, the ETG fraction in the two Lynx clusters never rises above , as compared to the observed in the other massive clusters at (Postman et al. 2005; Smith et al. 2005; Desai et al. 2007). In the groups, ETG fractions never exceed , consistent with cluster fractions at the same densities and field fractions at the same redshift (Postman et al. 2005), and lower than what has been observed in groups (Poggianti et al. 2009; Just et al. 2010)
This lack of ETGs is compensated by the large number of red early spirals, the Sas. When we measure the bulge fractions (E+S0+Sa), we obtain fractions similar to those observed for ETGs in clusters at . Within (the same region used by Poggianti et al. 2010), our cluster and group ETG fractions are % and %, respectively, while BDG fractions are % and %, respectively.
When selecting our sample by mass, our results do not change. For galaxies with masses within , we find an ETG fraction of and in the clusters and groups, respectively, and independent of the stellar population model used for the mass estimation. However, when we estimate the BDG fraction in the two clusters we obtain .
We compare these results to the Holden et al. (2007) ETG fractions at z=0.83 and lower redshifts, where the galaxy selection was made in the same way in mass and by density regions. Our results show that the ETG and bulge fractions are still high at . We do not see a significant evolution of the ETG and the BDG fraction either overall, or on the red sequence, from to the present for galaxies with masses within . Our results do not change if we use as the mass limit.
As observed in Mei et al. (2009), a high fraction of BDS is not observed in the other clusters in the ACS IRCS. Since the fraction of ETG galaxies is changing between these two clusters and clusters at , but the BDG fraction does not, as we pointed out in Mei et al. (2009), this BDS population might be thought to eventually evolve into ETGs. Since BDS are also red and passive, they must have had, firstly, their star formation quenched and then subsequently experience a morphological transformation.
Recent results based on the COSMOS field (Bundy et al. 2010) show a similar trend: an increase of massive () ETGs and a decline of BDSs (in this case selected by their sersic index ) on the red sequence, from 1 to present. These authors deduced that at least of the BDSs were transformed into ETGs (e.g. S0s) on the scale of 1-3 Gyrs, and that these transformations might occur as a single major merger event or through multiple evolutionary stages, including disk disruption by minor mergers or accretion of cold gas in star–forming galaxies. These scales are similar to the time scales of a few Gyrs derived from measurements of the S0 velocity dispersions in clusters (e.g. Moran et al. 2007).
The transformation of spirals into S0s has been largely discussed in the literature (Bekki et a. 2002; Christlein et al. 2004; Postman et al. 2005; Poggianti et al. 2009,2010; Wilman et al. 2009; Bekki & Couch 2011). The most studied idea is that as they are accreted into galaxy clusters, spirals lose their disks and become early–type galaxies. This hypothesis is difficult to reconcile with the bulge luminosity of local cluster late–type galaxies (Christlein et al. 2004).
The BDS that we observe, though, have luminous bulges and show an interesting mass–size relation. To test the hypothesis that ETGs might have been formed from these progenitors, we estimated the mass–size relation for our entire sample and compared it to the local relation from the SDSS. We do so by comparing, on the one hand, samples selected by Sersic index, and on the other hand, samples selected based on visual morphology. Our results differ in the two cases. If we would have used a simple separation of early from late–type, identifying ETGs as galaxies with a Sersic index , the two classes would have lied on the local mass–size relations of galaxies selected in the same way in the SDSS. Samples of galaxies selected on their Sersic index do not show evolution in their mass–size relation.
A simple morphological classification based on one structural parameter is, however, highly contaminated by a mixing of different morphologies, with compact spirals (mainly Sas) being identified as ETGs (see Section 4). In the second case, we compare our sample to the SDSS sample, using in both cases a visual (or in case of the SDSS, trained on visual) morphological classification. As we discuss in depth in Paper IV, we find that Lynx cluster ETGs are more compact than local galaxies at a given mass (see also different results from Cooper et al. 2012 and Papovich et al. 2012). We show in this paper that spirals, however, lie on the local mass–size relation. We conclude in Paper IV that to obtain the local mass–size distribution, galaxies in clusters and groups must have either accreted larger ETGs or have gone through transformations that enlarged their own size (e.g. Fan et al. 2008; Naab et al. 2009; Shankar et al. 2011), or have formed ETGs from later type progenitors.
Most of our Sa galaxies do show larger sizes than ETGs, and their size distribution is in agreement with the hypothesis that if (at least part of) this population transformed into early–types, this would enlarge the ETG size distribution and reproduce that observed in the local sample. Larger samples are needed to understand the relative importance of this transformation with respect to the accretion of larger ETGs from the field, the role of dry/wet minor mergers, wet major mergers or strangulation of later type progenitors.
Since we do not have dynamical data for those Sa galaxies, we cannot exclude the hypothesis that the diffuse component we observe and visually identify as a disk, might be tidal structures or merger remnants that will fade with time. A detailed dynamical analysis of the Sa sample would help in understanding the disk nature of the diffuse component that we observe.
Compared to field samples, Paper IV have shown that field ETGs at and with similar mass limits to the present sample, show a mass–size relation in agreement with the local relation. Cassata et al. (2011) have shown that, in the field, ETGs enlarge their size and increase their stellar mass by a factor of 5 between and 1. At z, field galaxies are already on the local mass–size relation, while cluster ETGs are about twice as compact on average, indicating that their size distribution will increase (see also Strazzullo et al. 2011 for a similar results at z=1.4, but also Papovich et al. 2012 for a different point of view, perhaps because our sample selections are different).
At the redshift of the Lynx supercluster, models predict that environmental effects should not yet be predominant (e.g. McGee et al. 2009). We are observing clusters before they accrete a significant number of field and group galaxies and groups before they infall into clusters. Our cluster population should be a pristine population at , before a significant fraction of group and field galaxies is accreted onto clusters.
Our results show a cluster population with high percentages of BDS or bulges with a significant diffuse component (tidal structures/merger remnants; see above) that could evolve into ETGs. When we consider the fraction of this population together with the current cluster ETG population, we obtain BDG fractions that are in agreement with local BDG fractions. If these objects do transform into ETGs (e.g. S0 galaxies), the pristine ETG cluster population will not need to accrete and transform additional spirals to reach an ETG population consistent with the local population. From the observed double and triple red merger, some (we observe a few) of those red ETGs will merge to build more massive ETGs. Our results then suggest that, at these redshifts, the spiral galaxies that transform into S0s (see e.g. Postman et al. 2005, Desai et al. 2007, Poggianti et al. 2010) are mainly Sas.
The groups will eventually be accreted onto the the main clusters to form a single more massive structure (with a mass typical of clusters in the local Universe). Our groups show pre–processing in terms of wet similar–size mergers, the presence of small companions in two galaxies, and tidal tails and clumpy morphologies in % of the sample. Group BDG fractions are around %. If we assume pre–processing in groups in terms of transformation of bulge–dominated spirals into ETGs, we would need part of the disturbed morphologies to be also transformed into ETGs for the group accretions to not significantly change the total ETG fractions in clusters, as observed at lower redshift. From our sample, it appears that simple transformations of BDGs into ETGs would be in agreement with the mild evolution found for galaxies with masses within up to . Further morphological transformations that would significantly change (e.g. at %) the ETG fraction should happen at lower masses and/or at lower densities.
From the analysis of the group red sequence, group ETGs also show red sequence zero point and scatter that are consistent with those of peripheral ellipticals and S0 galaxies in clusters at (Mei et al. 2009).
7 Summary
Our work aimed to confirm the detection of groups in the Lynx supercluster, and study galaxy morphology and stellar population at a time when typical clusters are being assembled.
Our main results are the following:
-
•
With XMM Newton imaging and spectroscopic follow-up at Subaru, Keck and Gemini telescopes, we confirm the detection of three groups around the two Lynx clusters, RX J0849+4452 and RX J0848+4453 at redshift (Group 1), (Group 2), and (Group 3). The estimated group masses are (Group 1), (Group 2), and (Group 3).
-
•
We morphologically classify galaxies by visual inspection. Our early–type galaxy (ETG) sample would have been contaminated at the 30% –40% level by simple automated classification methods. We observe wet mergers in both clusters and groups, and dry mergers only in clusters.
-
•
The Lynx supercluster shows low fractions of ETGs (when compared to other clusters at similar redshift). This lack of ETGs is compensated by high fractions of red, bulge–dominated spirals (BDS). These objects have large bulges and a diffuse disk component that shows features similar to arms. These features might also be due merger remnants and/or tidal features. Since the fraction of ETG galaxies changes between the Lynx clusters and clusters at , but the BDG fraction does not (Mei et al. 2009), this might be evidence that the BDS population will eventually evolve into ETGs (see also Bundy et al. 2010). BDS are also red and passive: if these transformations will happen at later time, BDS must have had, firstly, their star formation quenched and then subsequently experience a morphological transformation. Some of these BDS are observed in dry mergers. If these objects do transform into ETGs (e.g. S0 galaxies), the pristine ETG cluster population will not need to accrete and transform additional spirals to reach an ETG population consistent with the local population. Our results then suggest that, at these redshifts, the spiral galaxies that transform into S0s (see e.g. Postman et al. 2005, Desai et al. 2007, Poggianti et al. 2010) are mainly Sas.
-
•
In the Lynx clusters, the ETG fraction of galaxies with masses within do not show evolution from to the present. Our results do not change if we use as the mass limit. This confirms the results to the Holden et al. (2007) for the evolution of ETG fractions up to z=0.83
-
•
We studied the cluster and group color–magnitude relation (CMR). The CMR is already in place in both environments. We find lower zero points (e.g., bluer average colors), and larger intrinsic scatters in the ETG CMR for the groups. Using simple stellar population models, we find that this difference corresponds to average luminosity-weighted ages of ellipticals in the groups to be Gyr younger than cluster ellipticals. This result is consistent with the analysis of the galaxy SEDs in Raichoor et al. (2011) and Rettura et al. (2011). However, the dependence of age on mass is more important than the dependence of age on environment (Raichoor et al. 2011).
-
•
We study the mass–size relation for galaxy samples selected using their Sersic index and visual morphology. When using the Sersic index, our results do not show an evolution of the galaxy mass-size relation, while when using visual morphology, at a given mass the ETG sizes are smaller than local cluster galaxies (see also Raichoor et al. 2012). Our result shows that galaxy samples that are morphologically selected as early based on Sersic index are highly contaminated by a mixing of different visual morphologies and can lead to biases in results on the mass–size relation evolution. The spiral galaxy mass–size relation do not show significant evolution. At a given mass, BDS show a large range of sizes, that span both the spiral and ETG sizes. Most BDS show large sizes though, and their size distribution is in agreement with the hypothesis that if (at least part of) this population transformed into ETGs, it would enlarge the ETG size distribution and reproduce the ETG mass–size relation observed in the local sample.
References
- Abraham, Valdes, Yee, & van den Bergh (1994) Abraham, R. G., Valdes, F., Yee, H. K. C., & van den Bergh, S. 1994, ApJ, 432, 75
- Arnouts et al. (2002) Arnouts, S., et al. 2002, MNRAS, 329, 355
- Beers, Flynn, & Gebhardt (1990) Beers, T. C., Flynn, K., & Gebhardt, K. 1990, AJ, 100, 32
- Bekki et al. (2002) Bekki, K., Couch, W. J., & Shioya, Y. 2002, ApJ, 577, 651
- Bekki & Couch (2011) Bekki, K., & Couch, W. J. 2011, MNRAS, 415, 1783
- Bernardi et al. (2005) Bernardi, M., Sheth, R. K., Nichol, R. C., Schneider, D. P., Brinkmann, J. 2005, MNRAS, 129, 61
- Bernardi et al. (2010) Bernardi, M., Shankar, F., Hyde, J. B., Mei, S., Marulli, F., & Sheth, R. K. 2010, MNRAS, 404, 2087
- Bertin, E. & Arnouts (1996) Bertin, E. & Arnouts, S. 1996, A&AS, 117, 393
- Bielby et al. (2010) Bielby, R. M., et al. 2010, A&A, 523, A66
- Blakeslee et al. (2003) Blakeslee, J.P., Franx, M., Postman, M. et al. 2003a, ApJL, 596, 143
- Blakeslee et al. (2003) Blakeslee, J. P., Anderson, K. R., Meurer, G. R., Benítez, N., & Magee, D. 2003b, ASP Conf. Ser. 295: ADASS XII, 257
- Boselli & Gavazzi (2006) Boselli, A., & Gavazzi, G. 2006, PASP, 118, 517
- Bruzual A. & Charlot (2003) Bruzual A., G. & Charlot, S. 2003, MNRAS, 344, 1000 (BC03)
- Bundy et al. (2010) Bundy, K., et al. 2010, ApJ, 719, 1969
- Calzetti et al. (2000) Calzetti, D., Armus, L., Bohlin, R. C., Kinney, A. L., Koornneef, J., & Storchi-Bergmann, T. 2000, ApJ, 533, 682
- Capak et al. (2007) Capak, P., Abraham, R. G., Ellis, R. S., Mobasher, B., Scoville, N., Sheth, K., & Koekemoer, A. 2007, ApJS, 172, 284
- Careberg (1997) Calberg et al. 1997, ApJ, 478, 462
- Cassata et al. (2011) Cassata, P., et al. 2011, ApJ, 743, 96
- Conselice et al. (2000) Conselice, C. J., Bershady, M. A., & Jangren, A. 2000, ApJ, 529, 886
- Cooper et al. (2012) Cooper, M. C., Griffith, R. L., Newman, J. A., et al. 2012, MNRAS, 419, 3018
- De Lucia et al. (2006) De Lucia, G., Springel, V., White, S. D. M., Croton, D., & Kauffmann, G. 2006, MNRAS, 366, 499
- Desai et al. (2007) Desai, V., et al. 2007, ApJ, 660, 1151
- Diaferio et al. (2001) Diaferio, A., Kauffmann, G., Balogh, M. L., White, S. D. M., Schade, D., & Ellingson, E. 2001, MNRAS, 323, 999
- Elston (1998) Elston, R. 1998, Proc. SPIE, 3354, 404
- Ettori et al. (2004) Ettori, S. et al. 2004, MNRAS, 417, 13
- Faber et al. (2007) Faber, S. M., et al. 2007, ApJ, 665, 265
- Fan et al. (2008) Fan, L., Lapi, A., De Zotti, G., & Danese, L. 2008, ApJ, 689, L101
- Fazio et al. (1998) Fazio, G. G., et al. 1998, Proc. SPIE, 3354, 1024
- Finoguenov et al. (2007) Finoguenov, A., et al. 2007, ApJS, 172, 182
- Gal et al. (2008) Gal, R. R., Lemaux, B. C., Lubin, L. M., Kocevski, D., & Squires, G. K. 2008, ApJ, 684, 933
- Gallazzi et al. (2007) Gallazzi, A., Charlot, S., Brinchmann, J., White, S.D.M. 2006, MNRAS, 370, 1106
- Gehrels, N. 2006, ApJ, 303, (336) Gehrels, N. 2006,ApJ, 303, 336
- Geller & Huchra (1983) Geller, M. J., & Huchra, J. P. 1983, ApJS, 52, 61
- George et al. (2011) George, M. et al. 2011, ApJ, 742, 125
- Gobat et al. (2011) Gobat, R., et al. 2011, A&A, 526, A133
- Holden et al. (2001) Holden, B. P., et al. 2001, AJ, 122, 629
- Holden et al. (2007) Holden, B. P., et al. 2007, ApJ, 670, 190
- Huertas-Company et al. (2008) Huertas-Company, M., Rouan, D., Tasca, L., Soucail, G., & Le Fèvre, O. 2008, A&A, 478, 971
- Huertas-Company et al. (2009) Huertas-Company, M., Tasca, L., Rouan, D., et al. 2009, A&A, 497, 743
- Huertas-Company et al. (2011) Huertas-Company, M., Aguerri, J. A. L., Bernardi, M., Mei, S., & Sánchez Almeida, J. 2011, A&A, 525, A157
- Ilbert et al. (2006) Ilbert, O., et al. 2006, A&A, 457, 841
- Ilbert et al. (2010) Ilbert, O., et al. 2010, ApJ, 709, 644
- Jansen et al. (2001) Jansen, F., et al. 2001, A&A, 365, L1
- Jee et al. (2006) Jee, M. J., White, R. L., Ford, H. C., Illingworth, G. D., Blakeslee, J. P., Holden, B., & Mei, S. 2006, ApJ, 642, 720
- Just et al. (2010) Just, D. W., Zaritsky, D., Sand, D. J., Desai, V., & Rudnick, G. 2010, ApJ, 711, 192
- Kashikawa et al. (2002) Kashikawa, N., et al. 2002, PASJ, 54, 819
- Kauffman and Charlot (1998) Kauffman, G. & Charlot,S. 1998, MNRAS, 294, 705
- Kells et al. (1998) Kells, W., Dressler, A., Sivaramakrishnan, A., Carr, D., Koch, E., Epps, H., Hilyard, D., & Pardeilhan, G. 1998, PASP, 110, 1487
- Kirsch et al. (2004) Kirsch, M. G. F., et al. 2004, Proc. SPIE, 5165, 85
- Kodama and Arimoto (1997) Kodama, T. & Arimoto, N. 1997, AJ, 320, 41
- Komatsu et al. (2011) Komatsu et al. 2011, ApJS, 192, 18
- Kuntz & Snowden (2008) Kuntz, K. D., & Snowden, S. L. 2008, A&A, 478, 575
- Lubin et al. (2009) Lubin, L. M., Gal, R. R., Lemaux, B. C., Kocevski, D. D., & Squires, G. K. 2009, AJ, 137, 4867
- Maraston (2005) Maraston, C. 2005, MNRAS, 362, 799
- Markevitch et al. (1998) Markevitch, M., Forman, W. R., Sarazin, C. L., & Vikhlinin, A. 1998, ApJ, 503, 77
- Marleau & Simard (1998) Marleau, F.R. & Simard, L. 1998, ApJ, 507, 585
- McGee et al. (2009) McGee, S. L., Balogh, M. L., Bower, R. G., Font, A. S., & McCarthy, I. G. 2009, MNRAS, 400, 937
- Mei et al. (2006a) Mei, S. et al., 2006a, ApJ, 639, 81
- Mei et al. (2006b) Mei, S. et al., 2006b, ApJ, 644, 759
- Mei et al. (2009) Mei, S. et al., 2009, ApJ, 690, 42
- Menanteau et al. (2006) Menanteau, F. et al., 2006, AJ, 131, 208
- Moran et al. (2007) Moran, S. M., Ellis, R. S., Treu, T., Smith, G. P., Rich, R. M., & Smail, I. 2007, ApJ, 671, 1503
- Naab et al. (2009) Naab, T., Johansson, P. H., & Ostriker, J. P. 2009, ApJ, 699, L178
- Nakata et al. (2005) Nakata, F. et al. 2005, MNRAS, 357, 1357
- Oke et al. (1995) Oke, J. B., et al. 1995, PASP, 107, 375
- Papovich et al. (2011) Papovich, C., Bassett, R., Lotz, J. M., et al. 2011, arXiv:1110.3794
- Peng, Ho, Impey, & Rix (2002) Peng, C. Y., Ho, L. C., Impey, C. D., & Rix, H. 2002, AJ, 124, 266
- Poggianti et al. (2006) Poggianti, B. M., et al. 2006, ApJ, 642, 188
- Poggianti et al. (2009) Poggianti, B. M., et al. 2009, ApJ, 697, L137
- Poggianti et al. (2010) Poggianti, B. M., De Lucia, G., Varela, J., Aragon-Salamanca, A., Finn, R., Desai, V., von der Linden, A., & White, S. D. M. 2010, MNRAS, 405, 995
- Postman et al. (2005) Postman, M. et al., 2005, ApJ, 623, 721
- Press et al. (1992) Press, W.H. et al. 1992, Numerical Recipes, Cambridge University Press, New York
- Raichoor et al. (2011) Raichoor, A., et al. 2011, ApJ, 732, 12
- Raichoor et al. (2012) Raichoor, A., et al. 2012, ApJ, 745, 130
- Rettura et al. (2006) Rettura, A. et al., 2006, A&A, 458, 717
- Rettura et al. (2011) Rettura, A., et al. 2011, ApJ, 732, 94
- Rosati et al. (1999) Rosati, P., Stanford, S.A., Eisenhardt, P.R., Elston, R., Spinrad, H., Stern, D., Dey, A. 1999, ApJ, 118, 76
- Saxton et al. (2005) Saxton, R. D., Altieri, B., Read, A. M., Freyberg, M. J., Esquej, M. P., & Bermejo, D. 2005, Proc. SPIE, 5898, 73
- Shankar et al. (2011) Shankar, F., Marulli, F., Bernardi, M., Mei, S., Meert, A., & Vikram, V. 2011, arXiv:1105.6043
- Schlegel et al. (1998) Schlegel, D. J., Finkbeiner, D. P., & Davis, M. 1998, ApJ, 500, 525
- Scodeggio (2001) Scodeggio, M. 2001, AJ, 121, 241
- Shen et al. (2003) Shen, S., Mo, H. J., White, S. D. M., Blanton, M. R., Kauffmann, G., Voges, W., Brinkmann, J., & Csabai, I. 2003, MNRAS, 343, 978
- Smith et al. (2005) Smith, G.P. et al. 2005, ApJ, 620, 78
- Sirianni et al. (2005) Sirianni, M. et al. 2005, PASP, 117, 1049
- Stanford et al. (1997) Stanford, S. A., Elston, R., Eisenhardt, P. R., Spinrad, H., Stern, D., Dey, A. 1997, AJ, 114, 2232
- Stanford et al. (2001) Stanford, S. A., Holden, B., Rosati, P., Tozzi, P., Borgani, S., Eisenhardt, P. R., Spinrad, H. 2001, 552, 502
- Strazzullo et al. (2010) Strazzullo, V., et al. 2010, A&A, 524, A17
- Strüder et al. (2001) Strüder, L., et al. 2001, A&A, 365, L18
- Tanaka et al. (2007) Tanaka, M., Kodama, T., Kajisawa, M., Bower, R., Demarco, R., Finoguenov, A., Lidman, C., & Rosati, P. 2007, MNRAS, 377, 1206
- Tanaka et al. (2009) Tanaka, M., Lidman, C., Bower, R. G., Demarco, R., Finoguenov, A., Kodama, T., Nakata, F., & Rosati, P. 2009, A&A, 507, 671
- Tanaka et al. (2010) Tanaka, M., Finoguenov, A., & Ueda, Y. 2010, ApJ, 716, L152
- Treu et al. (2003) Treu, T., Ellis, R. S., Kneib, J.-P., Dressler, A., Smail, I., Czoske, O., Oemler, A., & Natarajan, P. 2003, ApJ, 591, 53
- Turner et al. (2001) Turner, M. J. L., et al. 2001, A&A, 365, L27
- Valentinuzzi et al. (2010) Valentinuzzi, T., et al. 2010, ApJ, 712, 226
- van Dokkum et al. (1998) van Dokkum, P. G., Franx, M., Kelson, D. D., Illingworth, G. D., Fisher, D., & Fabricant, D. 1998, ApJ, 500, 714
- van Dokkum & Franx (2001) van Dokkum, P. G. & Franx, M. 2001, ApJ, 553, 90
- Watson et al. (2001) Watson, M. G., et al. 2001, A&A, 365, L51
- Wilman et al. (2009) Wilman, D. J., Oemler, A., Jr., Mulchaey, J. S., McGee, S. L., Balogh, M. L., & Bower, R. G. 2009, ApJ, 692, 298
- Yamada et al. (2002) Yamada, T., Koyama, Y., Nakata, F., Kajisawa, M., Tanaka, I., Kodama, T., Okamura, S., De Propris, R. 2002, ApJL, 577, 89
- York et al. (2000) York, D. G., et al. 2000, AJ, 120, 1579
- Zhang et al. (2004) Zhang, Y.-Y., Finoguenov, A., Böhringer, H., Ikebe, Y., Matsushita, K., & Schuecker, P. 2004, A&A, 413, 49
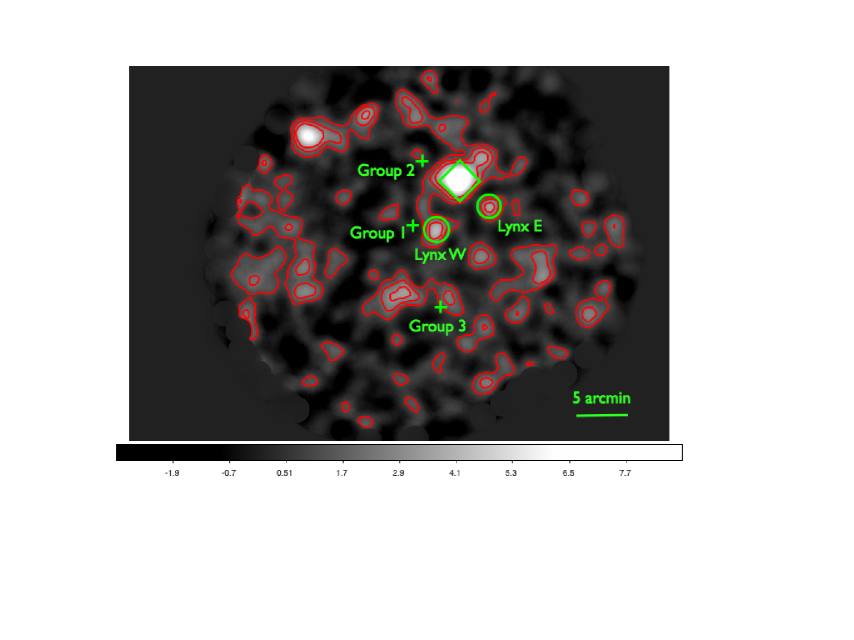
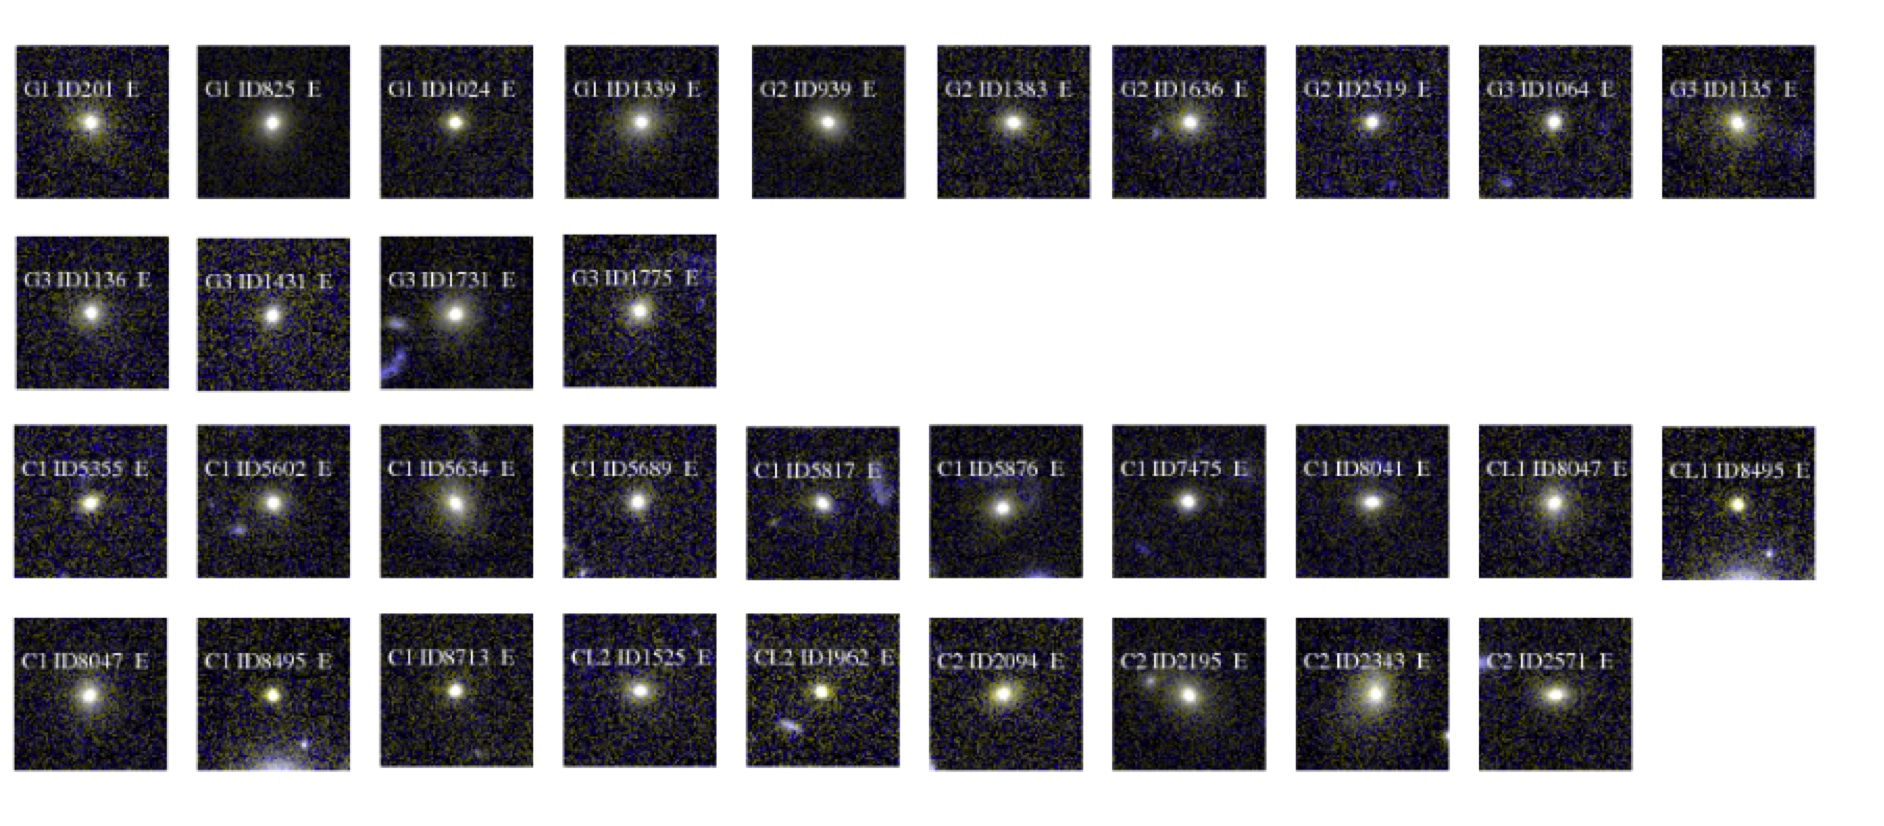
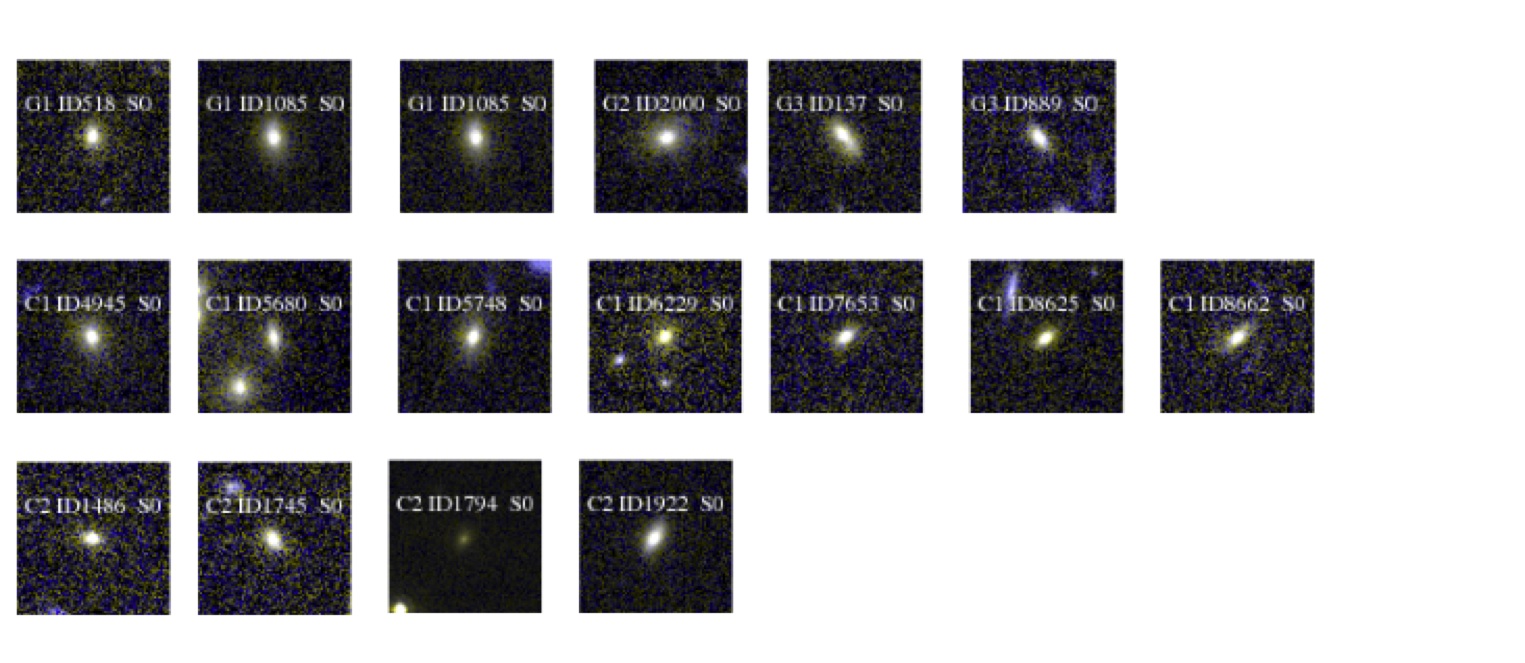
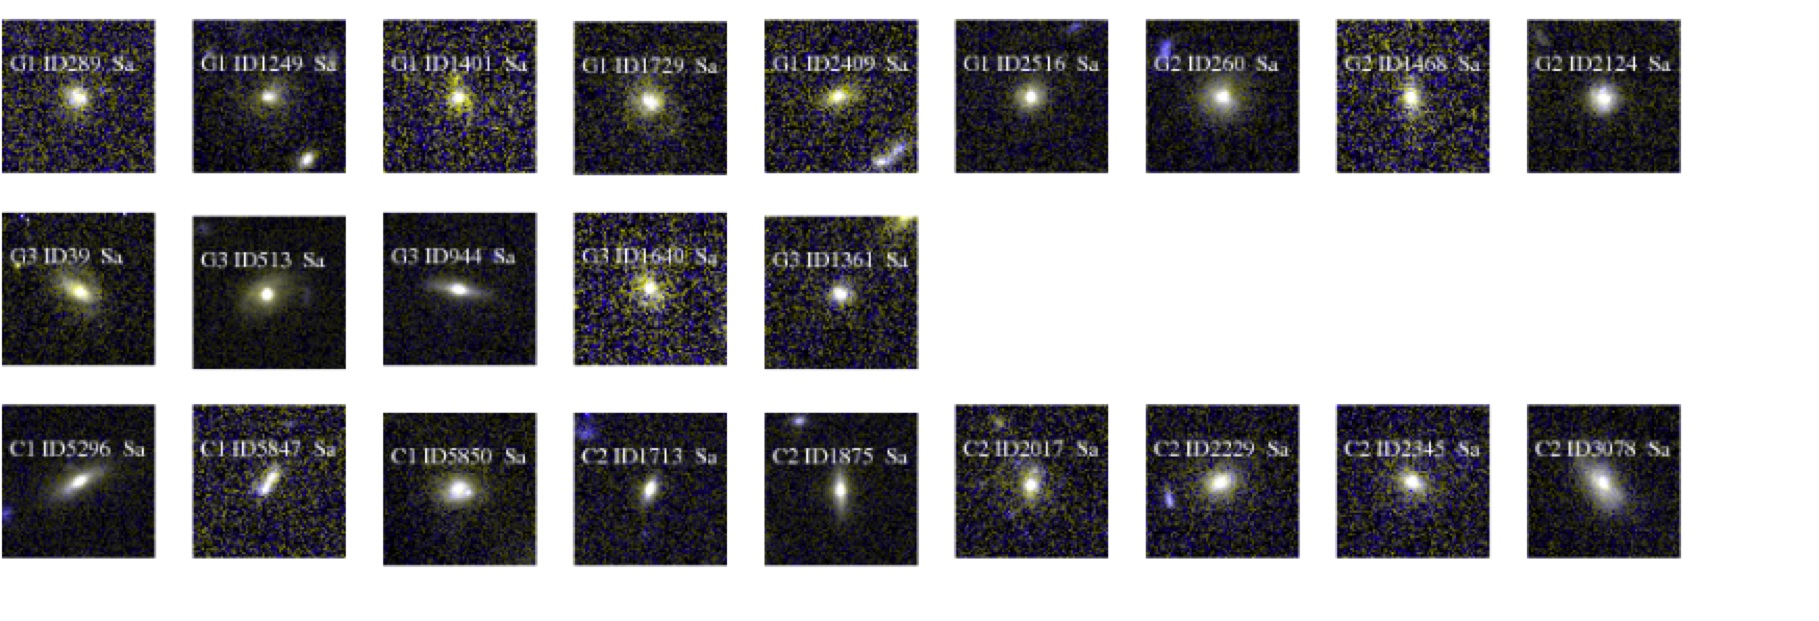
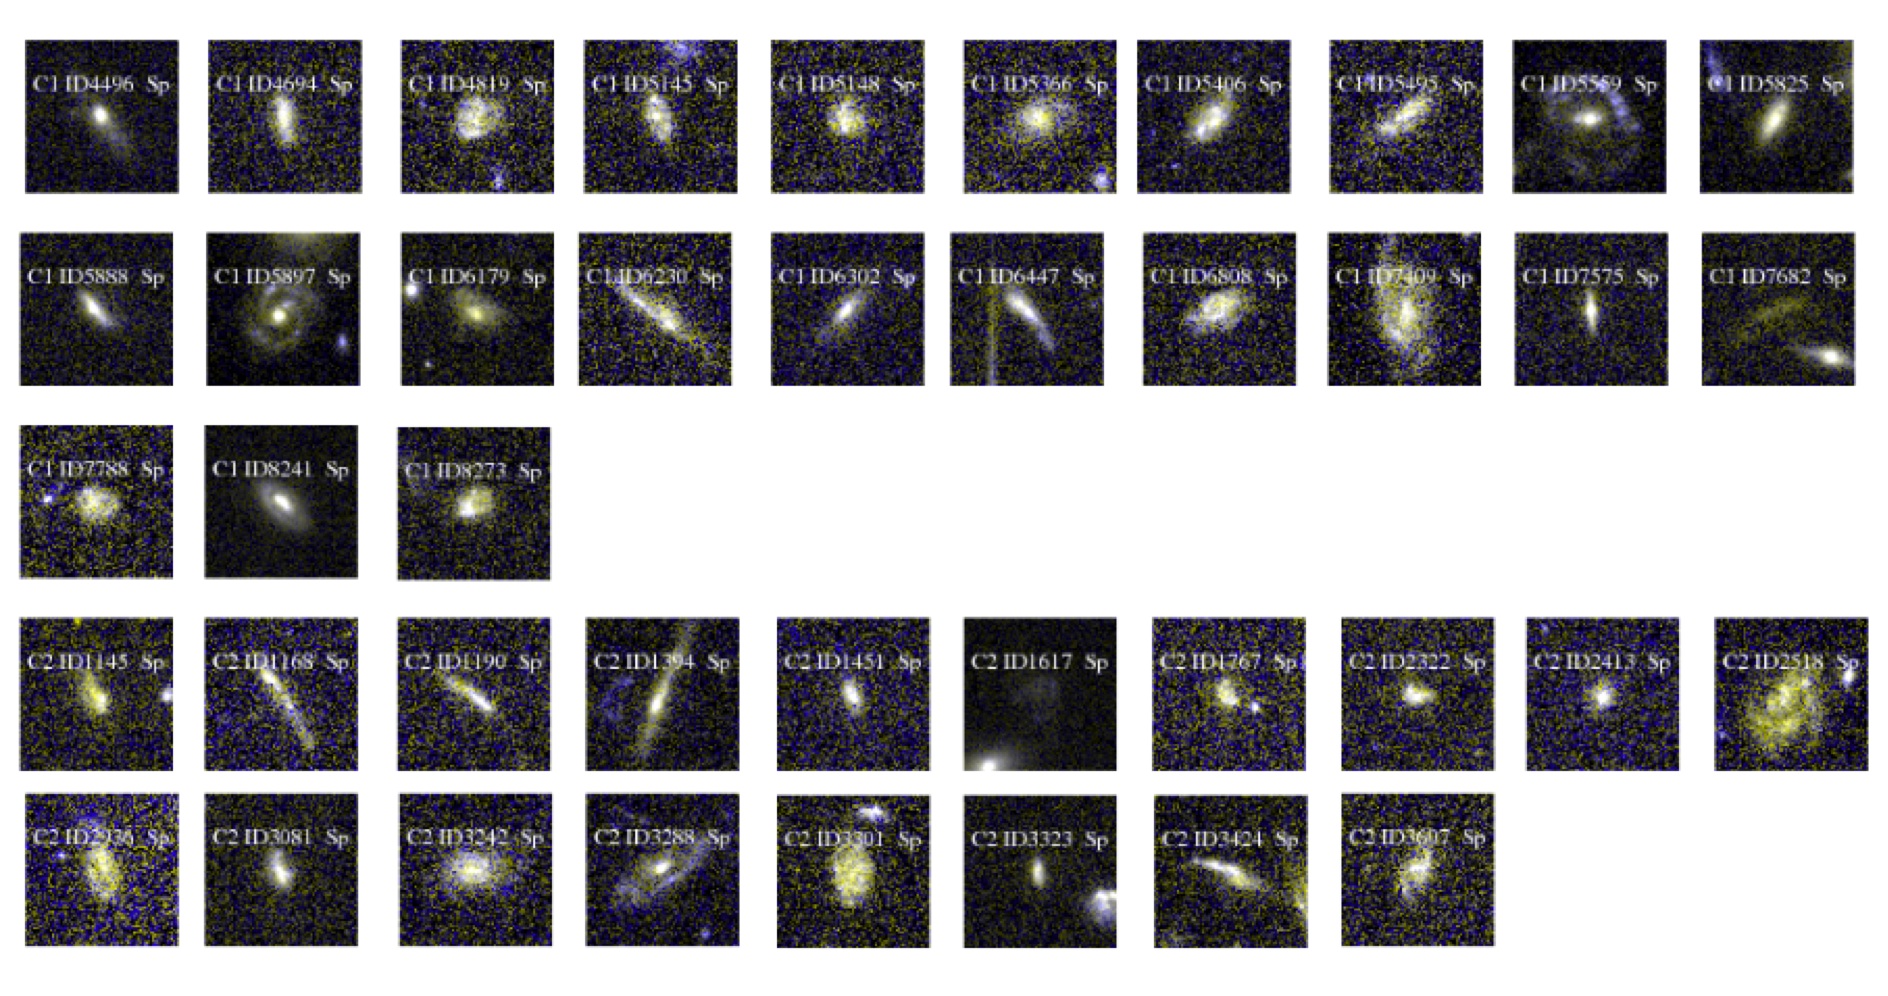
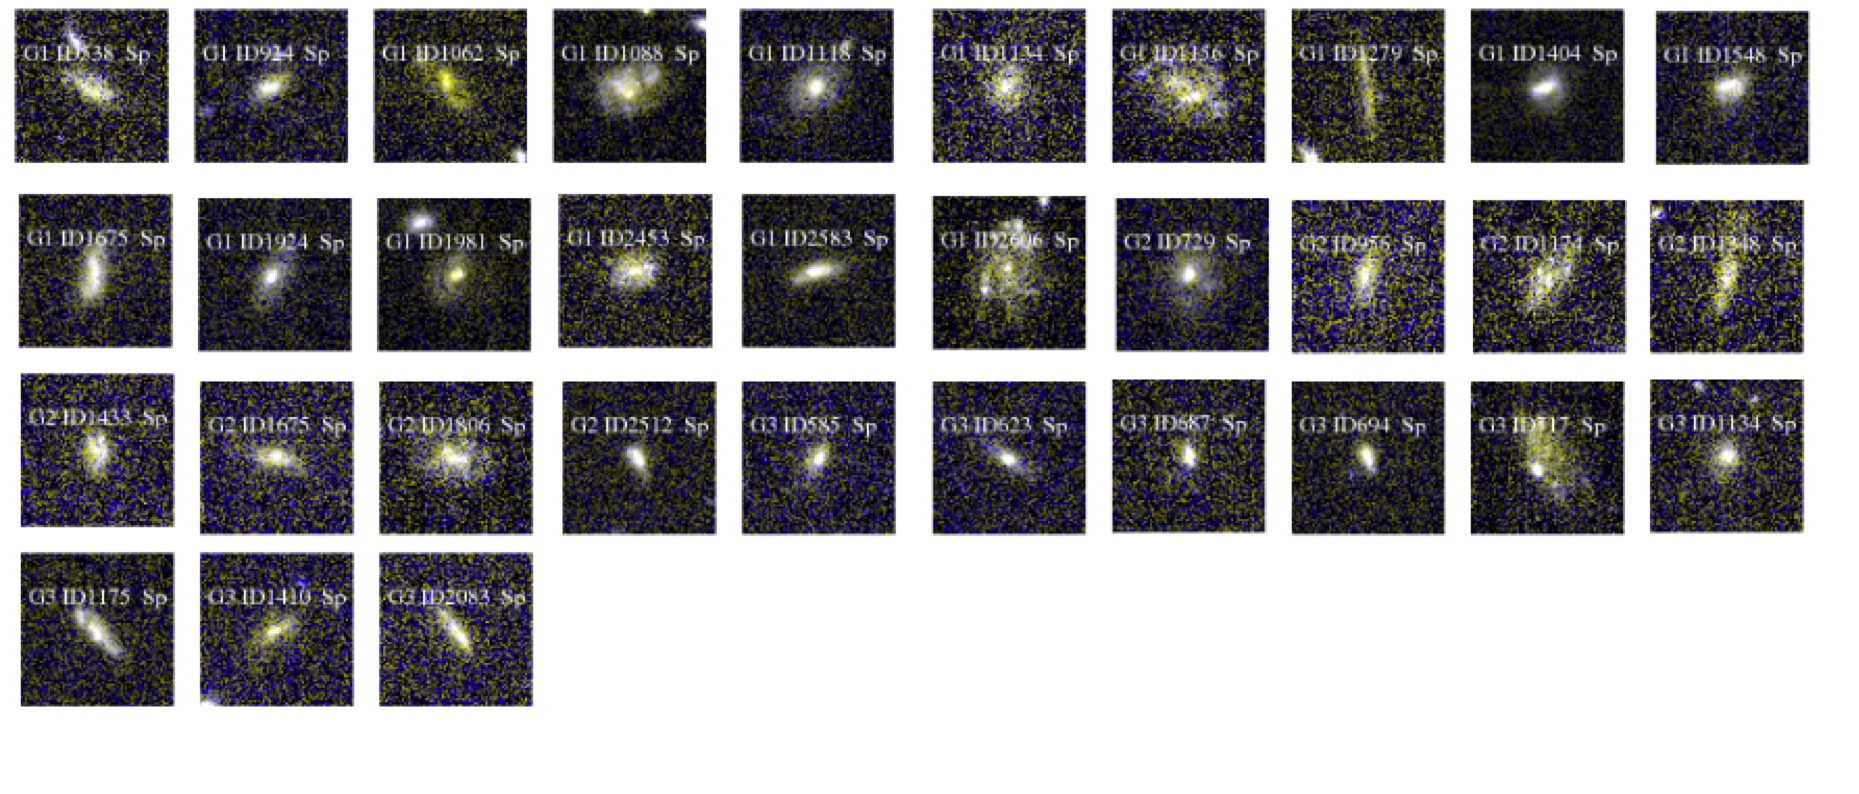
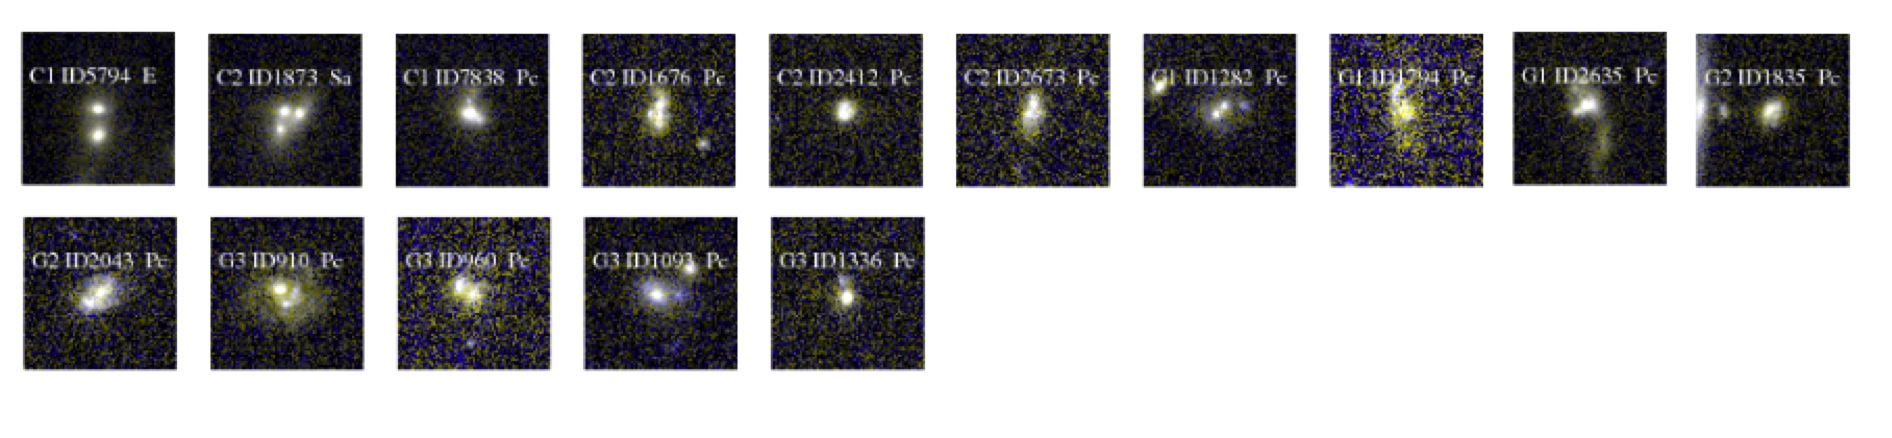
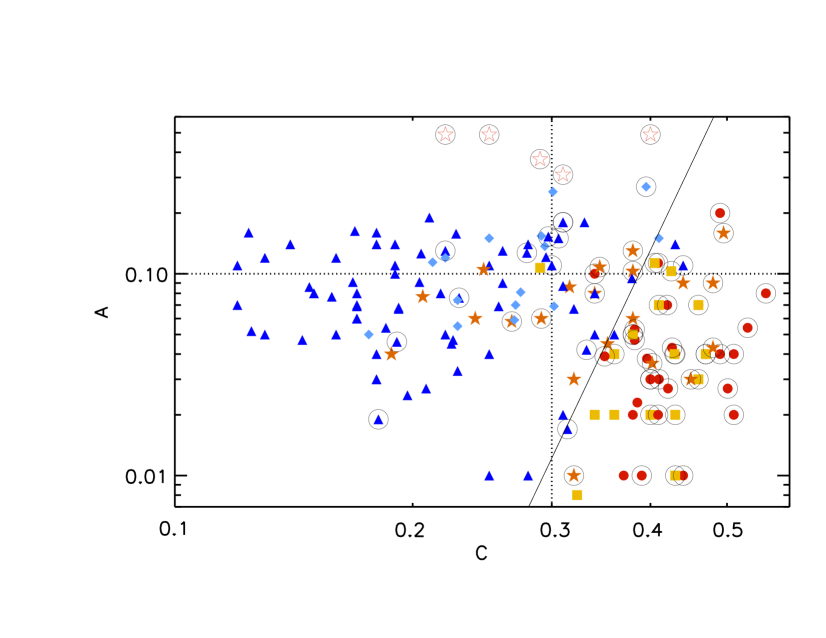
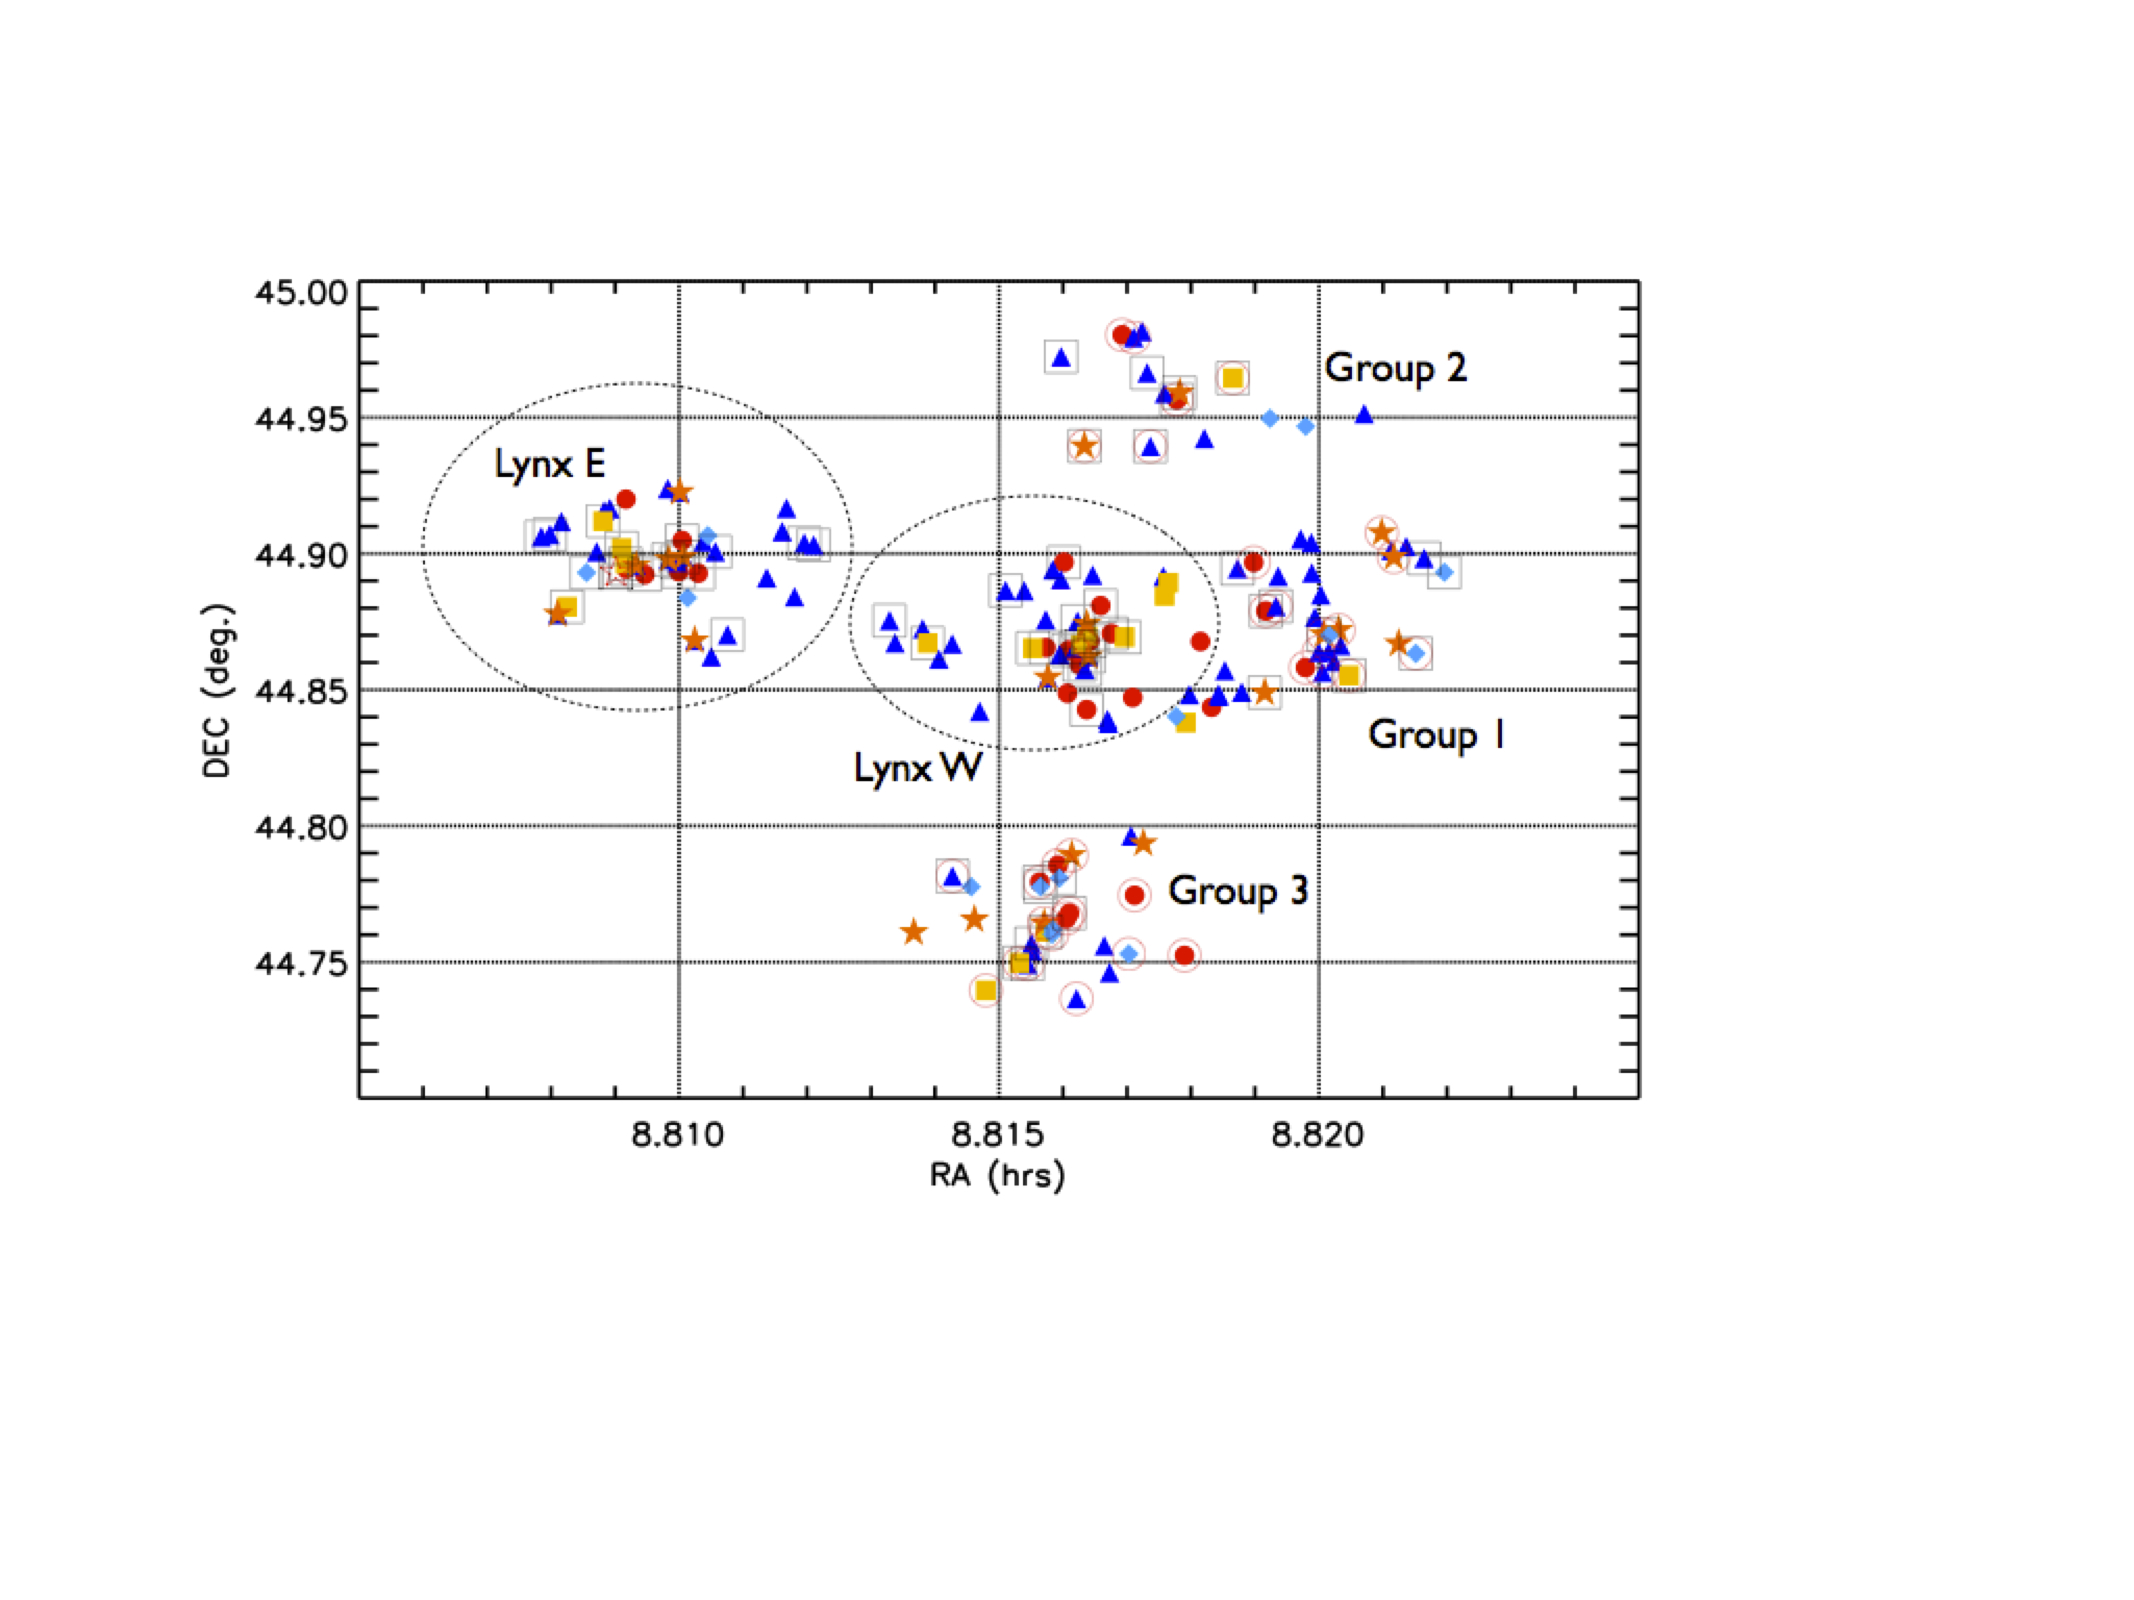
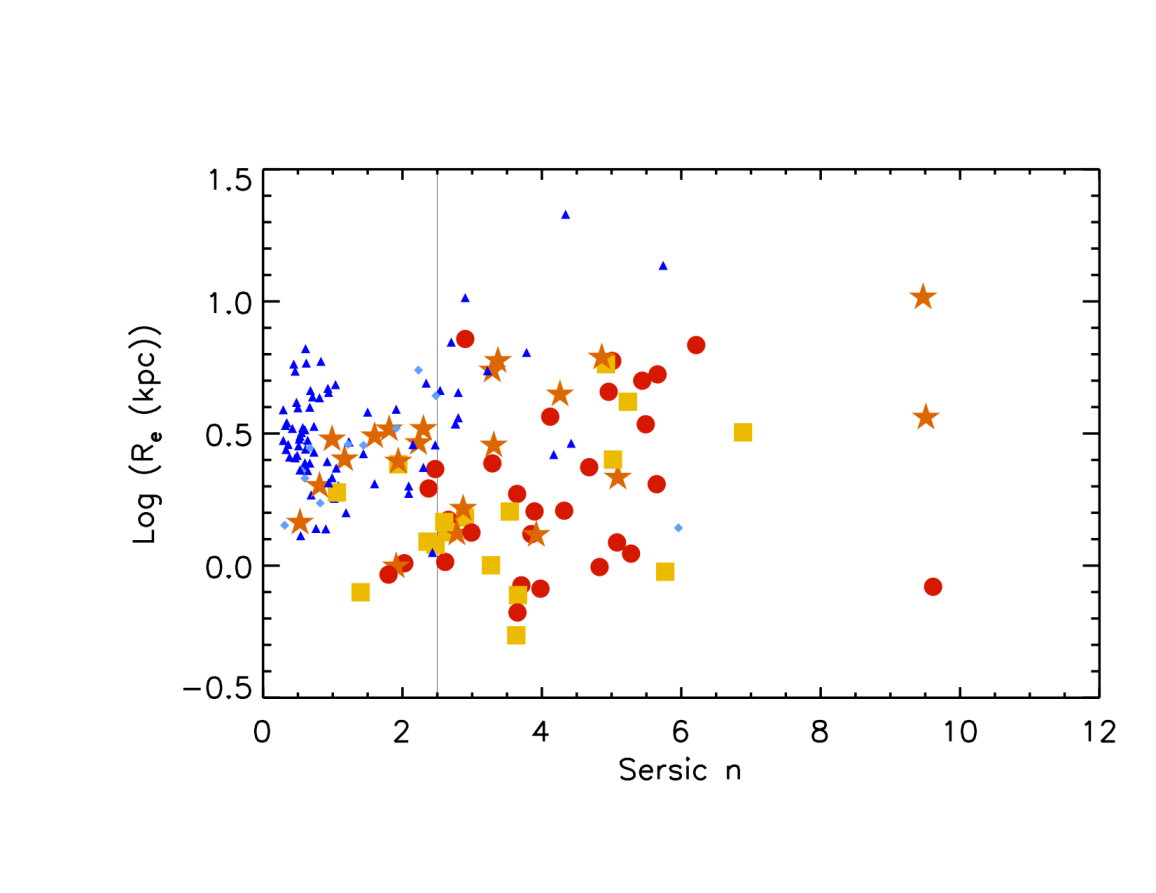
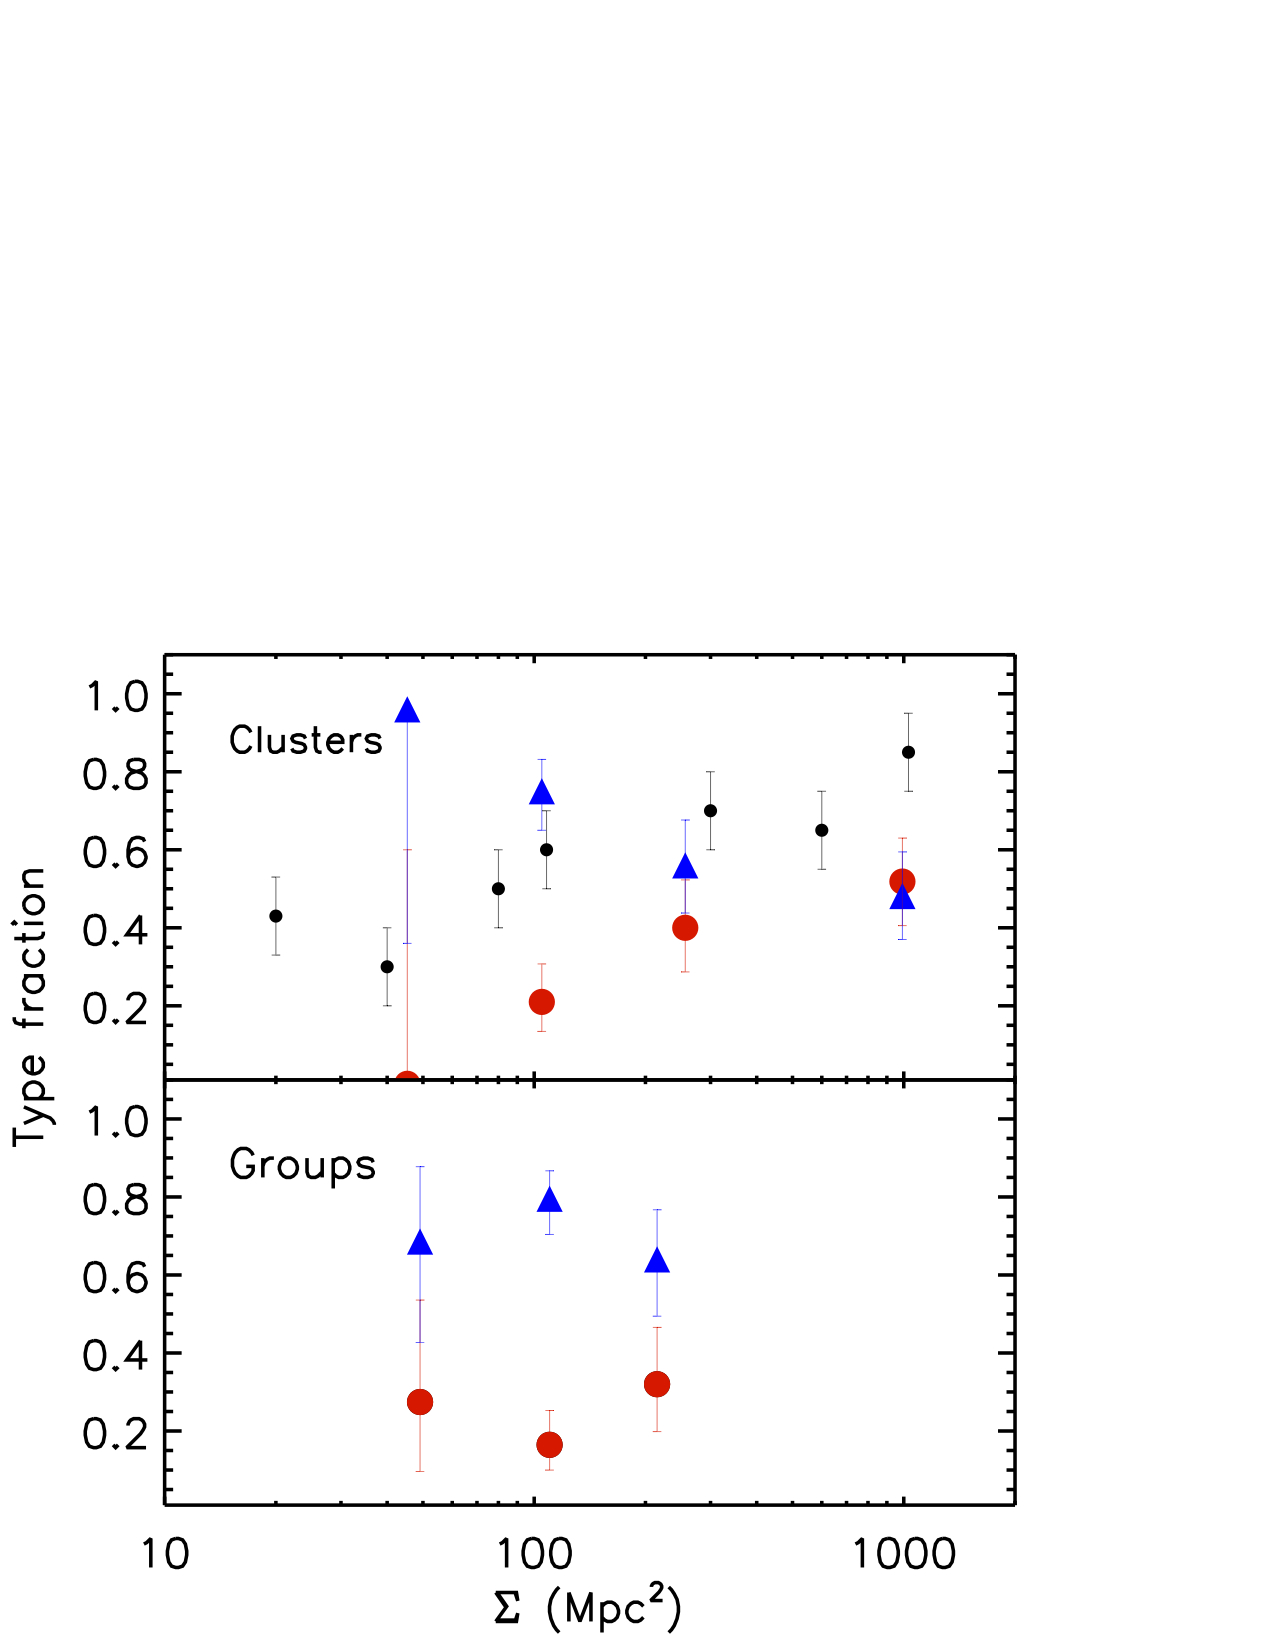
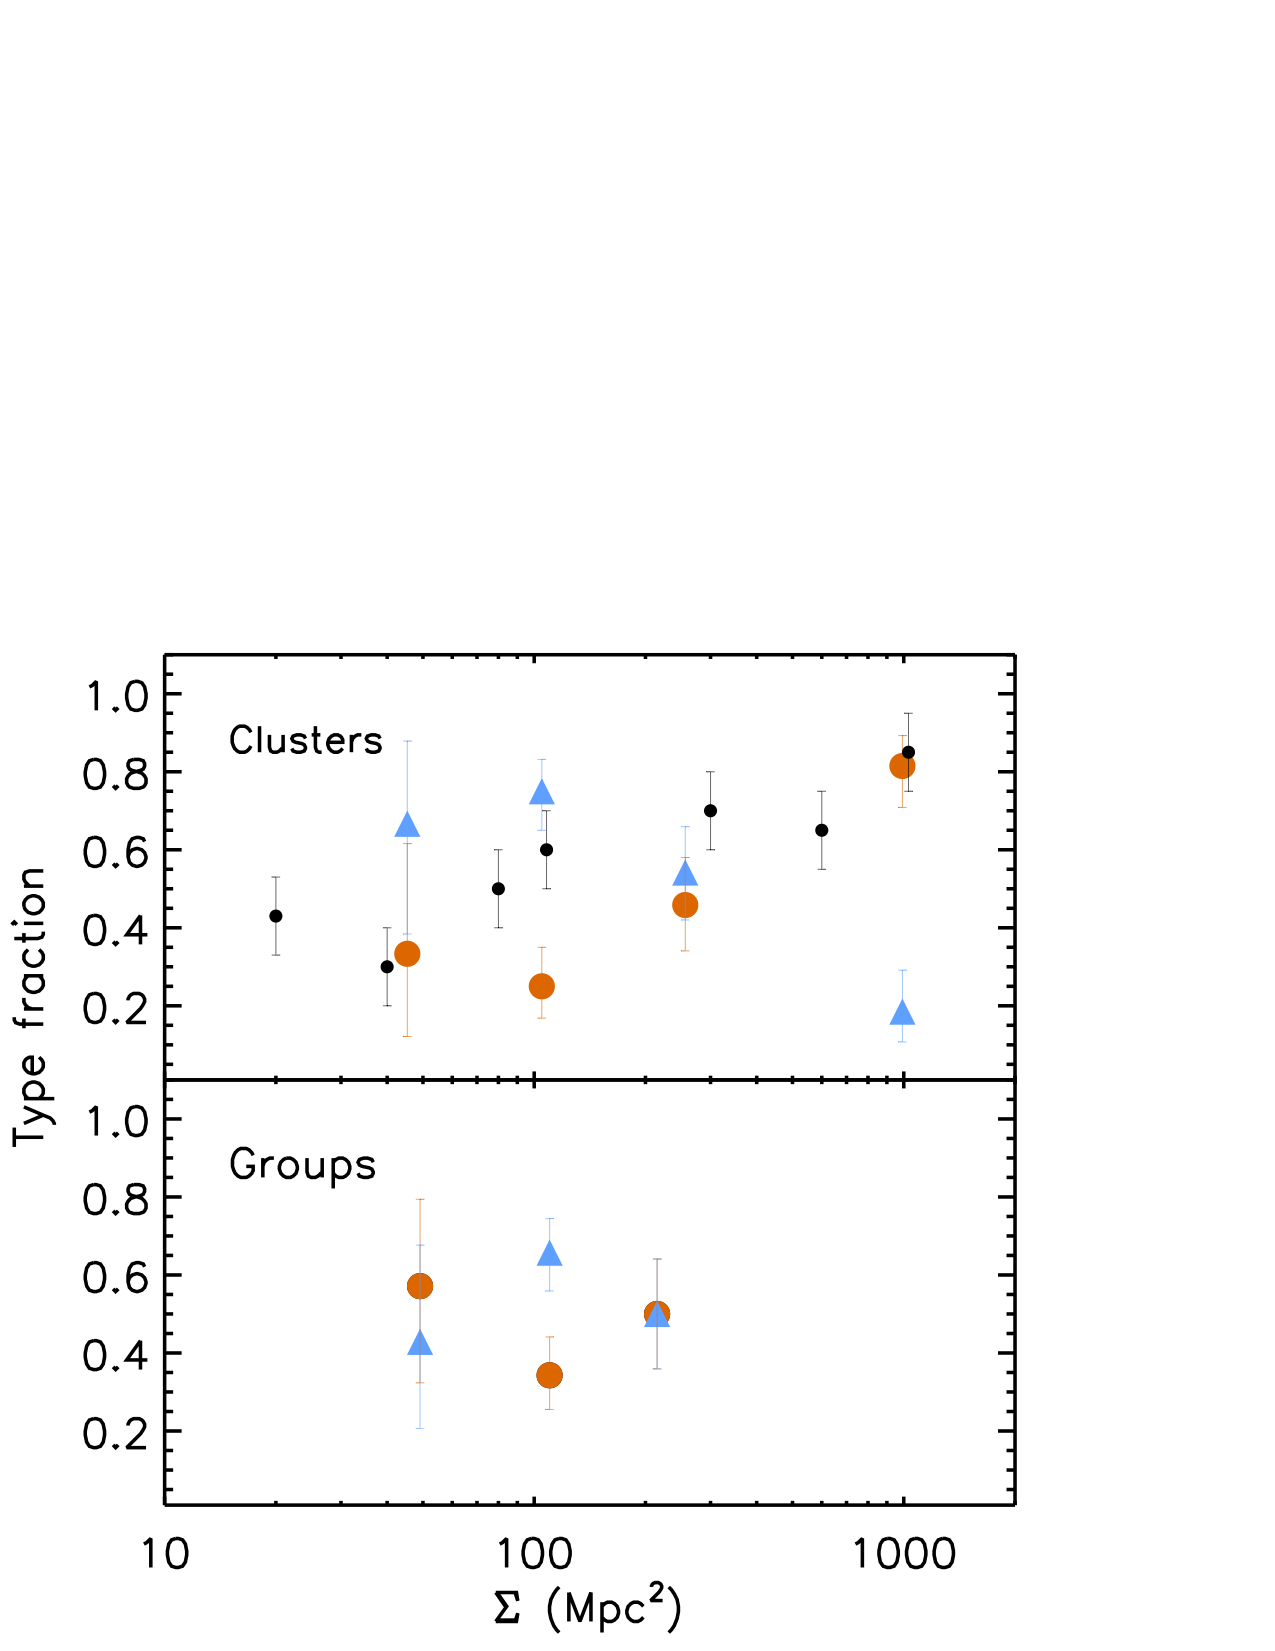
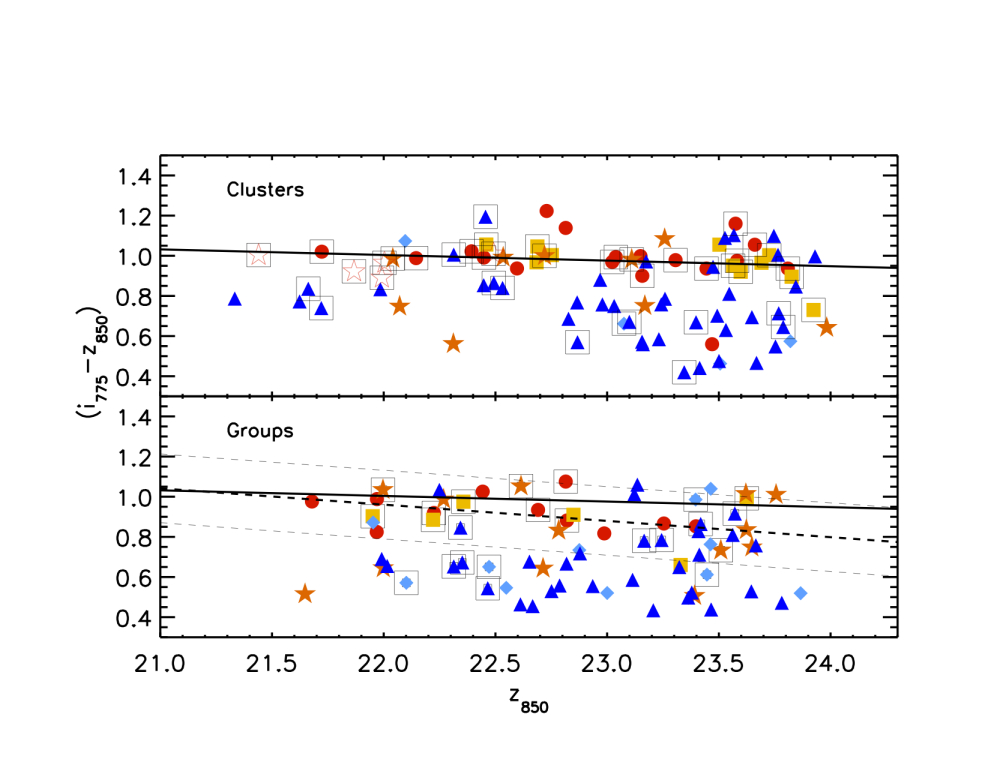
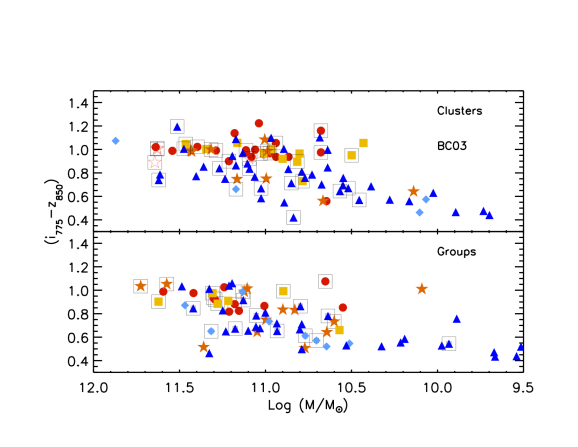
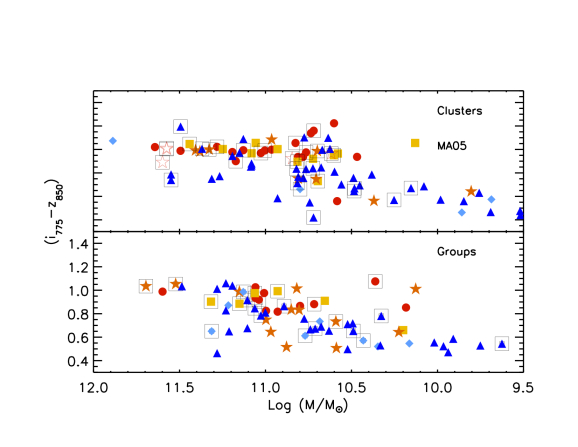
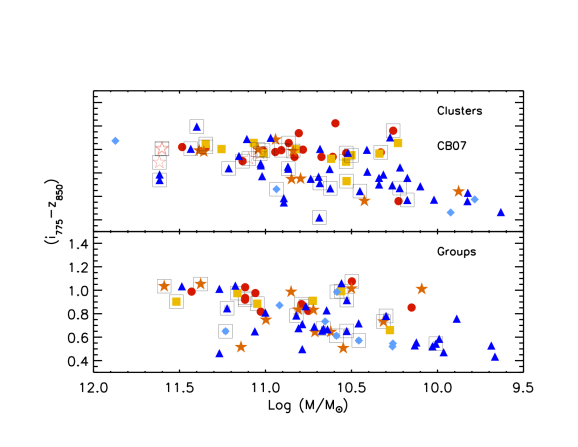
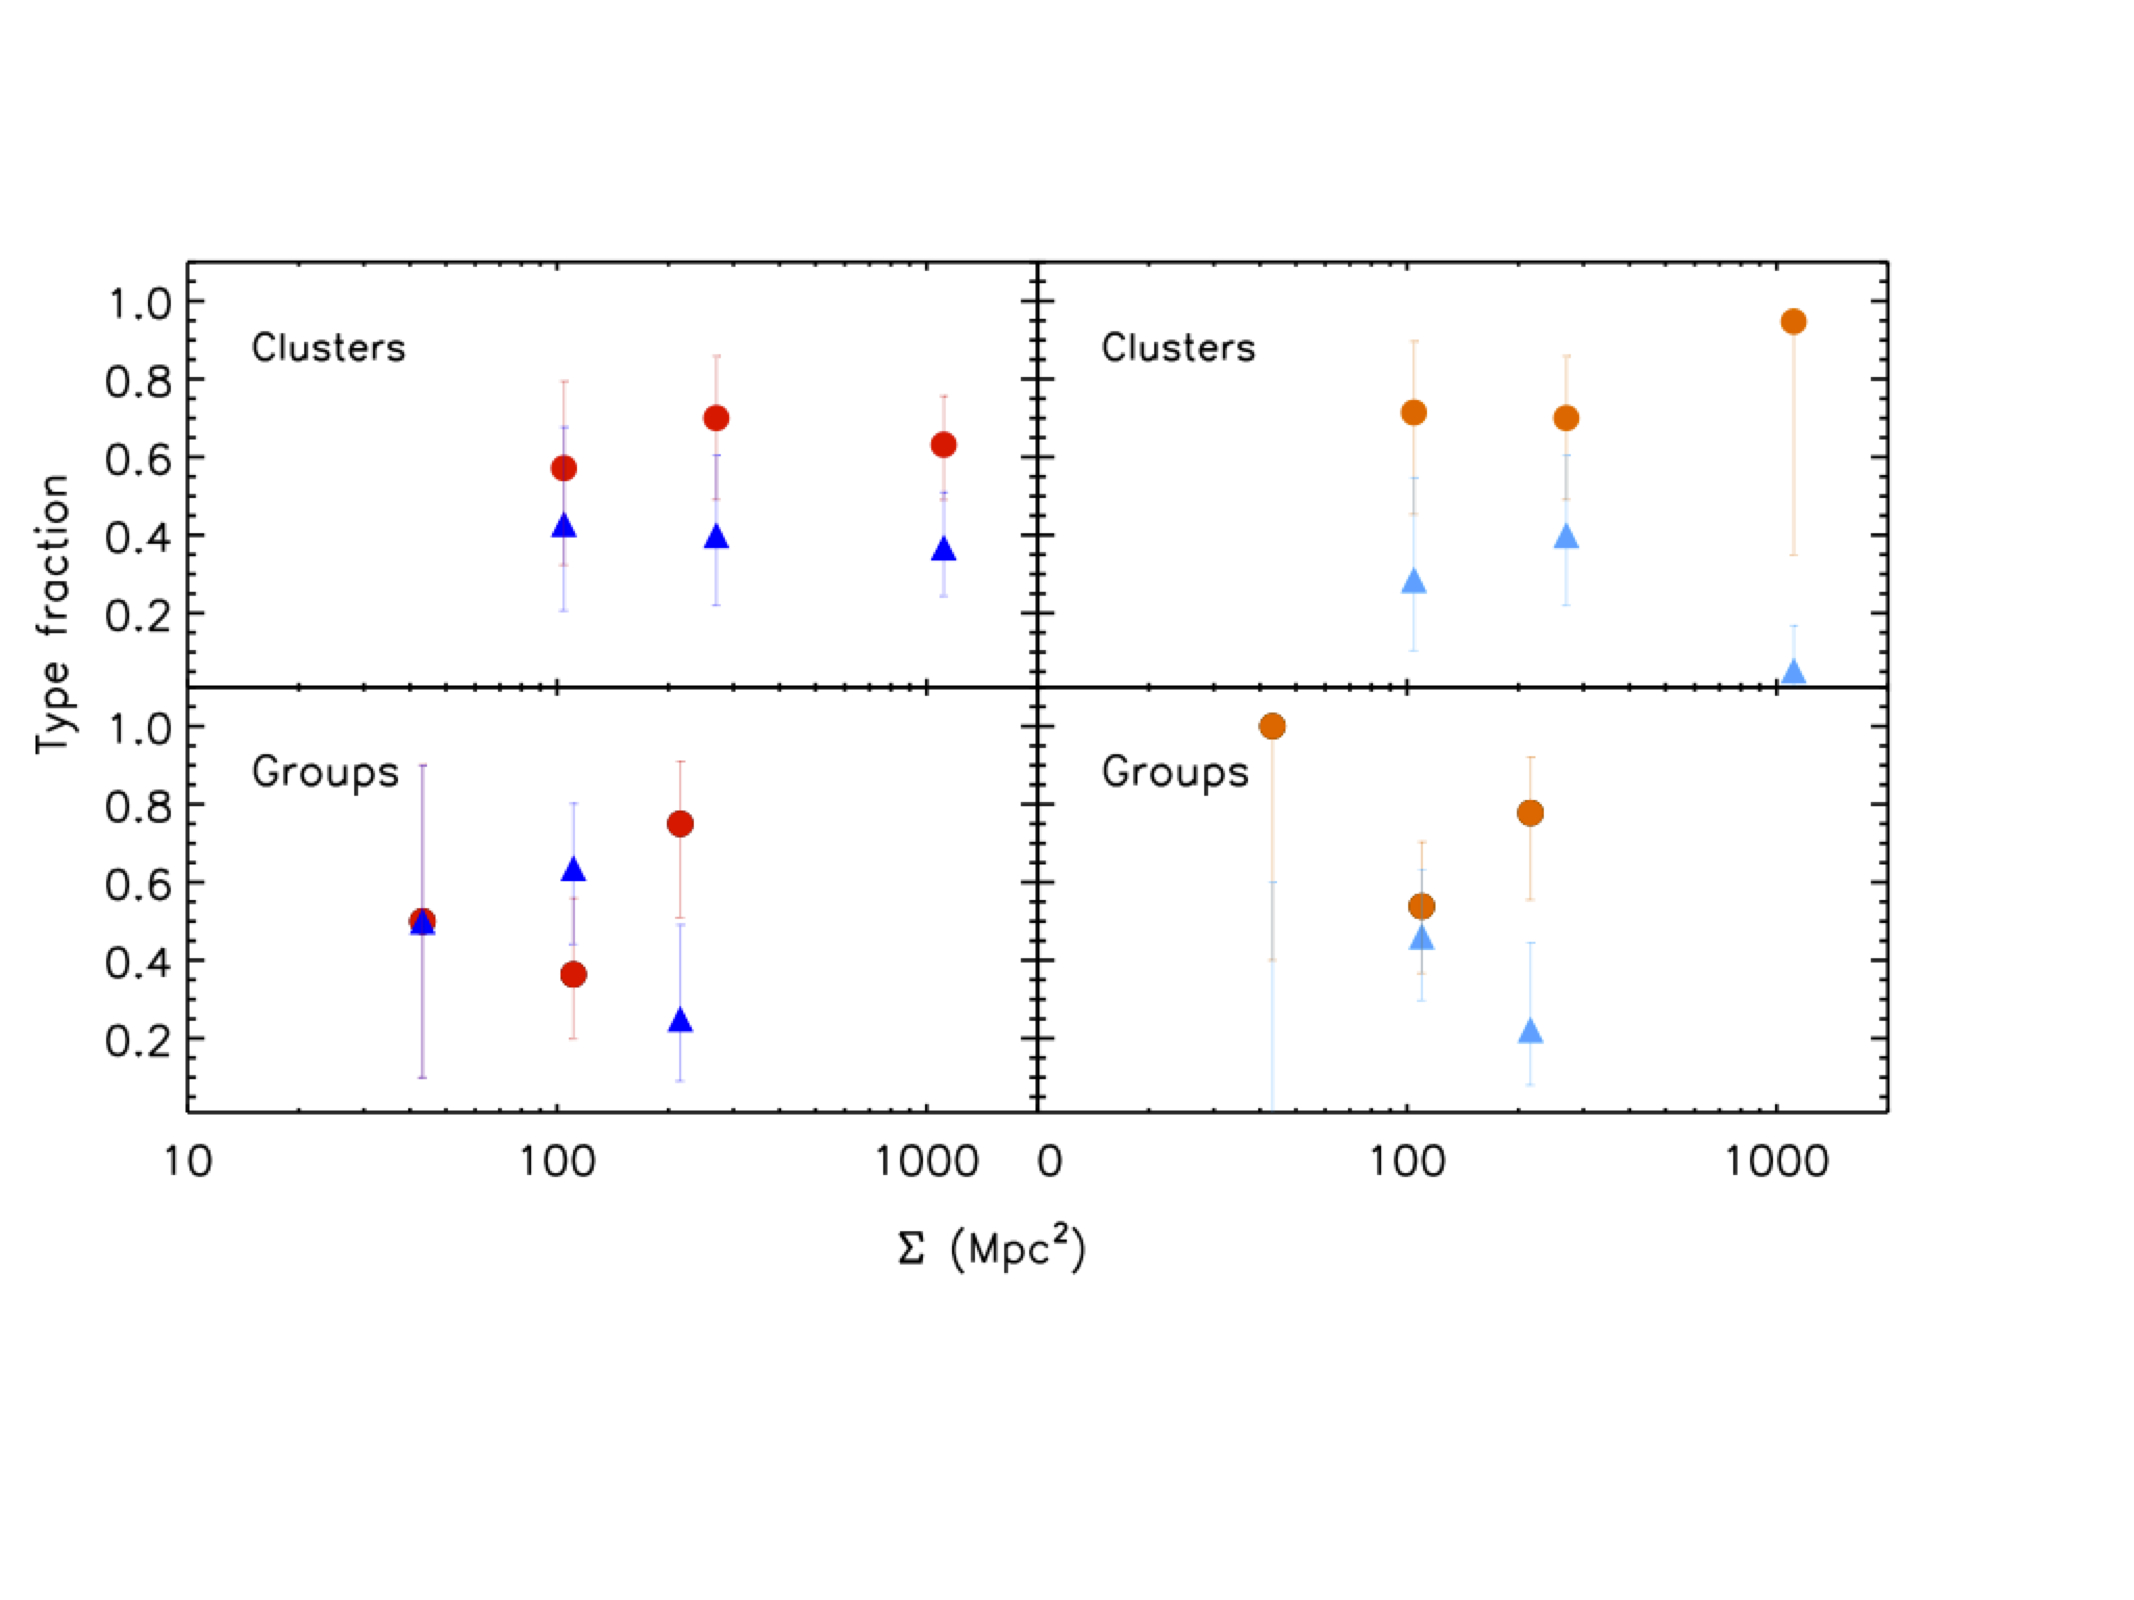 |
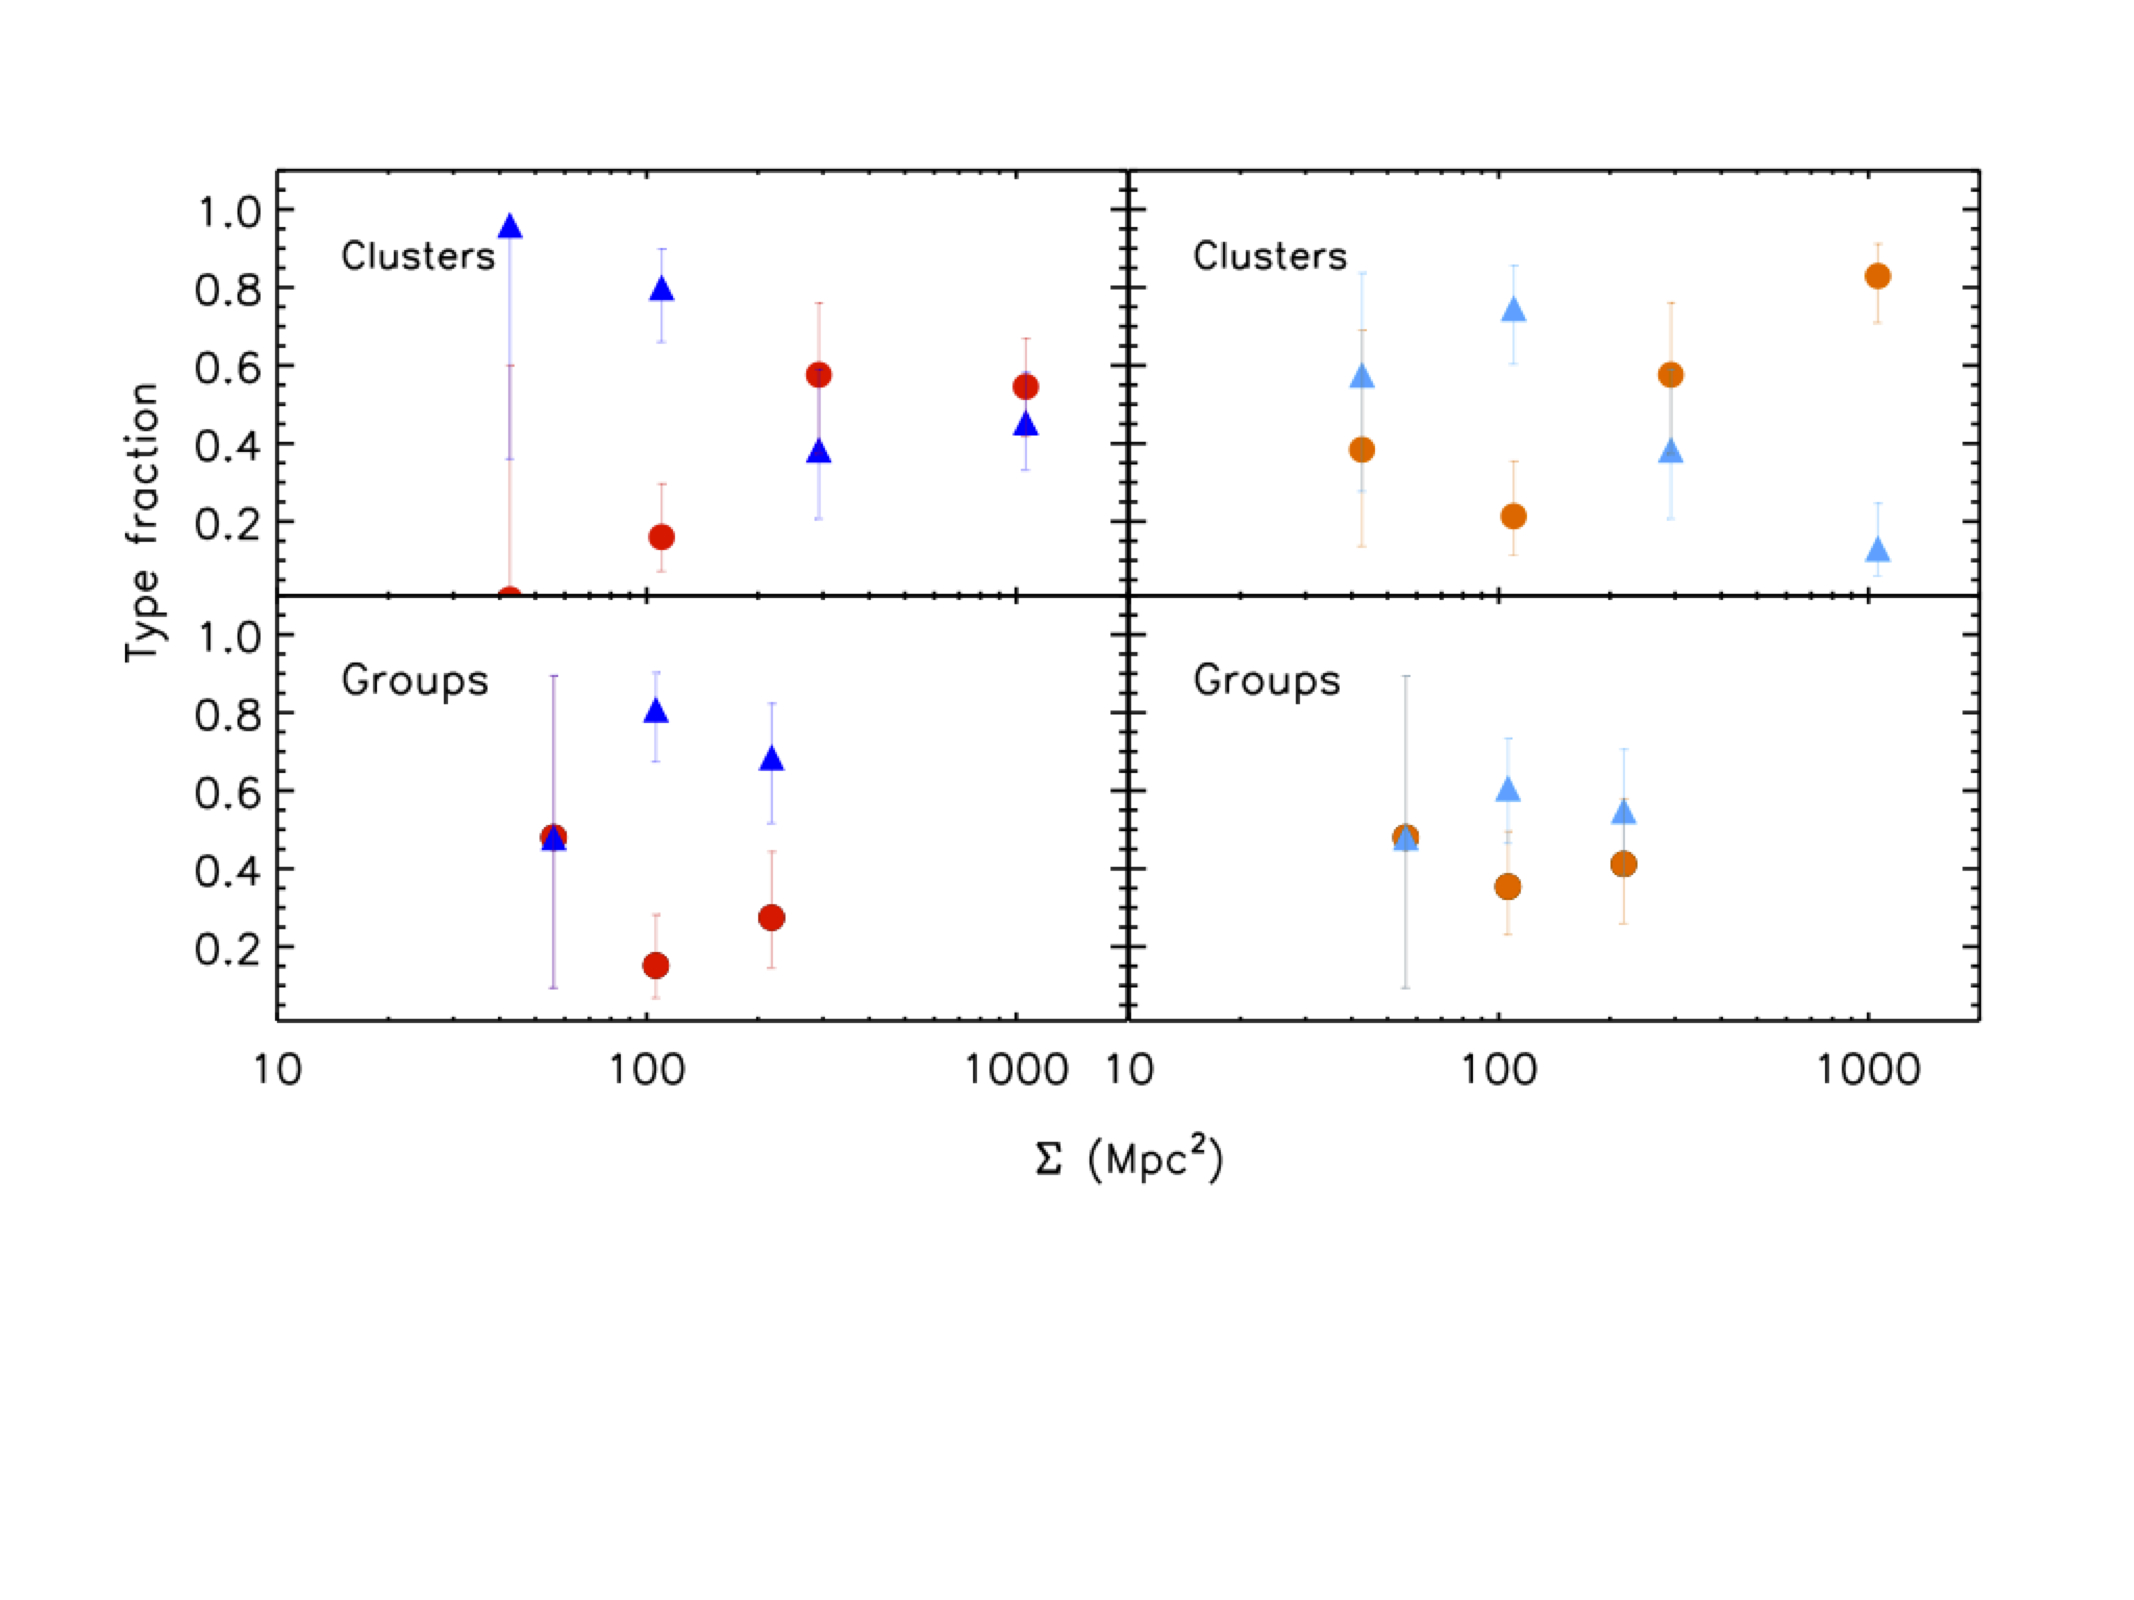
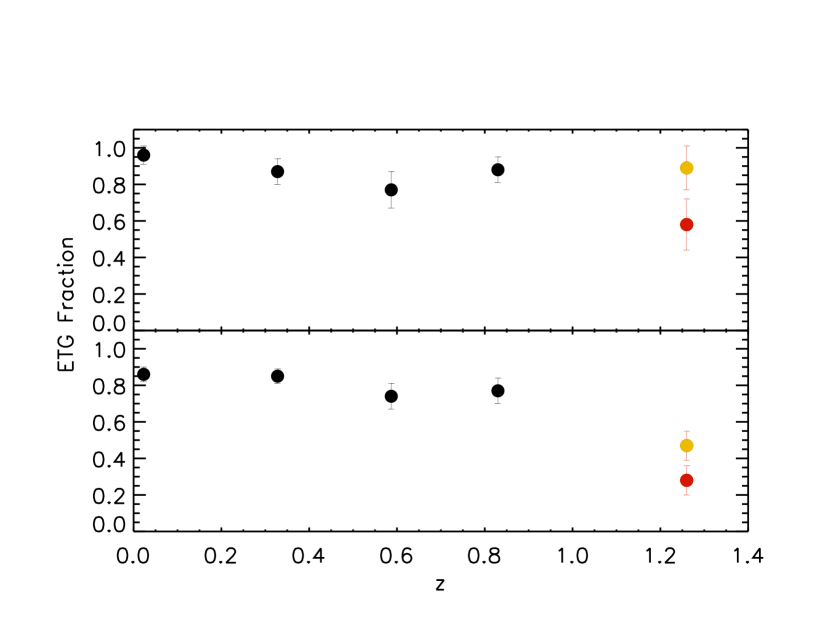
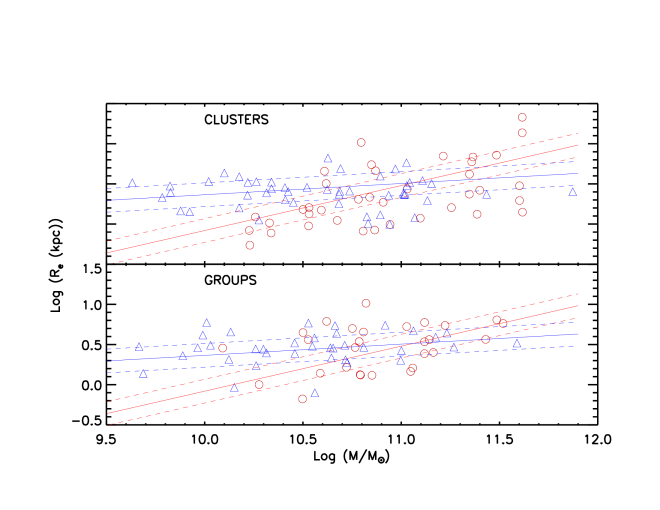
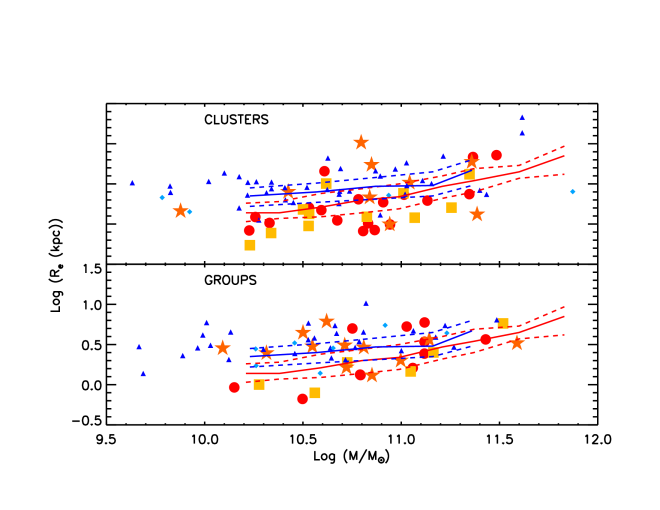
| Cluster/Group | z | ||||||
|---|---|---|---|---|---|---|---|
| (km/s) | ( erg/sec) | Mpc | |||||
| RX J0849+4452 | 1.261 | 0.9 | 49 | 19 | |||
| RX J0848+4453 | 1.270 | 0.8 | 40 | 22 | |||
| Group 1 | 1.262 | 31 | 9 | ||||
| Group 2 | 1.260 | 0.5 | 15 | 7 | |||
| Group 3 | 1.263 | 0.5 | 28 | 9 |
: Velocity dispersion for the clusters come from Jee et al. (2006) and Stanford et
al. (2001). We do not estimate velocity dispersions for the
groups. If the groups were virialized, using Calberg et al. (1997), we
would obtain characteristic velocity dispersions of
400 km/s. Bolometric luminosities were derived within an
over-density for an Einstein–de Sitter universe from
Ettori et al. (2004).
: refers to the radius at which the cluster mean density is 200 times the critical density and is derived from the cluster velocity dispersion (Carlberg et al. 1997).
: Total masses were estimated out to using a cluster model together with the measured emission–weighted X–ray temperature (Ettori et al. 2004)
: and are the photometrically and
spectroscopically-selected members for each structure, respectively
| mag | mag | ||||
|---|---|---|---|---|---|
| Clusters | E+S0 | 26 | 1.01 0.01 | -0.027 0.019 | 0.058 0.012 |
| E | 16 | 0.99 0.01 | -0.014 0.028 | 0.065 0.020 | |
| S0 | 10 | 1.03 0.02 | -0.060 0.031 | 0.036 0.013 | |
| Lynx E | E+S0 | 19 | 1.00 0.02 | 0.001 0.032 | 0.063 0.014 |
| E | 12 | 0.99 0.02 | 0.023 0.033 | 0.064 0.018 | |
| S0 | 7 | 1.00 0.03 | -0.020 0.041 | 0.037 0.016 | |
| Lynx W | E+S0 | 9 | 1.00 0.02 | -0.056 0.018 | 0.028 0.015 |
| E | 6 | 0.98 0.02 | -0.046 0.034 | 0.025 0.023 | |
| S0 | 3 | 1.05 0.01 | -0.139 0.054 | 0.011 0.021 | |
| Groups | E+S0 | 15 | 0.92 0.02 | -0.019 0.050 | 0.078 0.010 |
| E | 11 | 0.93 0.04 | -0.096 0.072 | 0.074 0.019 | |
| S0 | 4 | 0.95 0.01 | 0.073 0.013 | 0.029 0.026 |
| mag | mag | ||||
|---|---|---|---|---|---|
| Clusters | E+S0 | 23 | 1.00 0.01 | -0.032 0.016 | 0.037 0.008 |
| E | 14 | 0.99 0.01 | -0.028 0.014 | 0.025 0.010 | |
| S0 | 9 | 1.03 0.02 | -0.063 0.040 | 0.039 0.015 | |
| Lynx E | E+S0 | 16 | 0.99 0.02 | -0.001 0.028 | 0.036 0.008 |
| E | 10 | 0.97 0.02 | 0.012 0.025 | 0.033 0.010 | |
| S0 | 6 | 1.00 0.04 | -0.014 0.072 | 0.045 0.024 | |
| Lynx W | E+S0 | 9 | 1.00 0.02 | -0.057 0.020 | 0.027 0.015 |
| E | 6 | 0.98 0.02 | -0.044 0.036 | 0.025 0.023 | |
| S0 | 3 | 1.05 0.01 | -0.140 0.054 | 0.011 0.021 | |
| Groups | E+S0 | 8 | 0.92 0.03 | 0.016 0.063 | 0.066 0.024 |
| E | 5 | 0.92 0.06 | -0.081 0.106 | 0.057 0.030 | |
| S0 | 3 | 0.95 0.01 | 0.066 0.002 | 0.011 0.021 |
| Frac. BC03 | Frac. MA05 | Frac. CB07 | ||||||
|---|---|---|---|---|---|---|---|---|
| Clusters | E+S0 | 80 | 26 | 43 7 | 25 | 46 0.08 | 20 | 43 8 |
| E+S0 | 500 | 11 | 58 14 | 11 | 58 14 | 10 | 56 14 | |
| E +S0 +Sa | 80 | 35 | 57 7 | 33 | 60 7 | 28 | 60 8 | |
| E+S0 +Sa | 500 | 17 | 89 12 | 17 | 16 | |||
| Groups | E+S0 | 80 | 13 | 28 8 | 12 | 32 9 | 11 | 22 9 |
| E +S0 +Sa | 80 | 22 | 47 8 | 18 | 49 9 | 17 | 35 9 |