Characterizing price index behavior through fluctuation dynamics
Abstract
We study the nature of fluctuations in variety of price indices involving companies listed on the New York Stock Exchange. The fluctuations at multiple scales are extracted through the use of wavelets belonging to Daubechies basis. The fact that these basis sets satisfy vanishing moments conditions makes them ideal to extract local polynomial trends, through the low pass or ‘average coefficients’. Subtracting the trends from the original time series yields the fluctuations, at different scales, depending on the level of low-pass coefficients used for finding the ‘average behavior’. The fluctuations are then studied using wavelet based multifractal detrended fluctuation analysis to analyze their self-similar and non-statistical properties. Due to the multifractality of such time series, they deviate from Gaussian behavior in different frequency regimes. Their departure from random matrix theory predictions in such regimes is also analyzed. These deviations and non-statistical properties of the fluctuations can be instrumental in throwing significant light on the dynamics of financial markets.
1 Introduction
Financial time-series which were in the past of interest to only economists, have led to considerable inter-disciplinary research due to the applicability of various physical laws and techniques in their analysis. This has led to the discovery of various new aspects like fractality mandelbrot1963 , multifractality peng1994 , correlated behavior bouchad2000 ; mantegna2000 and complex network structure mantegna1999hier . The last few years has also seen a lot of activity in terms of explaining the correlations in financial markets through the Random Matrix Theory (RMT) framework wigner1951 ; plerou1999 ; plerou2002 .
Fractals as first predicted by Benoit Mandelbrot in the 1960s mandelbrot1982 have been widely applied to understand various processes in Physics tosatti1986 , Chemistry stanleynature1988 and Biology dewey1997fractals . Mandelbrot in 1963 proposed the study of fluctuations in the market prices mandelbrot1963 which opened new vistas for the analysis of stock markets through statistical physics. In the recent years, Peng et al. proposed the “Detrended Fluctuation Analysis (DFA)” in 1994 peng1994 to study the DNA nucleotide structure as a random walk problem which was extended to study the price fluctuations in economic time-series under a mono-fractal hypothesis liu1999 ; vandewalle1999 ; kantelhardt2001 . However, the inadequacy of the mono-fractal hypothesis to model the behavior of financial time series was soon pointed out and consequently, a multi-fractal model called the “Multi-Fractal Detrended Fluctuation Analysis (MFDFA)” was proposed kantelhardt2002a . This method used a variable window approach to calculate the local variances in the profile of the data series from the polynomial fit. Manimaran et al. in 2009mani3 building on the work by Kantelhardt et al. proposed the “Wavelet Based Multi-Fractal De-trended Fluctuation Analysis (WBMFDFA)”, where, using the Multi-Resolution Analysis (MRA) capable “fractal like” kernels, the time-frequency resolution and extraction of fluctuations for multi-fractal analysis was shown to have a greater efficiency than its predecessor.
The study of the correlation matrix of the financial return series have been shown to agree well with the predictions of RMT and the nearest-neighbor-spacing of the rank-ordered unfolded eigenvalues of the correlation matrix follow that of the Gaussian Orthogonal Ensemble (GOE) laloux1999a ; plerou1999 . This behavior dubbed as an universal behavior of the financial return series have again, recently been studied with respect to temporal evolution of financial correlations to study the differences between the assumption of strongly correlated financial time-series and uncorrelated financial time-series fenn2011 . In this context, it becomes important to analyze the nature of correlations in the time-frequency domain in order to ascertain the effects of non-stationarity and transience on such studies. The inefficient handling of such signals by either Fourier Transform or Short Term Fourier Transform for the purpose of a time-frequency localized study have already been established, leading to the development of Wavelet Transform daub1 .
In this work, we will use a wavelet based fluctuation extraction technique to study the correlations of the fluctuations at various frequency windows (called scales in the wavelet parlance). We will also briefly comment on the multi-fractal nature of the fluctuations and the distributions of the associated parameters: Hurst exponent and singularity strength. The organization of the article is as follows: in Sec. (2), we will briefly review the theoretical methods of Wavelet Based Fluctuation Extraction (WBFE), Wavelet Based Multi-Fractal De-trended Fluctuation Analysis (WBMFDFA) and the Random Matrix Theory (RMT) based method to study the time-frequency localized correlations of the fluctuations. Further in Sec. (3), we discuss the results obtained by the application of WBFE, WBMFDFA and correlation analysis on the price index of scrips trading on the New York Stock Exchange (NYSE) between September 1984 to June 2010. Finally, we summarize and conclude with the scope for future work in Sec. (4).
2 Review of theoretical methods
2.1 Wavelet Based Fluctuation Analysis
In the following, the analysis of a time series given by is carried out by calculating the “log-normalized return series” :
| (1) | |||||
| (2) |
where, and are the time average and standard deviation of the log-return series . is also called as the “volatility of returns”. The profile is calculated by taking the cumulative sum of the log-normalized return series:
| (3) |
which is then subjected to the Wavelet Based Fluctuation Extraction (WBFE)mani3 . The WBFE can be performed following the steps:
-
1.
Calculate the one-dimensional discrete wavelet transform (1DWT)mallat1 ; daub1 ; farge1 ; torrence1 of the profile:
(4) where are the “low-pass” coefficients that capture the trend or the average behavior of the signal and are the “high-pass” coefficients capturing the local fluctuations in the signal at various window sizes . The functions and are called the “scaling filter” and the “high pass” filters respectively. The father and mother wavelets and are orthogonal to each other and are subjected to the admissibility conditions
(5) (6) (7) (8) The scaled and translated versions of are called the “daughter wavelets”
(9) which differ from the mother wavelet at the scale by in height and in width. and are called the scaling and translation parameters respectively and is the maximum number of scales for the profile of length .
The wavelet kernel for the 1DWT should be chosen such that it captures the maximum information from the signal. For example, the Daubechies’ family of wavelets satisfy vanishing moment conditions which make them blind to various polynomial trends. The wavelet Db- (with the index number being even integers between 2 and 20), has vanishing moments limiting the representation of a polynomial trend of in the signal. The Db- wavelet has two vanishing moments making it blind to constant and linear trends. In this work the Db- wavelet is employed.
-
2.
Calculate the approximate trend at the scale of interest and subtract it from the profile to get the fluctuations :
(10)
The obtained by this method represent the fluctuations at different frequency bands (the scale is inversely related to the frequency). Consequently, these fluctuations can be probed to analyze the behavior of the signal in various frequency bands like Fourier power law and moments of the fluctuation distribution. It has been shown earlier that the well-known behavior of market fluctuations appear only in the low frequency or long wavelength regimesayantan2011 . Due to the varying window sizes (corresponding to different scales) and the convolution error generic to wavelet transforms, the extracted fluctuations happen to have erroneous values at the edges. These errors are corrected by performing the WBFE on the reversed profile and then taking the average of the two (forward and reversed) fluctuation series at each scale.
2.2 Wavelet Based Multi-Fractal De-trended Fluctuation Analysis
These fluctuations can also be subjected to a multi-fractal analysis which is a modified form of the original MFDFA proposed by Kantelhardt et al. in 2002kantelhardt2002a .
The fluctuations obtained in Eq. (10) are further subdivided into segments of size such that , where is the support width of the wavelet and represents the scale. Thus the fluctuations obtained at various scales can be analyzed at window sizes corresponding to the scale and the wavelet used.
Since the fluctuations are guaranteed to have zero mean, we can directly find the variance of each segment and thus calculate the fluctuation function
| (11) |
is the “th order” fluctuation function, where . The negative (positive) values capture the fractality of the broader (finer) fluctuations. It can be easily seen that at , the blows up. Hence, to circumvent this issue, at ,
| (12) |
The “generalized Hurst exponent” can be obtained from since, as a function of the segment size , follows a power law of the form
| (13) |
It must be noted that at , this method reduces to the standard mono-fractal fluctuation analysis and is the Hurst exponent. The multi-fractal scaling exponent can be calculated as
| (14) |
The singularity spectrum is related to the multi-fractal scaling exponent by a Legendre transform
| (15) |
2.3 Correlation analysis of fluctuations
The fluctuations obtained at scale through Eq. (10) can be analyzed for correlations. The fluctuations for the entire data set of scrips can be written as a matrix , where is the time length of the fluctuation series of each the scrips. The correlation matrix is thus given by
| (16) |
where, is the transposition operation. In the case where consisted of mutually independent normally distributed fluctuations of length , could be considered to be a Wishart matrix edelman1988 ; baker1998 ; laloux1999a . Under the constraint and the density of eigenvalues of the correlation matrix takes the form mitra1999
| (17) |
with being the variance of the matrix and given by
| (18) |
It must be noted that under the constraint , the eigenvalues of the the matrix lie strictly in the range . However, for finite sized matrices, there exists a finite probability of finding eigenvalues outside this range. Indeed, it has been shown that for financial time series, the nearest-neighbor eigenvalue spacing , obtained through unfolding the eigenvalues of follow the distribution for a Gaussian Orthogonal Ensemble (GOE)plerou1999
| (19) |
Here, we will investigate the scale dependence of the for the correlation of the fluctuations and at scale , where and are different scrips in the corpus. This will give us an idea about the effectiveness of the RMT predictions in different frequency regimes.
3 Results and discussion
3.1 Data
We have analyzed 196 scrips trading on the New York Stock Exchange (hereafter referred to as NYSE) in the period from September the 7th, 1984 to June the 10th, 2010. The scrips analyzed in this work have been chosen so as to encompass high-cap, mid-cap as well as low-cap sections of the American stock market. This combined with the time-frame for analysis includes some of the major crashes of the NYSE, for the example the Black Monday on October 1s9, 1987, the July 2, 1997 crash triggered by the Asian financial crisis, the burst of the dot-com bubble leading to a three years sluggish activities from March 10, 2000 and the two years long bear run of the market from 2007-2009. The data has been analyzed using the WBMFDFA method and also through a correlation analysis of the fluctuations in the random matrix theory framework.
3.2 Time-frequency localized correlation analysis
Analysis and investigation of correlations of the fluctuations over different frequency windows ( where is the frequency) can provide us with insight into the spectral behavior of the market correlations thereby improving our understanding of the collective behavior of the market in different time spans. For example, if the correlations between different scrips representing different sectors of the market in short time windows (high frequency, low scale) is low, then this could be exploited to guard the simultaneous crashes of different sectors in the event of a crisis. However, if the scrips are correlated in the low frequency limit, then the long term correlations of the market could lead to the “healing” of the market in a systematic and efficient way after a crash. This kind of information could be very useful for the policy makers in order to both monitor the economy as well provide for safe-guards against possible crashes.
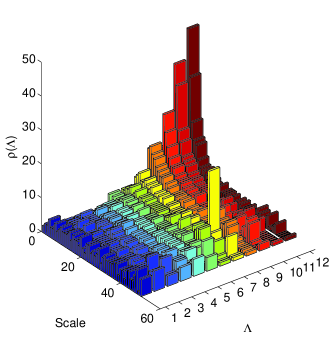
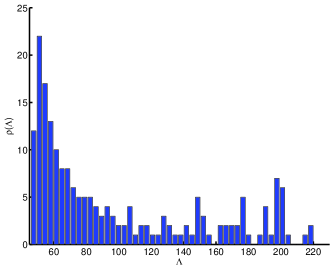
In order to understand the nature of spectral correlations in the market, we analyze the spectrum of the correlation matrices at different scales. In Fig. (1), we have shown the density of the unfolded eigenvalues of the correlation matrices of the fluctuations obtained at different scales. We observe from Fig. (1) that at lower and middle scales (upto ), the unfolded eigenvalue distribution is largely uniform and changes to fit the Eq. (17) at higher scales as shown in Fig. (1). Since in this analysis, we have looked at the behavior of the fluctuations over the whole time period , the value of is very large. We could expect that the correlations of such fluctuations will show significant deviations from the RMT prediction since it fits well in short time windowskumar2012 . We must remember that the fluctuations obtained by the WBFE method at characteristic of the frequency range (scale) under study. The spectral correlations under investigation here show that at high frequencies (low scales), the GOE fit of Eq. (17) is not followed by . However, at higher scales, that is at lower frequencies, the fits reasonably well with the Eq. (17).
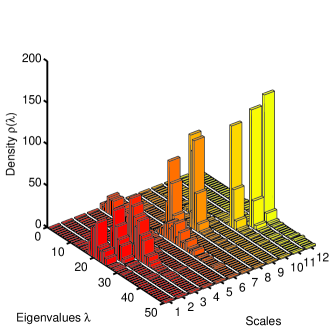
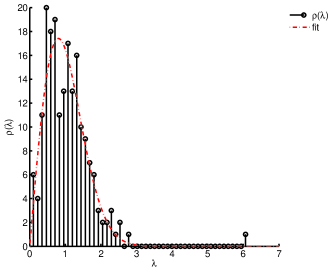
In Fig. 2, we have plotted the density of the eigenvalue spacing against different scales. It is clearly visible that at the lower and middle scales, the follows the RMT prediction well, which we have exemplified in Fig. 2 at scale . This is in contrast with the results in Fig. (1) suggesting that the eigenvalue spacing at lower scales is behaves differently from the eigenvalues themselves. This is an interesting observation which we believe should be explored in greater details.
4 Conclusion
To summarize, we have analyzed the nature of fluctuations from different sectors of the New York Stock Exchange (NYSE) through Wavelet based multi-fractal analysis and RMT based techniques. The number of companies being small, it is expected that there will be significant deviation from the RMT prediction. Interestingly, although the density of unfolded eigenvalues exhibited this behavior, the nearest-neighbor eigenvalue spacing distribution matched reasonably well with the RMT predictions at lower and middle scales. This points out that the spacing distribution can shed considerable light on the nature of the high frequency fluctuation correlation, for a smaller corpus of data.
In conclusion, wavelet analysis when combined with RMT approach can reveal considerable information about the correlations at different scales and is quite useful for modeling the behavior of high and low frequency components of physical processes.
References
- (1) B. Mandelbrot, J. Busi. 36(4), 394 (1963)
- (2) C.K. Peng, S.V. Buldyrev, S. Havlin, M. Simons, H.E. Stanley, A.L. Goldberger, Phys. Rev. E 49, 1685 (1994)
- (3) J.P. Bouchaud, M. Potters, Théorie des Risques Financiers, Aléa-Saclay, 1997; Theory of Financial Risks (Cambridge University Press, 2000)
- (4) R.N. Mantegna, H.E. Stanley, An Introduction to Econophysics: Correlations and Complexity in Finance (Cambridge University Press, Cambridge, 2000)
- (5) R. Mantegna, Eur. Phys. J. B 11, 193 (1999)
- (6) E.P. Wigner, The Annals of Mathematics 53(1), 36 (1951)
- (7) V. Plerou, P. Gopikrishnan, B. Rosenow, L.A.N. Amaral, H.E. Stanley, Phys. Rev. Lett. 83, 1471 (1999)
- (8) V. Plerou, P. Gopikrishnan, B. Rosenow, L.A.N. Amaral, T. Guhr, H.E. Stanley, Phys. Rev. E 65, 066126 (2002)
- (9) B. Mandelbrot, The fractal geometry of nature (Wheeler Freeman, San Francisco, USA, 1982)
- (10) L. Pietronero, E. Tosatti (eds.). Fractals in Physics (1986)
- (11) H.E. Stanley, P. Meakin, Nature 335, 405 (1988)
- (12) T. Dewey, Fractals in molecular biophysics (Oxford University Press, USA, 1997)
- (13) Y. Liu, P. Gopikrishnan, Cizeau, Meyer, Peng, H.E. Stanley, Phys. Rev. E 60, 1390 (1999)
- (14) N. Vandewalle, M. Ausloos, P. Boveroux, Physica A 269(1), 170 (1999)
- (15) J.W. Kantelhardt, E. Koscielny-Bunde, H.H. Rego, S. Havlin, A. Bunde, Physica A 295(3-4), 441 (2001)
- (16) J. Kantelhardt, S. Zschiegner, E. Koscielny-Bunde, S. Havlin, A. Bunde, H. Stanley, Physica A 316(1-4), 87 (2002)
- (17) P. Manimaran, P. Panigrahi, J. Parikh, Physica A 388(12), 2306 (2009)
- (18) L. Laloux, P. Cizeau, J.P. Bouchaud, M. Potters, Phys. Rev. Lett. 83, 1467 (1999)
- (19) D.J. Fenn, M.A. Porter, S. Williams, M. McDonald, N.F. Johnson, N.S. Jones, Phys. Rev. E 84, 026109 (2011)
- (20) I. Daubechies, Ten lectures on wavelets. 64 CBMS-NSF Regional Conference Series in Applied Mathematics (Society for Industrial Mathematics, 1992)
- (21) S. Mallat, et al., IEEE Transactions on Pattern Analysis and Machine Intelligence 11(7), 674 (1989)
- (22) M. Farge, Ann. Rev. Fluid Mech. 24(1), 395 (1992)
- (23) C. Torrence, G. Compo, Bull. Am. Met. Soc. 79(1), 61 (1998)
- (24) S. Ghosh, P. Manimaran, P.K. Panigrahi, Physica A 390, 4304 (2011)
- (25) A. Edelman, SIAM J. Matrix Anal. Appl. 9(4), 543 (1988)
- (26) T.H. Baker, P.J. Forrester, P.A. Pearce, J. Phys. A 31(29), 6087 (1998)
- (27) A.M. Sengupta, P.P. Mitra, Phys. Rev. E 60, 3389 (1999)
- (28) S. Kumar, N. Deo, arxiv (2012). 2012.0409