Long-term Variations of Solar Differential Rotation and Sunspot Activity: Revisited
Abstract
Long-term variations of solar differential rotation and sunspot activity are investigated through re-analyzing the data on parameters of the differential rotation law obtained by Makarov, Tlatov, and Callebaut (1997), Javaraiah, Bertello, and Ulrich (2005a, b), and Javaraiah et al. (2009). Our results indicate that the solar surface rotation rate at the Equator (indicated by the A parameter of the standard solar rotation law) shows a secular decrease since cycle 12 onwards, given by about (). The B parameter of the standard differential rotation law seems to also show a secular decrease since cycle 12 onwards, but of weak statistical significance. The rotation rate averaged on latitudes () does not show a secular trend of statistical significance. Moreover, the average sunspot area shows a secular increase of statistical significance since cycle 12 onwards, while a negative correlation is found between the level of sunspot activity (indicated by the average sunspot area) and the solar equatorial rotation in the long run.
keywords:
Rotation; Solar Cycle, Observations; Sunspots, Velocity1 Introduction
Solar differential rotation was discovered in 1630 when Christoph Scheiner first noticed that the solar equatorial region should rotate faster than higher latitude regions: 26 days at the solar Equator and 30 days at latitude of the Sun (Le Mouel, Shnirman, and Blanter, 2007). Since the basic work of Carrington on solar rotation, many studies have been made to investigate the solar differential rotation using different data and different methods, which can be divided into two kinds: the tracer method and the spectroscopic method (Balthasar and Wohl, 1980; Ternullo, Zappala, and Zuccarello, 1981; Balthasar, Vazquez, and Wohl, 1980; Arevalo et al., 1982; Gilman and Howard, 1984; Howard, Gilman, and Gilman, 1984; Balthasar et al., 1986; Sheeley, Nash, and Wang, 1987; Tuominen, and Virtanen, 1987; Nash, Sheeley, and Wang, 1988; Zappala, and Zuccarello, 1989; Snodgrass and Ulrich, 1990; Brajsa et al. ,1992; Japaridze and Gigolashvili, 1992; Sheeley, Wang, and Nash, 1992; Komm, Howard, and Harvey, 1993a, 1993b; Rybak, 1994; Ulrich and Bertello, 1996; Brajsa et al., 1997; Meunier, Nesme-Ribes, and Grosso, 1997; Brajsa et al., 1999, 2000; Howe et al., 2000a, b; Wohl and Schmidt, 2000; Antia and Basu 2001; Howe et al., 2001; Brajsa et al., 2002; Stix, 2002; Altrock, 2003; Heristchi and Mouradian, 2008). For a survey of the main results of different measurements of the solar differential rotation, please see the review papers of Howard (1984), Schroter (1985), Snodgrass (1992), Beck (1999), and Paterno (2010), shown in which is a great achievement in the observations and analyses of the solar surface differential rotation. Now, it is generally believed that the solar differential rotation drives the solar dynamo for generating solar magnetic activity (Babcock, 1961). However, the role of the differential rotation as a participant in the cycle of magnetic activity variation is not yet clear. Hence, the study of variations in the solar differential rotation is important for understanding the Sun’s internal dynamics and the variations in the solar magnetic activity, as well as for finding the cause of the variations in the differential rotation (Javaraiah, Bertello, and Ulrich, 2005a; Chu et al., 2010).
Variation in the solar differential rotation is an open question at present. For example, there are different and even contrary results for the long-term variation of solar rotation rate (Li et al., 2011a, b). Lustig (1983), Howard (1984), Heristchi and Mouradian (2008), and Li et al. (2011a, b) found that the general trend of the rotation rate of cycles should seemingly increase in the long run, but the contrary result is obtained by Balthasar et al. (1986), Kitchatinov (1999), Zuccarello and Zappala (2003), Brajsa et al. (2004), Javaraiah, Bertello, and Ulrich (2005a), and Brajsa, Ruzdjak, and Wohl (2006). In this study, we use the measurements of differential rotation given by Makarov, Tlatov, and Callebaut (1997), Javaraiah, Bertello, and Ulrich (2005a, b), and Javaraiah et al. (2009) to investigate long-term evolution of solar differential rotation and the level of sunspot activity.
2 Long-term Variations in the Solar Rotation and Activity
2.1 Long-term Variations of the Solar Differential Rotation
The solar differential rotation can be determined from the heliographic positions and the epochs of the observations of large number of sunspots or sunspot groups using the standard form:
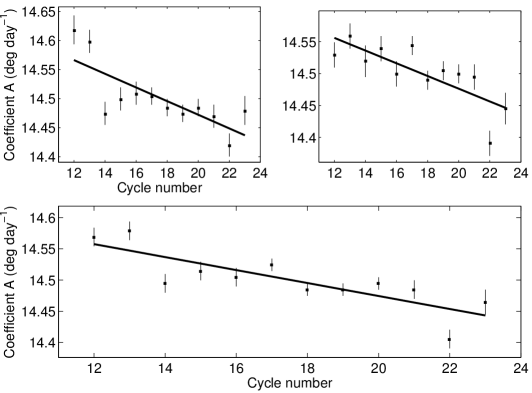
where is the solar sidereal angular velocity at latitude , and the coefficients and represent the equatorial rotation rate and the latitudinal gradient of the rotation, respectively (Howard, 1984; Javaraiah et al., 2003). These two coefficients are inferred through a best fit to the data of observations. Javaraiah, Bertello, and Ulrich (2005a) used the Greenwich data on sunspot groups during the period of 1879 January 1 1976 December 31 and the spot group data from the Solar Optical Observing Network (SOON) during the period of 1977 January 1 2004 August 10 to determine the the coefficients and in each of cycles 12 to 23, and the results were given in the Table 1 of Javaraiah, Bertello, and Ulrich (2005a). Based on the table, we plot here in Figure 1 the parameter of a solar cycle the number of the cycle, respectively in the northern, the southern, and the two (both the northern and southern) hemispheres. The unit of rotation rate originally in the table, is changed into by that . A linear regression is taken between them respectively in the northern, the southern, and the two hemispheres, and resultantly, the correlation coefficients are -0.7713, -0.7811, and -0.8246, respectively. These three correlation coefficients are all statistically significant at the confidential level. Thus, for the solar surface rotation rate at the Equator there exists a secular decrease of statistical significance. The secular slope is , , and (), respectively. If the period length of a solar cycle is approximately taken to be 11 years, then the secular slope is , , and (), respectively.
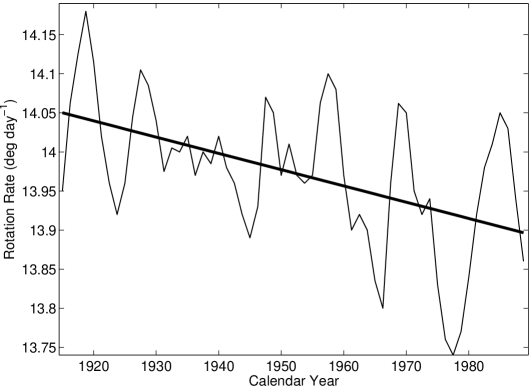
The differential rotation of the large-scale magnetic fields was once investigated through studying the synoptic charts during the years 1915 to 1990 by Makarov, Tlatov, and Callebaut (1997) and Kitchatinov et al. (1999). Based on the Figure 3 of Makarov, Tlatov, and Callebaut (1997), we plot here again in Figure 2 the time-dependent rotation of the large-scale magnetic fields at the solar Equator. A linear regression is taken for the temporal rotation, and the correlation coefficient is -0.4945, which is statistically significant at the confidential level. Thus, for the solar surface angular velocity at the Equator there exists a secular decrease of statistical significance. The secular decrease is ().
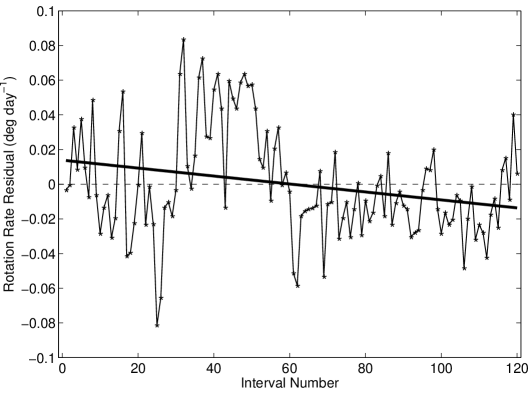
Javaraiah et al. (2009) used the daily values of the equatorial rotation rate () derived from the Mt. Wilson Doppler measurements during the period of 1985 December 3 to 2007 March 5, and they obtained the 61-day binned time series of the sidereal values. The 61-day interval was chosen due to the existence of data gaps. Based on the Figure 3 of Javaraiah et al. (2009), we plot again here in Figure 3 the 61-day binned time series of the sidereal values. A linear regression is taken for the time series, and the correlation coefficient is -0.2533, which is statistically significant at the confidential level. Thus, for the solar surface rotation rate at the Equator there exists a secular decrease of statistical significance. The decrease is ().
Although different methods and data are used, the aforesaid three studies all indicate that for the solar surface rotation rate at the Equator there exists a secular decrease of statistical significance since cycle 12 onwards, and the secular decrease is about ().
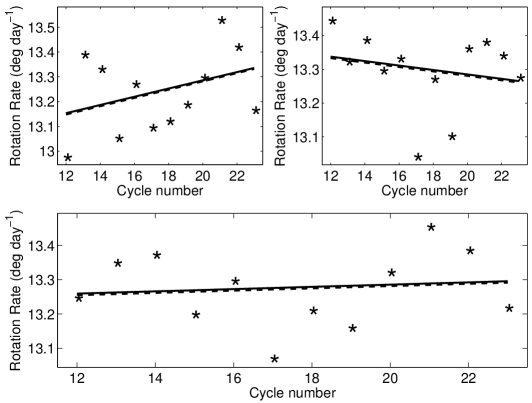
Based on the Table 1 of Javaraiah, Bertello, and Ulrich (2005a), we plot in Figure 4 the solar surface angular velocity of a cycle the number of the cycle, respectively in the northern, the southern, and the two hemispheres. The rotation angular velocity () of a cycle is taken as the average of over latitudes of . A linear regression is taken between them respectively in the northern, the southern, and the two hemispheres, and resultantly, the correlation coefficients are 0.3628, -0.2038, and 0.1083, correspondingly, which are all insignificant. If the rotation angular velocity () is taken as the average of over latitudes of , then the corresponding correlation coefficient is 0.3625, -0.2027, and 0.1095, respectively, with very slight changes, indicating that the taken latitude range should have a very slight influence. Thus, for the solar surface rotation rate on an average of latitudes, there is not a secular trend of statistical significance.
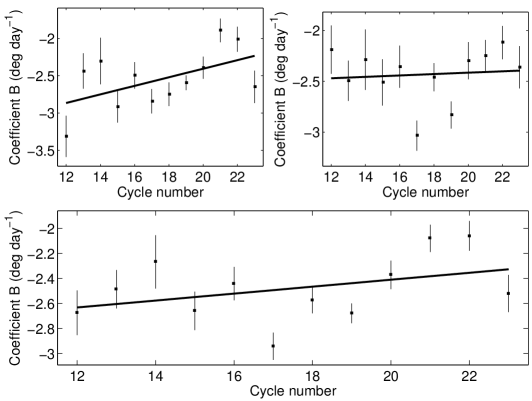
Based on the Table 1 of Javaraiah, Bertello, and Ulrich (2005a), we plot in Figure 5 the parameter of a solar cycle the number of the cycle, respectively in the northern, the southern, and the two hemispheres. A linear regression is taken between them respectively in the northern, the southern, and the two hemispheres, and resultantly, the correlation coefficients are 0.5301, 0.0936, and 0.3886, respectively. The first correlation coefficient is statistically significant at the confidential level, but the later two are insignificant. Thus, for the parameter there seems to exist a secular decrease since cycle 12 onwards, but of weak statistical significance.
3 Relation between the Solar Rotation and the Level of Sunspot Activity in the Long Run
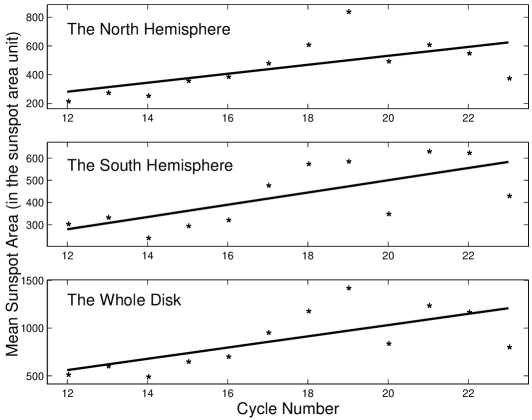
The monthly sunspot areas (in the sunspot area unit, namely, parts per million of the solar hemisphere) respectively in the northern, the southern, and the two hemispheres can be obtained from the NASA’s website111http://solarscience.msfc.nasa.gov/greenwch.shtml. They were complied by the Royal Greenwich Observatory during the period of the years 1874 to 1976 and by the Solar Optical Observing Network of the US Air Force /US National Oceanic and Atmospheric Administration from 1977 onwards. We calculate the mean value () of the monthly areas over a solar cycle for each of cycles 12 to 23, respectively in the northern, the southern, and the two hemispheres, which is shown in Figure 6. A linear regression is taken between the mean value and the corresponding cycle number, respectively in the northern, the southern, and the two hemispheres, and resultantly, the correlation coefficients are 0.6323, 0.6993, and 0.6851, respectively. These three correlation coefficients are all statistically significant at the confidential level. Thus, for sunspot activity there exists a secular increase of statistical significance.
Based on the Table 1 of Javaraiah, Bertello, and Ulrich (2005a), we investigate the relation of the mean value of the monthly sunspot areas over a solar cycle the parameter of the cycle for cycles 12 to 23, respectively in the northern, the southern, and the two hemispheres. A linear regression is taken between them respectively in the northern, the southern, and the two hemispheres, and resultantly, the correlation coefficients are -0.5962, -0.5771, and -0.5881, respectively. All these three correlation coefficients are statistically significant at the confidential level. Thus, there exists a negative correlation between the level of sunspot activity, indicated by the sunspot average areas and the solar equatorial rotation in the long run. That is to say, the more rapidly the Sun rotates at the Equator, the lower sunspot activity level is.
Based on the Table 1 of Javaraiah, Bertello, and Ulrich (2005a), we investigate the relation of the mean value of the monthly sunspot areas over a solar cycle the parameter of the cycle for cycles 12 to 23, respectively in the northern, the southern, and the two hemispheres. A linear regression is taken between them respectively in the northern, the southern, and the two hemispheres, and resultantly, the correlation coefficients are 0.3322, -0.1378, and +0.1356, respectively. All these three correlation coefficients are statistically insignificant. Thus, there exists no relation between the level of sunspot activity and the parameter , viewed in the long run.
Based on the Table 1 of Javaraiah, Bertello, and Ulrich (2005a), we plot in Figure 7 the mean value of the monthly sunspot areas over a solar cycle the solar surface angular velocity of the cycle, respectively in the northern, the southern, and the two hemispheres. The rotation angular velocity () is taken as the average of over latitudes of . A linear regression is taken between them respectively in the northern, the southern, and the two hemispheres, and resultantly, the correlation coefficients are 0.1897, -0.3710, and -0.0844, respectively. There exist both positive and negative coefficients, and further all these three values are statistically insignificant. Thus, there doesn’t exist a relation between solar activity of a cycle and the surface rotation rate of the cycle in the long run. If the rotation angular velocity () is taken as the average of over latitudes of , then the corresponding correlation coefficients are 0.1904, -0.3701, and -0.0835, respectively, with very slight changes, indicating that the taken latitude range should have a very slight influence.
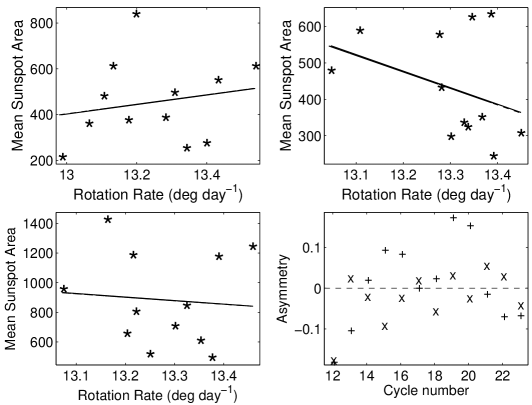
Solar-activity indexes vary over the solar disk, and various activity indexes cannot be considered to be symmetrical between the solar northern () and southern () hemispheres, it is the so-called asymmetry of solar activity (Chang 2008, 2009). To characterize the asymmetry of solar activity, it is traditionally normalized to the solar activity present in both the solar hemispheres and defined as follows: , where and stand for the values of the solar activity indicators considered corresponding to the northern and southern hemispheres, respectively. The asymmetry of sunspot area in each of cycles 12 to 23 was given by Li et al. (2002), and Li et al. (2009), which is also shown here in Figure 7. Based on the table of Javaraiah, Bertello, and Ulrich (2005a), the asymmetry of the average solar rotation angular velocity in each of cycles 12 to 23 is calculated and shown in the figure. Here, The rotation angular velocity () is taken as the average of over latitudes of . If solar activity of a cycle is statistically related to the surface rotation rate of the cycle, their asymmetry values should statistically have the same sign when the two have the same secular trend, or the opposite sign when the two have the opposite trend. As the figure shows, sunspot areas obviously have the same sign of asymmetry values as surface rotation rates have in three cycles, cycles 12, 19, and 23, while clearly having the opposite sign in eight cycles, cycles 13, 14, 14, 16, 18, 20, 21, and 22. Thus, there seems no correlation between the asymmetries in sunspot average area and the average rotation rate in the period analyzed. If the rotation angular velocity () is taken as the average of over latitudes of , then the same sign of the asymmetry is obtained as when the average of is over latitudes of .
4 Conclusion and Discussion
Javaraiah, Bertello, and Ulrich (2005a) used the Greenwich data on sunspot groups during the period of 1879 January 1 1976 December 31 and the spot group data from the Solar Optical Observing Network (SOON) during the period of 1977 January 1 2004 August 10 to determine the coefficients and in the standard form of the differential rotation. They studied long-term variations in solar differential rotation and sunspot activity. Makarov, Tlatov, and Callebaut (1997) investigated the differential rotation of the large-scale magnetic fields through the synoptic charts during the years 1915 to 1990. Javaraiah et al. (2009) used the daily values of the equatorial rotation rate () derived from the Mt. Wilson Doppler measurements during the period of 1985 December 3 to 2007 March 5. They obtained the 61-day binned time series of the sidereal values. In this study, we use the above three kinds of data to revisit the relationship between the long-term variations of solar differential rotation and the level of sunspot activity.
Although different methods and data are used, the aforesaid three studies all indicate that for the solar surface rotation rate at the solar Equator there exists a secular decrease of statistical significance since cycle 12 onwards, and the secular decrease is about ().
The parameter represents the differentiation degree of the surface differential rotation: the larger the absolute is, the more pronounced the differential rotation is. For the parameter there seems to also exist a secular decrease since cycle 12 onwards, but of weak statistical significance. For the solar surface rotation rate on an average of latitudes, there is not a secular trend of statistical significance. That is to say, the rotation angular velocity is changed from having a significant secular trend to having no secular trend, when latitudes are considered from the Equator to higher latitudes. It is known that sunspots with different property, such as size, life time and so on, appear in different phase of a solar cycle and in different latitudes. Thus, the observed changes of rotation by various tracers couldn’t represent a global variation of the solar rotation, that is to say, they are caused by some specific property of the tracer used. This is probably the reason why different secular trends are found by different data and different methods. And as pointed out by Brajsa, Ruzdjak, and Wohl (2006), the spatial-temporal interplay can often be hidden in the results by various tracers used, and a straightforward comparison of different results is quite difficult.
We calculate the mean value of the monthly areas over a solar cycle for each of cycles 12 to 23, and find that it has a secular increase of statistical significance. For the cycle-to-cycle variations of sunspot activity and the solar equatorial rotation, there is a negative correlation between the two in the long run. The more rapidly the Sun rotates at the Equator, the lower sunspot activity level is.
Our results show no relation between the level of sunspot activity and the parameter , viewed in the long run, and there doesn’t exist a relation between solar activity level of a cycle and the surface rotation rate of the cycle in the long run.
Acknowledgements
We thank the anonymous referees for their careful reading of the manuscript and constructive comments which improved the original version of the manuscript. This work is supported by the Natural Science Funds of China (10873032, 10921303, 11147125, and 11073010), the 973 programs 2011CB811406 and 2012CB957801, and the Chinese Academy of Sciences.
References
- Altrock (2003) Altrock, R.C.: 2003, Sol. Phys. 213, 23.
- AntiaandBasu (2001) Antia, H.M., Basu, S.: 2001, ApJ 559, L67.
- Arevalo, Gomez, Vazquez, Balthasar, and Wohl (1982) Arevalo, M.J., Gomez, R., Vazquez, M., Balthasar, H., Wohl, H.: 1982, A&A, 111, 266.
-
Babcock (1961)
Babcock, H.W.: 1961,
apj 133, 572. - BalthasarandWohl (1980) Balthasar, H., Wohl, H.: 1980, A&A 92, 111.
- Balthasar, Vazquez, and Wohl (1980) Balthasar, H., Vazquez, M., Wohl, H.: 1986, A&A 155, 87.
- Brajsa, Ruzdjak, Vrsnak, Pohjolainen, Urpo, Schroll, andWohl (1997) Brajsa, R., Ruzdjak, V., Vrsnak, B., Pohjolainen, S., Urpo, S., Schroll, A., Wohl, H.: 1997, Sol. Phys. 171, 1.
- Brajsa, Ruzdjak, Vrsnak, Wohl, Pohjolainen, and Urpo (1999) Brajsa, R., Ruzdjak, V., Vrsnak, B., Wohl, H., Pohjolainen, S., Urpo, S.: 1999, Sol. Phys. 184, 281.
- Brajsa, Ruzdjak, Vrsnak, Wohl, Pohjolainen, and Urpo (2000) Brajsa, R., Ruzdjak, V., Vrsnak, B., Wohl, H., Pohjolainen, S., Urpo, S.: 2000, Sol. Phys. 196, 279.
- Brajsa, Ruzdjak, and Wohl (2006) Brajsa, R., Ruzdjak, D., Wohl, H.: 2006, Sol. Phys. 237, 365.
- Brajsa, Vrsnak, Ruzdjak, Bozic, Pohjolainen, Terasranta, and Urpo (1992) Brajsa, R., Vrsnak, B., Ruzdjak, V., Bozic, H., Pohjolainen, S., Terasranta, H., Urpo, S.: 1992, Hvar. Obs. Bull. 16, 13.
- Brajsa,Wohl, Ruzdjak,and Schawinski-Guiton (2004) Brajsa, R., Wohl, H., Ruzdjak, D., Schawinski-Guiton, K.: 2004, Hvar. Obs. Bull. 28, 55.
- Brajsa,Wohl,Vrsnak,Ruzdjak, Sudar, Rosa, andHrzina (2002) Brajsa, R., Wohl, H., Vrsnak, B., Ruzdjak, D., Sudar, D., Rosa, D., Hrzina, D.: 2002, Sol. Phys. 206, 229.
- Chang (2008) Chang, H.Y.: 2008, New Astron. 13, 195.
- Chang (2009) Chang, H.Y.: 2009, New Astron. 14, 133.
- chu (2010) Chu, Z., Zhang, J., Nie, Q. H., Li, T.: 2010, Sol. Phys. 264, 1.
- Gilman and Howard (1984) Gilman, P., Howard, R.: 1984, ApJ 283, 385.
- Heristchi and Mouradian (2008) Heristchi, D., Mouradian, Z.: 2008, A&A 497, 835.
- Howard (1984) Howard, R.: 1984, Annual Review of Astronomy and Astrophysics, 22, 131.
- Howard, Gilman, and Gilman (1984) Howard, R., Gilman, P.A., Gilman, P.I.: 1984, ApJ 283, 373.
- Howe,Christensen-Dalsgaard, Hill, Komm, Larsen, Schou, Thompson, and Toomre (2000a) Howe, R., Christensen-Dalsgaard, J., Hill, F., Komm, R.W., Larsen, R.M., Schou, J., Thompson, M.J., Toomre, J.: 2000a, Science, 287, 2456.
- Howe,Christensen-Dalsgaard, Hill, Komm, Larsen, Schou, Thompson, and Toomre (200b) Howe, R., Christensen-Dalsgaard, J., Hill, F., Komm, R.W., Larsen, R.M., Schou, J., Thompson, M.J., Toomre, J.: 2000b, ApJ 533, L163.
- Howe,Hill, Komm,Christensen-Dalsgaard, Larsen, Schou, Thompson, and Toomre (2001) Howe, R., Hill, F., Komm, R.W., Christensen-Dalsgaard, J., Larsen, R. M., Schou, J., Thompson, M.J., Toomre, J.: 2001, in P. Brekke, B. Fleck, and J. Gurman (eds.), IAU Symp. 230, Astron. Soc. Pac, San Francisco, p. 40.
- Japaridze and Gigolashvili (1992) Japaridze, D.R., Gigolashvili, M.Sh.: 1992, Sol. Phys. 141, 267.
- Javaraiah (2003) Javaraiah, J.: 2003, Sol. Phys. 212, 23.
- Javaraiah,Bertello,and Ulrich (2005a) Javaraiah, J., Bertello, L., Ulrich, R.K.: 2005a, ApJ, 626, 579.
- Javaraiah,Bertello, and Ulrich (2005b) Javaraiah, J., Bertello, L., Ulrich, R.K.: 2005b, Sol. Phys. 232, 25.
- Javaraiah,Ulrich, Bertello, and Boyden (2009) Javaraiah, J., Ulrich, R.K., Bertello, L., Boyden, J.E.: 2009, Sol. Phys. 257, 61.
- Kitchatinov,Pipin, Makarov, and Tlatov (1999) Kitchatinov, L. L., Pipin, V. V., Makarov, V. I., Tlatov, A.G.: 1999, Sol. Phys. 189, 227.
- Komm,Howard, and Harvey (1993a) Komm, R.W., Howard, R.F., Harvey, J.W.: 1993a, Sol. Phys. 143, 19.
- Komm,Howard, and Harvey (1993a) Komm, R.W., Howard, R.F., Harvey, J.W.: 1993b, Sol. Phys. 145, 1.
- Le Mouel,Shnirman, and Blanter (2007) Le Mouel, J.L., Shnirman, M.G., Blanter, E.: 2007, Sol. Phys. 246, 295.
- Li (2009) Li, K.J., Chen, H.D., Zhan, L.S., Li, Q.X., Gao, P.X., Mu, J., Shi, X.J., Zhu, W.W.: 2009, J. Geophys. Res. 114(A04101), doi:10.1029/2009JA014061
- Li (2002) Li, K.J.,Wang, J.X., Xiong, S.Y., Liang, H.F., Yun, H.S., Gu, X.M. 2002, A&A 383, 648.
- Li,Liang,Feng, and Zhan (2011a) Li, K.J., Liang, H.F., Feng, W., Zhan, L.S.: Ap&SS 331, 441.
- Li,shi,Liang,Zhan, Xie, and Feng (2011b) Li, K.J., Shi, X.J., Liang, H.F., Zhan, L.S., Xie, J.L., Feng, W.: ApJ 730, 49.
- Lustig (1983) Lustig, G.: 1983, A&A 125, 355.
- Makarov, Tlatov, and Callebaut (1997) Makarov, V.I., Tlatov, A.G., Callebaut, D.K.: 1997, Sol. Phys. 170, 373.
- Meunier,Nesme-Ribes, and Grosso (1997) Meunier, N., Nesme-Ribes, E., Grosso, N.: 1997, A&A 319, 673.
- Nash,Sheeley, and Wang (1988) Nash, A.G., Sheeley, N.R.Jr., Wang, Y.M.: 1988, Sol. Phys. 117,359.
- Paterno (2010) Paterno, L.: 2010, Ap&SS, 328, 269.
- Rybak (1994) Rybak , J.: 1994, Sol. Phys. 152, 161.
- Schroter (1985) Schroter, H.E.: 1985, Sol. Phys. 100, 141.
- Sheeley, Nash, and Wang (1987) Sheeley, N.R.Jr., Nash, A.G., Wang, Y.M.: 1987, ApJ 319, 481.
- Sheeley,Wang, and Nash (1982) Sheeley, N.R.Jr., Wang, Y.M., Nash, A.G.: 1992, ApJ 401, 378.
- Snodgrass (1992) Snodgrass, H.B.: 1992, in The Solar Cycle, ed. K. L. Harvey, ASP Conf. Ser., 27, 205.
- Snodgrass and Ulrich (1990) Snodgrass, H.B., Ulrich, R.K.: 1990, ApJ 351, 309.
- Stix (2002) Stix, M.: 2002, The Sun, Springer-Verlag, Berlin, p. 277
- Ternullo, Zappala, and Zuccarello (1981) Ternullo, M., Zappala, R.A., Zuccarello, F.: 1981, Sol. Phys. 74, 111.
- Tuominen and Virtanen (1987) Tuominen, I., Virtanen, H.: 1987, IN: The internal solar angular velocity: Theory, observations and relationship to solar magnetic fields, Proceedings of the Eighth Summer Symposium, Dordrecht, D. Reidel Publishing Co., 83.
- Ulrich and Bertello (1996) Ulrich, R.K., Bertello, L.: 1996, ApJ 465, L65.
- Wohl and Schmidt (2000) Wohl, H., Schmidt, W.: 2000, A&A 357, 763.
- Wilson (1988) Wilson, R.M.: 1988, Sol. Phys. 115, 397.
- Zappala and Zuccarello (1989) Zappala, R.A., Zuccarello, F.: 1989, Societ Astronomica Italiana, Memorie 60, 161.
- Zuccarello and Zappala (2003) Zuccarello, F., Zappala, R.A.: 2003, Astron. Nachr. 324, 464.