Characterizing Ranked Chinese Syllable-to-Character Mapping Spectrum: A Bridge Between the Spoken and Written Chinese Language
ABSTRACT:
One important aspect of the relationship between spoken and written Chinese is the ranked syllable-to-character mapping spectrum, which is the ranked list of syllables by the number of characters that map to the syllable. Previously, this spectrum is analyzed for more than 400 syllables without distinguishing the four intonations. In the current study, the spectrum with 1280 toned syllables is analyzed by logarithmic function, Beta rank function, and piecewise logarithmic function. Out of the three fitting functions, the two-piece logarithmic function fits the data the best, both by the smallest sum of squared errors (SSE) and by the lowest Akaike information criterion (AIC) value. The Beta rank function is the close second. By sampling from a Poisson distribution whose parameter value is chosen from the observed data, we empirically estimate the -value for testing the two-piece-logarithmic-function being better than the Beta rank function hypothesis, to be 0.16. For practical purposes, the piecewise logarithmic function and the Beta rank function can be considered a tie.
1 Introduction
Chinese language has been considered to be one of the hardest to learn languages for non-natives, or at least, “strikingly different” to an European language speaker (Wang, 1973). For spoken Chinese, a sound (syllable) consists of a consonant initial (e.g. h), a vowel final (e.g. ao), and one of the four intonations (e.g., the dipping intonation 3: hao3). Although the syllables are now written in Roman/Latin alphabets under the pinyin system, and are pronounced similarly as many Romance/Latin languages, the four distinct intonations (changing of pitch contour) do not match a similar system in Western languages. For written Chinese, the level of degeneracy can be high. One-to-one correspondence between ideogram or character and syllable is rare, such as the example of neng2 which has only one character and one meaning of “can”, “to be able of”, while tens of characters per syllable is common. Besides these complications, each character may have several meanings depending on the context.
The many-to-one mapping from a sound in spoken Chinese to characters in written Chinese crucially contributes to the complexity of the Chinese language. The term “polymorphous” can be used to describe the situation where many characters are mapped to one syllable. The terms “homophone” (Sakuma et al., 1998; Su, 2002) and “heterograph” (Su, 2001; Chang and Zhang, 2003) used in linguistics describe similar situations, though these are used at the word level. Homophome emphasizes the aspect of the same pronunciation, whereas heterograph emphasizes the difference in writing.
In order to characterize numerically this polymorphous feature of Chinese language, we ask the following question: on average, how many written characters correspond to a toned syllable? The next quantitative linguistic question is: if the number of characters per syllable is ranked for all syllables (with intonation), termed “syllable-to-character mapping spectrum”, does the decrease of this measurement with rank follow a particular functional form?
There are around 400 syllables in spoken Chinese ignoring intonation (some syllables are rare, and/or used only in a colloquial form). When intonation is considered, the number of syllables should be multiplied by 4, of the order of 1600. The number of Chinese characters included in a given dictionary, however, is not fixed. Besides a core group of commonly used characters, which can be in the range of low thousands (e.g. 3000 covered by primary school textbook: http://zd.diyifanwen.com/zidian/szb/), the total number can be as high as 50,000 60,000. This uncertainty of the total number of Chinese characters is reminiscent of the uncertainty of the total number of English words described under the “large number of rare event” model (Baayen, 2002).
Besides these, two more facts should be considered in counting the number of characters. First, some characters are only used in classic literature while rarely used in modern Chinese. Second, a set of simplified characters (roughly 2000) were introduced in 1964 in mainland China (http://www.china-language.gov.cn/wenziguifan/managed/002.htm), which co-exist with the “traditional” characters used in Taiwan and oversea Chinese communities. Also, to consider Chinese as a single language from both the written and spoken language perspective obviously ignores the diversity of spoken Chinese dialects. Here we focus only on one spoken and one written Chinese – the Manderin (or putonghua, or Pekingese) (Wang, 2012; Shen, 2011).
In a previous study, the ranked syllable-to-character mapping spectrum is analyzed without considering intonation (Li, 2012). Two dictionaries were used with very different number of entries: a small dictionary with 9212 characters, and a larger online dictionary with 21783 characters. Despite the size difference of the two dictionaries, the ranked syllable-to-character mapping spectra after normalization are virtually identical (Li, 2012). Based on this observation, we will only use one dictionary for the current analysis that includes intonation.
For a ranked syllable-to-character mapping spectrum, the -axis is the rank of syllables, rank-1 for the most polymorphous syllable (with the most number of characters pronounced in the same way), and lowest ranks for the less polymorphous syllables. The -axis is the normalized number of characters per syllable. The main result from (Li, 2012) is that when the -axis is logarithmically transformed, the fall-off of the spectrum is close to a straight line, indicating a logarithmic functional form. However, the Beta rank function (Mansilla et al., 2007; Naumis and Cocho, 2008; Martínez-Mekler et al., 2009) is shown to be even better in fitting the data (Li, 2012), if only slightly better. In this paper, we will examine whether the same conclusion still holds when intonation-included syllables are considered.
Different functional forms of syllable-to-character mapping spectrum provide numeric characterization of the fall-off from the polymorphic to the monomorphic (one-to-one) syllables. Such quantitative characterization should play a similar role as the Zipf’s law in characterizing the word usage in languages (Zipf, 1935). Not only such function makes the estimation of mean, median, variance easier, but also it helps to prioritize the learning of the language, and perhaps provide hints on the evolution of the interplay between the written and spoken Chinese.

2 Data and Methods
Modern Chinese Small Dictionary: The 4th edition of XianDai HanYu Xiao CiDian (translated as Modern Chinese Small Dictionary), published by The Commercial Press in 2006, collected 9212 characters, from 1280 intonation-included syllables. The number of toned syllables is less than because some intonation on certain sound do not exist. No traditional characters are included if the corresponding simplified character is already in the dictionary. Because some characters can be pronounced in multiple ways, the number of uniquely pronounced character count is 9505.
An intonation-included syllable is written in pinyin followed by one of the four numbers (1,2,3,4) for the four intonations of the level, raising, dipping, and falling tones. For example, hao1, hao2, hao3, hao4, with the consonant initial h, vowel final ao, plus four intonations. An alternative notation for the four intonations is hāo, háo, hǎo, hào for the four tones.
Logarithmic function and piecewise linear logarithmic function: Denote the number of characters per syllable for rank- syllable, and rank ranges from high () to low (). The can be normalized to . Given the data { , } (), a simple fitting function is the logarithmic function:
| (1) |
with one fitting parameter ( is constrained by the normalization condition ). A piecewise logarithmic function consists of multiple logarithmic fitting functions, one for each rank range, e.g.:
| (2) |
where is the partition rank point separating the two logarithmic functions for high-ranking and low-ranking ranges. A piecewise function can be continuous or not. To force the continuity for the above two-piece logarithmic function, one requires . Without continuity requirement, the number of fitting parameters in the two-piece logarithmic function is 4: , and the continuity requirement reduces that number by 1, to 3.
Beta rank function: The Beta function was proposed in (Mansilla et al., 2007; Naumis and Cocho, 2008; Martínez-Mekler et al., 2009) for fitting ranked plots:
| (3) |
where and are two fitting parameters (scaling exponents). Beta function Eq.(3) is a modification from the power-law function where . The best known power-law function for ranked data is the Zipf’s law of word usages (Zipf, 1935). Note that Eq.(3) shares a similar form as the Beta distribution , but it is not a probability density distribution.
Nonlinear regression: We use the (http://www.r-project.org/) package nls for non-linear least square procedure used in regressions (Bates and Watts, 1988). This non-linear procedure requires an initial value of the parameters, and the best fit is achieved numerically. Choosing the appropriate initial parameter values is important if there are multiple local optimal solutions. We first use a linear regression on the transformed variable, (where , to obtain an estimation of the parameter values. Then these estimations of and (and ) are used as the initial condition for the non-linear regression.
Regression performance: Given the data (), the fitting performance of a function is measured by sum of squared errors (SSE):
| (4) |
Although SSE increases with the number of points (), for the purpose of comparing two or several functions on the same dataset, the value of is the same, and it is not necessary to normalize (divide by ) SSE.
Model selection by AIC: Since functions with more fitting parameters should be able to fit the data no worse than those functions with less number of free parameters, SSE itself can not be used to compare two functions with different number of parameters. One method to discount the effect of extra parameter is to penalize the number of parameters. The Akaike Information Criterion (AIC) (Akaike, 1974) subtracts a term from the log-maximum-likelihood that is twice the number of parameter (). In the regression context, it can be shown that under the condition of unknown variance of the noise, AIC is equal to (Venables and Ripley, 1999):
| (5) |
Among different fitting functions, the one with the smallest AIC is the best model, either due to smaller error SSE or due to fewer number of parameters .
To compare two AIC’s for two different fitting functions, we have:
| (6) |
Suppose the second function fits the data better than the first function but utilizing more parameters, then the first term in Eq.(6) is negative, but the second term is positive. Only when the magnitude of the negative term is large enough to compensate the second positive term, is the second function selected.
Simulated data from Poisson distribution: One can simulate a syllable-to-character mapping spectrum based on the observed one. For a syllable with characters, we can treat as the mean of a Poisson distribution: Pois(). Note that the standard deviation of Poisson distribution is and the lowest possible value is 0 (as a comparison, if we use the normal distribution in simulation, we may have negative count values). From the observed { } (), a new set sampled from the Poisson distribution { } is generated. We then remove points with and re-rank them which becomes one replicate of the simulated dataset. This process is repeated 1000 times.

3 Results
Simple Statistics: The top-ranking syllables with largest numbers of characters are yi4 (83), xi1 (76), bi4 (58), yu4 (57), fu2 (52). The next 10 polymorphic syllables (rank to 15) are zhi4 (50), ji4 (48), li4 (47), yu2 (45), ji1 (43), qi2 (39), shi4 (39), jue2 (36), ji2 (34), hui4 (34). There are 203 syllables with only one character (one-to-one, monomorphic). The mean number of characters per toned syllable () is 7.4 (=9505/1280), median number is 5, standard deviation is 7.6, and median-absolute-deviation (MAD) is 3. The range mean standard deviation (0, 15.185) covers 88.3% of all syllables, whereas the range median MAD (2, 8) covers only 37.1%.
Fig.1 shows the histogram of the number of characters per syllable , which summarizes all the above statements in a graph. Note that the statistical numbers will be dictionary-dependent as governed by the “large number of rare event” model (Baayen, 2002), but the shape of the histogram in Fig.1 is expected to remain similar.
Another way to describe the uneven distribution of the number of characters per syllable is how much the characters are covered under the top % of the most polymorphic syllables. For example, top 1% of top syllables contain 7% of all characters, 5% contain 21%, 10% contains 33%, and top 25% contains 59%. The “few polymorphic syllables but large amount of monomorphic syllables”, non-Gaussian-like (Clauset et al., 2009), distribution in Fig.1 also points to an uneven rank distribution.
Ranked distribution of the number of characters per syllable: Like so many phenomenological laws in quantitative linguistics, a better and smoother description of the data is by ranking the data points in order (Li et al., 2010). We rank syllables by their values, from large to small, and the resulting rank plot is in Fig.2 in four different versions: regular (linear-linear), ()log-linear, linear-()log, and log-log. Fig.2(A) and Fig.2(C) shows that the rank function is neither linear nor exponential. Fig.2(B) indicates that a logarithmic or piece-wise logarithmic function might be good fitting functions. Fig.2(D) hints that a power-law function can not fit the data well, but a modified one, such as the Beta rank function, might fit the data better (Li, 2012).
Related to the uneven distribution of , Fig.2 can also be converted to a Lorenz curve (not shown) for calculating the Gini coefficient. In Lorenz curve, the -axis is a cumulation of the number of syllables (from 0 to 100%) and -axis is a cumulation of the number of characters (also from 0 to 100%). If all syllables have the same number of characters, the Lorentz curve will overlap with the diagonal line. Gini coefficient () is defined as twice the area between the diagonal line and the Lorenz curve. means a complete equality among syllables, and the complete inequality. The Gini coefficient for this dataset is by the function gini in the R reldist package (Handcock and Morris, 1999). This function is an implementation of the formula: .
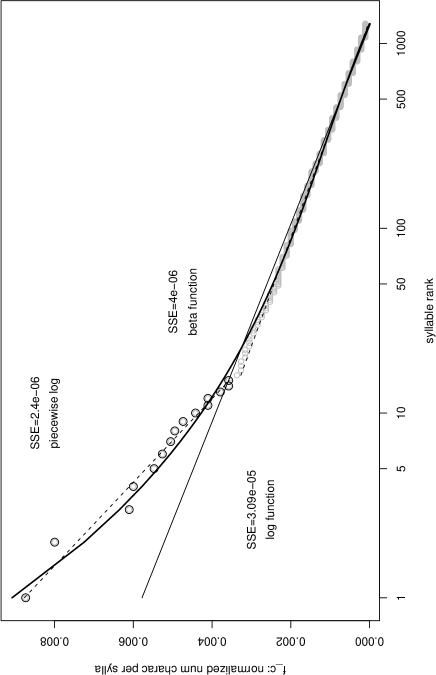
Fitting the ranked distribution of number of characters per syllable – logarithmic function and piecewise logarithmic function: The best fit logarithmic function of ranked shown in Fig.3 is . From Fig.3, the fitting function clearly under-estimates the for top-ranking syllables, which is compensated by over-estimation of at low-ranking tails (there are many more low-ranking syllables than the high-ranking ones).
Fig.3 strongly suggests that the data can be split into two rank ranges, one for high-ranking syllables (from to ) and another for the rest (). Interestingly, the histogram of in Fig.1 does show that top 15 syllables (yi4, xi1, bi4, yu4, fu2, zhi4, ji4, li4, yu2, ji1, qi2, shi4, jue2, ji2, bui4) seem to be outliers with respect to the more continuous distribution for other syllables. For simplicity, we apply the two-piecewise logarithmic functions without requiring continuity. The logarithmic function fitting the top 15 syllables is , and that for the rest is . Indeed, the slope of the first function is steeper than the second.
Fitting the ranked distribution of number of characters per syllable – Beta rank function: The less than perfect fitting of the logarithmic function in Fig.3 calls for the use of two-parameter functions, as previously advocated by us in (Li et al., 2010). The Beta function (Mansilla et al., 2007; Naumis and Cocho, 2008; Martínez-Mekler et al., 2009) has been proven to be a robust function that fits well diverse types of ranked linguistic data Li et al., (2010). Fig.3 shows the best-fit Beta function by non-linear regression (in thick solid line):
| (7) |
The fact that the fitting value is larger than indicates that unlike the situation of Zipf’s law, the power-law function is not a good fitting function of this data. More discussion on the meaning of relative magnitude of and can be found in (Alvarez-Martinez et al., 2011), and discussion on the range-limited rank variable versus range-open rank variable can be found in (Li, 2012).
Comparison of curve fitting performance and model selection: Both Beta function and piecewise logarithmic function seem to fit the data better than the one-piece logarithmic function. To quantify the fitting performance, we use SSE as the measure of discrepancy and AIC to compare models. SSE’s of piecewise logarithmic, Beta, and logarithmic functions are , and respectively, confirming that piecewise logarithmic and Beta function are both better than the logarithmic function, with piecewise logarithmic function even better.
The low SSE value for the piecewise logarithmic function is not affected by the continuity requirement. If the continuity condition is imposed and the low-ranking syllables are fitted first, SSE can be 2.76 , 2.63 , or 2.53 if the converging point is at . If the high-ranking syllables are fitted first, then SSE values are much worse (6.80 , 5.56 , 4.54 ).
The calculation of AIC is tricky for the piecewise logarithmic function. Even though is not fitted by the data, it is however chosen by inspecting Fig.2(B). If we use the AIC of Beta function () as the baseline value, AIC of logarithmic function () is larger by 2629, and AIC of piecewise logarithmic function (without continuity) () is smaller by 659. The first term in Eq.(6), is so large that even if the more severe penalty of model complexity is imposed (e.g. Bayesian information criterion, BIC (Schwarz, 1976)), the piecewise logarithmic function is still selected.

Noise and significance: To check the robustness of the model comparison result, we create replicates of simulated data that are closely related to the observed one, in order to check how often the same result holds. The proportion of replicates that lead to the opposite conclusion from the observed data is the empirical -value. The simulated data is sampled from the Poisson distribution with the observed number-of-character per syllable () as the mean. It is well known that the mean and the variance of the Poisson distribution is the same, thus the standard deviation is .
For each replicate of Poisson distribution based syllable-to-character mapping spectrum, SSE from the Beta rank function and SSE from the piecewise logarithmic function are calculated. For the SSE from the Beta rank function, we again use the nonlinear regression with the results from linear regression as the initial condition. For SSE from the piecewise logarithmic functions, we treat the segmentation rank as a running variable, from 2 to 1/5 of the maximum rank, and the with the best SSE is chosen. The continuity between the two logarithmic functions is enforced, and the high-ranking syllables are fitted first.
Fig.4 shows the histogram, from the simulation by Poisson distribution, of the first term in the AIC difference (Eq.(6)) between the two fitting functions: , where SSE2 is for the two-piece logarithmic function, SSE1 for the Beta rank function, and the number of syllables with nonzero number of characters (due to random sampling, a Pois() distribution has a high chance to sample a zero value). The majority of these values are negative, and 15% are positive. Since is only 1, it can be shown from Fig.4 that at most 1% of the replicates have any chance to compensate the negative term by larger 2 for AIC or larger for BIC. This leaves 0.16 as our rough estimation of the -value, or the significance in testing the hypothesis that two-piece logarithmic function is better than the Beta rank function.
Discussions
Both spoken and written languages change with time. It is pointed out in (Wang, 1973) that spoken Chinese evolves with a faster speed than written Chinese. Thus a character may be pronounced in a different way in ancient Chinese from that in modern Chinese. The drifting of pronunciation may introduce a flux, both in and out, in values. On the other hand, ancient characters are often out of favor in modern Chinese. This however may not cause a problem because the rarely used characters are still in the dictionary. How syllable-to-character mapping spectrum change with time is an interesting question of which we do not yet know an answer.
The conclusion reached in (Li, 2012), that the Beta rank function fits the syllable-to-character mapping spectrum better than the logarithmic function remains true when intonation of syllables is considered, despite a 4-fold expansion in the -axis. However, we have a new conclusion that the piecewise logarithmic function fits the data even better than the Beta rank function.
Although this conclusion seems to be solid by a rigorous model selection technique, the difference of fitting performance between the two is actually very small (2.36 vs. 3.95 ). The rank range ( to ) covered by the second logarithmic function is only 1.2% of the total in linear scale and 37.8% in log-scale. These can be used in an argument against the claim that the outperformance by the piecewise logarithmic function is real. Indeed, the empirical -value of 0.15-0.16 obtained by simulation via a Poisson distribution, shows that the statistical evidence is relatively weak, as the standard criterion for rejecting a hypothesis, with the implication of accepting another hypothesis, is to have a -value smaller than 0.5.
The relative fitting performance can be sensitive to small changes in the data. We notice that the high-ranking syllables are outliers in the distribution of in Fig.1. Outliers tend to be not reproducible, or have larger variability, which implies we may not reproduce the same 15 values in a replicated run. The main intention of our simulation is to randomize the value of outliers by a Posson distribution. Examining the top-ranking syllable yi4 in Table 1, for example, shows that only 24 or so characters are more commonly used in the modern Chinese, others are mostly obscure characters. Some are so rare that a Chinese reader may not encounter them in her lifetime. Using an even smaller dictionary will reduce for all syllables, of course, but the effect on the top ranking ’s is less predictable.
In conclusion, we would like to show that it is interesting to study the functional form of the syllable-to-character spectrum which connects the spoken and written Chinese. While two-piece logarithmic functions apparently outperforms the Beta rank function in our data, simulation shows that 15%-16% of the time the Beta function may outperform the two-piece logarithmic function.
Acknowledgements
I would like to thank Jianmin Bai, Pedro Miramontes for helpful comments and suggestions.
References
- Wang, (1973) WSY Wang (1973), “The Chinese language”, Scientific American, 2:53-62.
- Sakuma et al., (1998) N Sakuma, S Sasanuma, IF Tatsumi, S Masaki (1998), “Orthography and phonology in reading Japanese kanji words: evidence from the semantic decision task with homophones”, Memory & Cognition, 26:75-87.
- Su, (2002) X Su (2002), “A further consideration on the conventional principle for the standardization of homophones: on the three aspects in the standardization of homophones” (in Chinese), Applied Linguistics, 2002(2):20-26.
- Su, (2001) X Su (2001), “Treatment of heterographs in ’Modern Chinese Dictionary’ and some thoughts on the current lexical standardization” (in Chinese), Applied Linguistics, 2001(3):88-94.
- Chang and Zhang, (2003) Z Chang and Z Zhang (2003), “A heterograph is nonsense-variants of lexeme” (in Chinese), Applied Linguistics, 2003(3):41-46.
- Baayen, (2002) RH Baayen (2002), Word Frequency Distributions (Kluwer Academic Publishers, Dordrecht, The Netherlands).
- Wang, (2012) WSY Wang (2012), A Billion Voices: Languages and People of China (World Scientific).
- Shen, (2011) Z Shen (2011), “The origin of Manderin”, Journal of Chinese Linguistics, 39:1-31.
- Li, (2012) W Li (2012), “Fitting Chinese syllable-to-character mapping spectrum by the Beta rank function”, Physica A, 391:1515-1518.
- Mansilla et al., (2007) R Mansilla, E Köppen, G Cocho, P Miramontes (2007), “On the behavior of journal impact factor rank-order distribution”, Journal of Informetrics, 1:155-160.
- Naumis and Cocho, (2008) GG Naumis and G Cocho (2008), “Tail universalities in rank distributions as an algebraic problem: The beta-like function”, Physica A, 387:84-96.
- Martínez-Mekler et al., (2009) G Martínez-Mekler, RA Martínez, M Beltrán del Río, R Mansilla, P Miramontes, G Cocho (2009), “Universality of rank-ordering distributions in the arts and sciences”, PLoS ONE, 4:e4791.
- Zipf, (1935) GK Zipf (1935), The Psycho-Biology of Languages (Houghton-Mifflin: Boston, MA, USA).
- Bates and Watts, (1988) DM Bates and DG Watts (1988), Nonlinear Regression Analysis and Its Applications (Wiley).
- Akaike, (1974) H Akaike (1974), “A new look at statistical model identification”, IEEE Trans. Automatic Control, 19:716-722.
- Venables and Ripley, (1999) WN Venables, BD Ripley (1999) Modern Applied Statistics with S-PLUS, 2nd edition, (Springer-Verlap: New York, USA)
- Clauset et al., (2009) A Clauset, CR Shalizi, MEJ Newman (2009), “Power-law distributions in empirical data”, SIAM Review, 51:661-703.
- Li et al., (2010) W Li, P Miramontes, G Cocho (2010), “Fitting ranked linguistic data with two-parameter functions”, Entropy, 12:1743-1764.
- Handcock and Morris, (1999) MS Handcock, M Morris (1999), Relative Distribution Methods in the Social Sciences (Springer-Verlag).
- Alvarez-Martinez et al., (2011) R Alvarez-Martinez, G Martínez-Mekler, G Cocho (2011), “Order-disorder transition in conflicting dynamics leading to rank-frequency generalized beta distribution”, Physica A, 390:120-130.
- Schwarz, (1976) G Schwarz (1976), “Estimating the dimension of a model”, Annals of Statistics, 6:461-464.