On statistical researches of parliament elections in the Russian Federation, 04.12.2011
Yury Neretin
There is a lot of statistical researches of Russian elections 04.12.2011. The purpose of this activity is to give a mathematical proof of large falsifications and to estimate possible ’real results of elections’. My purpose is to show that
1. Statistical argumentation allows to prove existence of falsifications and to give a lower estimate of falsification, near 1 percent (may be, slightly more).
2. Statistical proofs of stronger statements are incorrect from both points of view of mathematics and of natural sciences.
3. Apparently, this problem is not a problem of pure mathematics (since it includes strong indeterminacy of sociological nature).
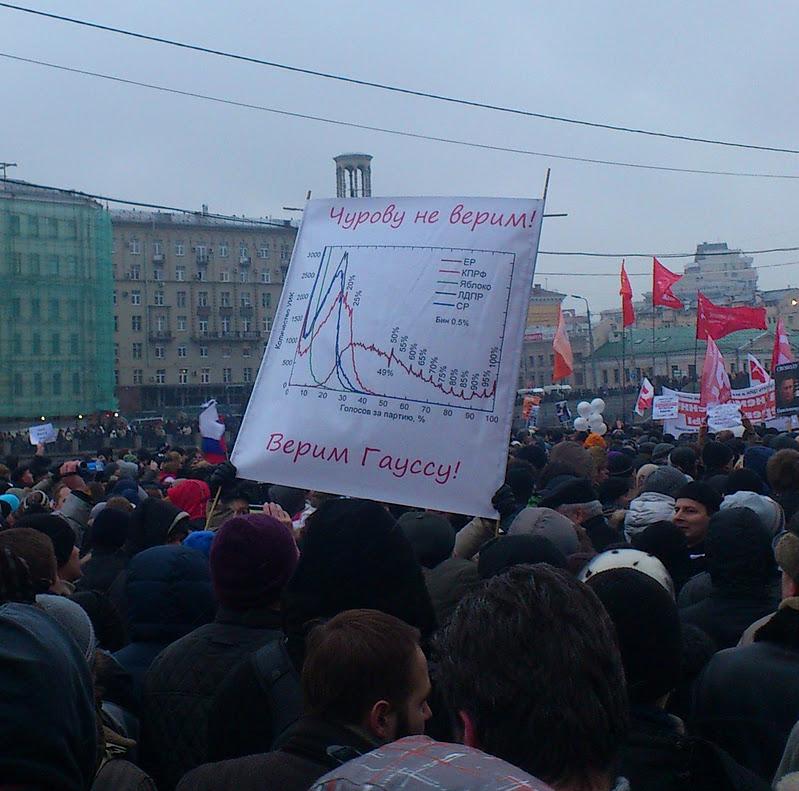
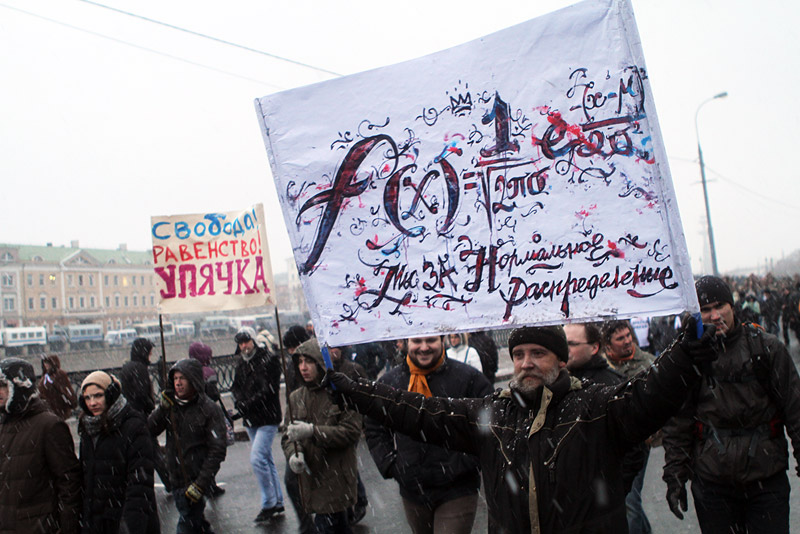
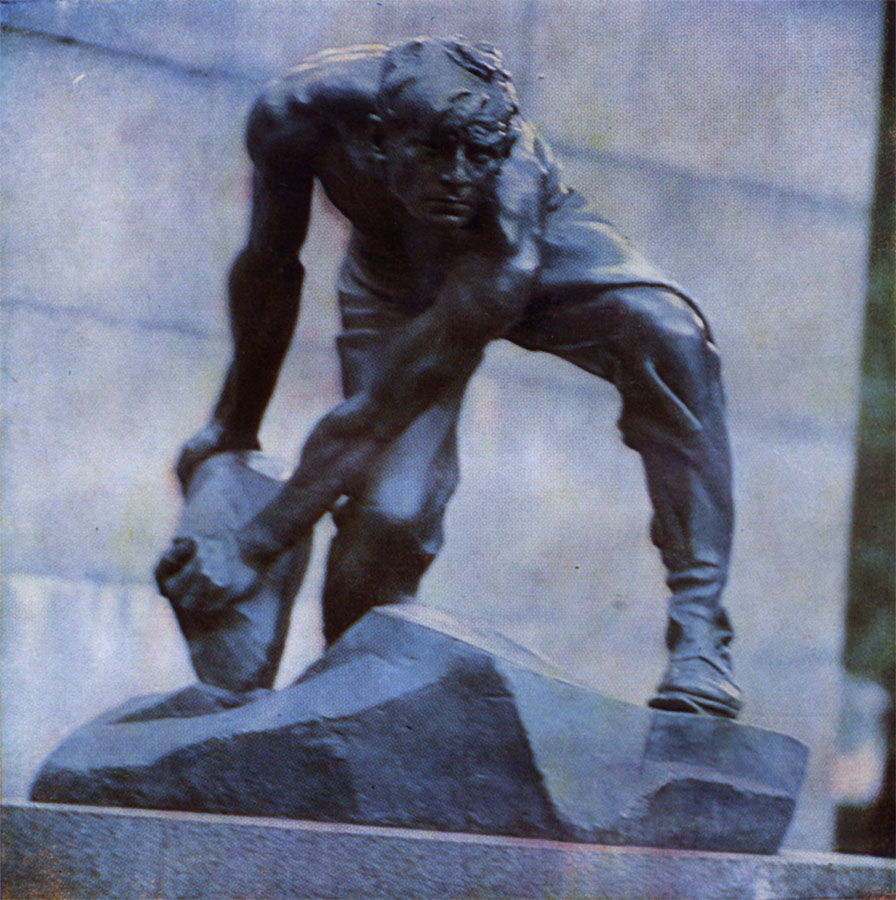
This is an elementary note about statistical researches of Russian parliament elections 04.12.2011 and about statistical mistakes (this is not a text about elections and electoral falsifications!). Such kind of researches with mathematical slogans occupied Russian newspapers and Russian Internet (as livejournals, etc.), they are reflected in some Western editions as Washington Post111 See [10] and Wall Street Journal. There are also mathematical slogans and posters on meetings222See preprint Simkin [10]. The Russian scientific newspaper ’Troitskij variant’ 20.12.2011 [3] was begun by a banner ’Gauss instead of cobblestone’, explanation for a non-Russian reader is given below on Figure 26.. Texts of such level can not be a subject of scientific reviews or scientific discussions. On the other hand such review seems necessary.
However, two similar papers [11], [12] of Dmitry Shpilkin were published in two Russian serials of scientific community, the electronic journal Za-nauku.ru and the newspaper Troitskij variant. This makes reviewing possible333On the history of his argumentation, see [9]..
Contents
1. Samples. Peculiar properties of the modern Russian Federation and of the Duma elections, December 2011.
2. Existence theorem of falsifications.
3. Non-Gaussian distributions.
4. Distribution of voting turnout.
5. Correlations between voting turnout and results of voting.
6. Is Moscow metropolis homogeneous?
7. Final remarks.
References
Addendum 1. Regional statistics.
Addendum 2. Voting stations with given results of United Russia.
Shpilkin [11], [12] produces several statistical distributions (the detailed discussion is below) and says that they can not be obtained by the usual electoral process. Therefore, these odd distributions detect falsifications.
We use contra-arguments of 3 types:
A. Simple arguments of pure mathematics.
B. Experiments. Since we have methods of detection of electoral falsifications, we can apply them to other countries. The results are challenging…
C. Oddities of statistical distributions admit natural alternative explanations. Sometimes such explanations are self-obvious, sometimes their verifications lead to sociological problems.
1 Samples.
Peculiar properties
of the modern Russian Federation
and of the Duma elections, December 2011
Before a discussion of statistical distributions we need some preliminary remarks about properties of samples.
A. Parties
1.1. Parliament (Duma) voting is organized according party lists (no voting for individual candidates). Each party has a federal list of candidates and regional lists. Total number of position of a party in the parliament is determined by the global voting. The final regional distribution of parliamentarians depends on regional election results.
1.2. List of political parties. Main parties444Their political orientations is no matter for this note. (which were present in the previous Duma and will be present in the next Duma)
UR (the United Russia) — the party of power;
CPRF — the Communist Party of the Russian Federation;
LDPR — the Liberal-Democratic Party of Russia (party of Zhirinovsky);
JR — the Just Russia.
Additional parties:
the Yabloko - declares itself as a party of ’intelligent’555A specific Russian social stratum (интеллигенция), dictionaries usually give a non-precise English translation ’intellectual’.;
RC — the Right Cause;
PR – the Patriots of Russia.
1.3. Results of elections.
UR — 49.32,
CPRF — 19.19,
LDPR — 11.67,
JR — 13.24.
These 4 parties will be represented in the parliament. UR gets an absolute majority in the parliament (238 positions from 450). The remaining parties
Yabloko - 3.43,
PR - 0.97,
RC - 0.60
are not represented in the parliament due to the 5-percent barrier666A party that receive less than 5% is not represented in parliament.
1.4. Informal comments. Existing list of parties does not represent neither social strata, nor possible political programs. Proper constituent bodies of oppositional parties are small.
Part of electorate considers the oppositional parties as hidden (or visible) hands of the party of power, only CPRF is free from such suspicions.
B. Inhomogeneity and exceptional regions
1.5. Russia is an extremely territorially inhomogeneous country (this is a traditional property of Russia during the whole its history).
Modern economical, social, and demographic situations strongly vary along the country. The same holds for the confidence in the local powers, local influence of oppositional parties, and local oppositional leaders.
Inhomogeneity preserves on the level of regions (there is difference between cities, small towns, villages, etc.; even in different towns situation can be different).
1.6. Social inequality in the modern Russia is essentially larger than in modern Western countries.
1.7. Social situation in Russia was seriously changed during the last two years, 2010-2011.
1.8. Exceptional regions. According the Constitution777http://www.constitution.ru/en/10003000-04.htm, the Russian Federation contains two types of regions. The regions of the first kind are called oblast, kray888In official English translation of the Constitution they are called ’regions’, ’territories’. (55 regions), cities of Federal importance (2 regions). The regions of the second kind are national autonomies, they are named republics (21 regions), autonomous okrugs999Official English translation is ’autonomies’. (4 regions), autonomous oblast (1 region).
Below we do not discuss ’autonomous okrugs’, because their populations are small (by their definition). They are extreme north regions with mining industry.
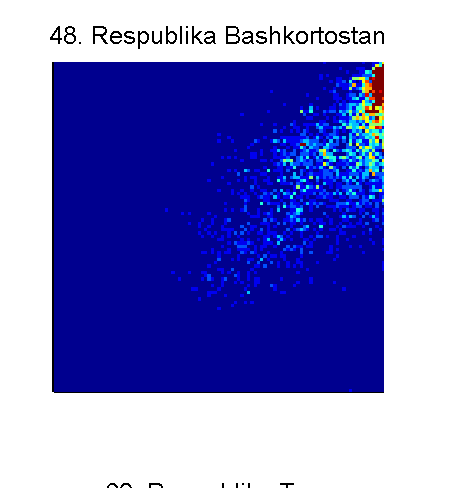
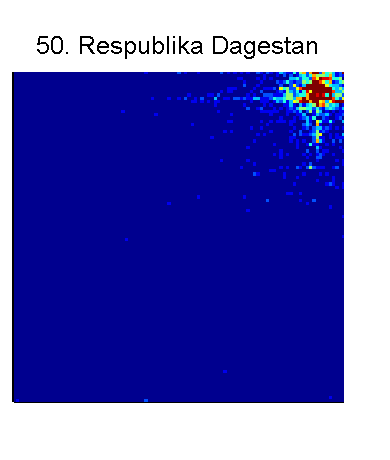
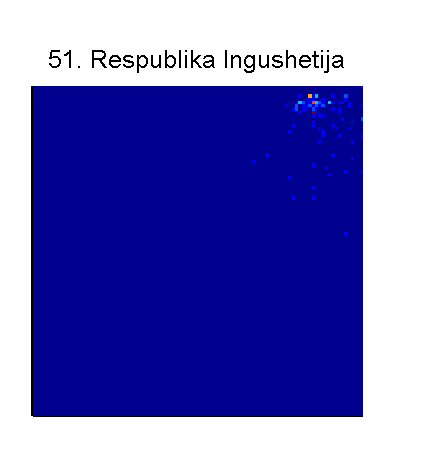
’Republics’ are different. Republics with Christian Orthodox title nations usually are similar to Russian regions. Some of the remaining ’republics’ are ethnocracies or have strong ethnocratic tendencies, it seems that their aristoi have strong positions with respect to the central government. Below we use the term exceptional regions101010I give a definition of exceptional objects in political terms, however they are distinguished in the table in the next section, also see below Figures 22 and 23 for such republics.
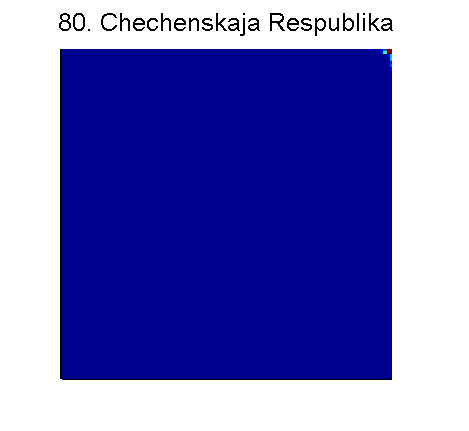
Chechenia is a local dictatorship inside Russia. Other exceptional regions are essentially softer, but their powers are sufficiently strong to organize voting in their own interests.
1.9. Results of voting in the exceptional regions. Here we present the list of regions (excluding ’natsionalnyj okrugs’), where the dominant party ’United Russia’ received more than 2/3 percents of voices111111The complete table of regions is contained in Addendum 1.. We also present the voting turnout (column 3). The last column contains the percent of voters for United Russia with respect to the total amount of electors. In brackets we write total number of electors (in millions).
| The Republic of Chechenia (0.6) | 99.5 | 99.5 | 99.0 |
| The Republic of Mordovia (0.7) | 91.6 | 94.2 | 86,3 |
| The Republic of Dagestan (1.6) | 91.4 | 91.2 | 83.6 |
| The Republic of Ingushetia (0.2) | 91.0 | 86.4 | 78.6 |
| The Karachaevo-Cherkesskaya Republic (0.3) | 89.8 | 93.2 | 74.7 |
| The Republic of Tyva (0.2) | 86.3 | 85.1 | 73.4 |
| The Republic of Kabardino-Balkaria (0.5) | 81.9 | 98.4 | 80,6 |
| The Republic of Tatarstan (3.0) | 77.8 | 79.5 | 61.9 |
| The Republic of Bashkortostan (2.9) | 70.5 | 79.3 | 55.9 |
| The Republic of North Osetia (0.5) | 67.9 | 85.8 | 58.3 |
| The Tambov oblast (0.9) | 66.7 | 68.3 | 45.6 |
This list contains only two non-exceptional regions, (agricultural) Tambov oblast (on the low boundary of 2/3 with relatively small voting turnout) and the Republic of Mordovia, whose ’result’ seems completely ’mysterious’.
The total percent of voices for United Russia in the whole country is 49.3, the voting turnout is 60.2121212We have . In this sense the Tambov oblast is more similar to ordinary regions than to the exceptional ’republics’. See Addendum 1.. The total amount of electors is 109.2 millions.
The total number of voices for United Russia was millions. The exceptional regions (plus the Republic of Mordovia) gave United Russia millions .
The exceptional regions plus the Republic of Mordovia (totally near millions of electors, near percents) produce numerous exotic properties of electoral statistical distributions.
Consider Russia without the exceptional regions. Then the result of UR is 44.3% (the relative loss of the party is , i.e. 10% of collected voices). Certainly, without the exceptional regions UR could not receive the absolute majority in the parliament.
It seems that nobody believes in the results of elections in the exceptional regions, however such discussion is not a question of mathematics131313It can happened that real percents of voting for United Russia in some republics were relatively large, but smaller than it was ’drawn’. Voting turnout is even more impressive.. Local aristoi are interested to send their representatives to the Federal parliament, to demonstrate their own power to local population of regions, and to show to the central government both a loyalty and a force.
.
2 Existence theorem for falsifications
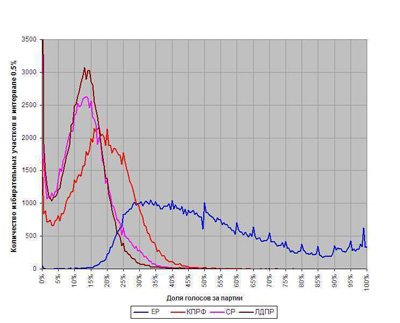
2.1. Argument 1. Dents. D.Shpilkin [11], [12] for 4 main parties evaluates number of voting stations with a given percent of voices for a party. He get 4 graphs given on Figure [11]. We call such figures as station-voting diagrams.
Certainly, dents on 50, 60, 65, 70, …percents is a sufficient argument for existence of falsifications. It is clear that electoral commissions tried to achieve these ’important’ numbers.
Kobak [6] claims that dents give lower estimate141414This 1% is partially due to the exceptional regions. Doubtless (by non-mathematical reasoning), the exceptional regions produced more than 1 percent… .
However, we discuss this more carefully (d’apres Kuznetsov and Kobak)
2.2. Unexpected obstacle. Kuznetsov [7] presents the same station-voting diagram in another resolution, the step is percents.
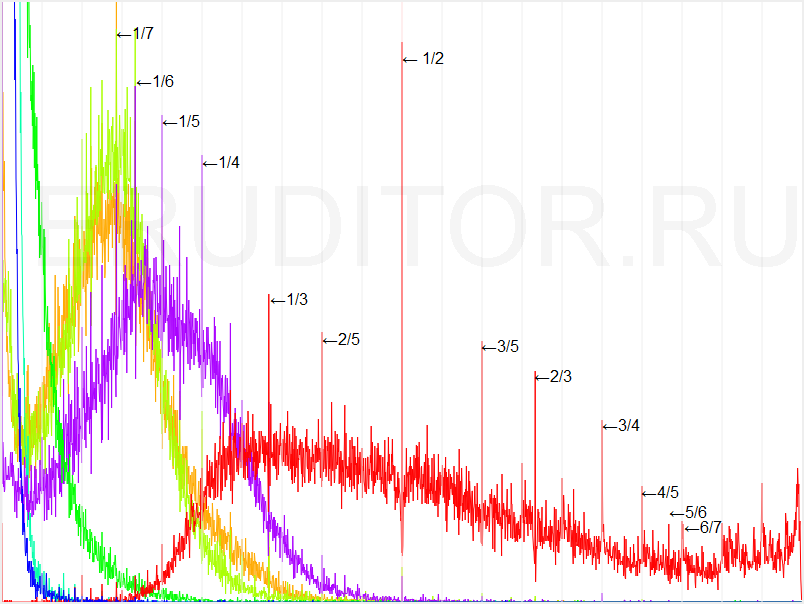
We observe numerous dents on graphs corresponding to fractions with small numerators
.
Apparently, such dents are artifacts
corresponding to small voting stations151515Consider a voting station with electors. Possible results of a party
is with . But is repeated among possible fractions approximately
times. On the other hand, 1/2 has a neighborhood free of fractions with denominator
. Also, fractions, close to have large denominators.
Kuznetsov [7] presents
results of numerical stimulation of a coin-flip voting on small voting stations. This produces
sharp-toothed graph instead of expected constant..
Therefore dents at , , , , on
Figure 1 partially correspond to small stations. However, small stations can be easily
eliminated, see Figure 3161616We observe a substantial transformation of the UR-graph.
This shows existence of huge number of small voting stations,
for instance, in villages, in hospitals, in frontier posts, some military objects,
on ships, in pre-trial detection centers….
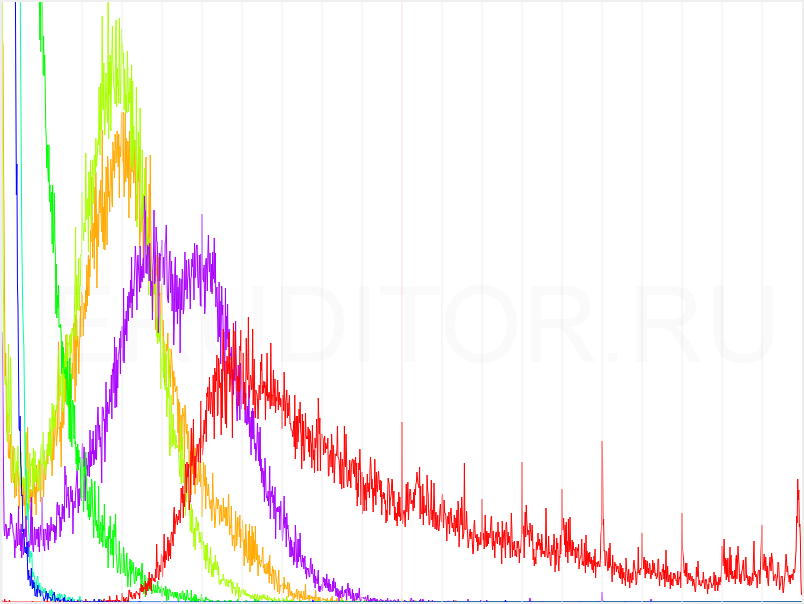
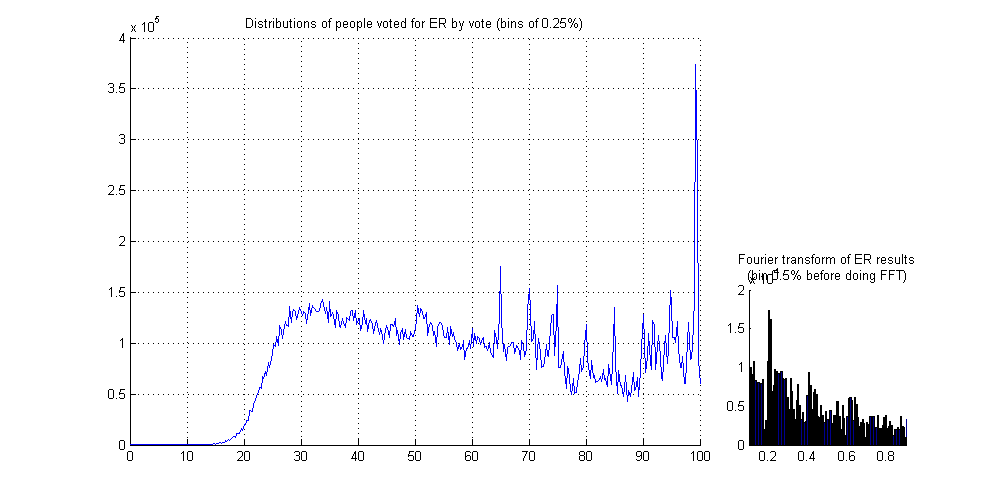

Dent at 50% survive, but the dent at 60% almost disappears. However, the similar picture with resolution 0.5 percents was given by Kobak (more precisely, he presents the number of voices for UR). Figure 4 shows that 60-percent peaks disappears and 50-percent becomes problematic…
Thus dents at fractions and disappear. However it remains a periodic structure at values
Other rational numbers do not produce dents. It seems that it is impossible to invent an explanation except ’drawing’ of results of elections or upward rounding171717Apparently, it is interesting to draw histograms without small voting stations and histograms whose steps are not a divisor of 5 percents..
To avoid doubts, we present an impressive Figure 5 for the Republic of North Osetia and the Republic of Bashkortostan. Both regions are exceptional in the sense mentioned above.
2.3. Computer-generated graphics. Thus the initial reaction concerning dents was correct. However this discussion shows dangers hidden in completely convincing computer graphics.
3 Non-Gaussian distributions
3.1. The most common argument. This is:
Observation. Graphs on the station-voting diagram (Figure 1) are not Gaussian!
Corollaries:
1) This proves the global falsification.
2) We can estimate the real result of UR.
This was a topic of posters on meetings (see Figures 24, 25), this was multiplied in Internet thousands times, repeated by numerous journalists, this came to West newspapers.
But Gaussian distributions are produced by the Central Limit Theorem, it can not be applied to station-voting diagrams.
3.2. A remark. Let us imagine a Russian region voting by a coin flip; a citizen, which obtains ’head’, votes for UR. In this case, the distribution on the station-voting diagram is not Gaussian…
Indeed, consider all voting stations of a fixed size . The density of the corresponding distribution is
After mixing with respect to we get a density of the form
Assume that this density is Gaussian, i.e. . We change the variable and write the equation
Applying to the both sides we get
For a fixed we know all moments of the measure
Therefore,
where is the delta-function. Therefore, is a delta-measure. Thus, is a delta-measure.
Sizes of voting stations in Russia strongly vary (from 2-20 electors upto 3000). Therefore, for an ideal problem the station-voting diagram is not Gaussian.
However in this case we get a symmetric one-mode distribution.
3.3. Discussion. In spite of the previous remark, let us assume that Russia consists of two ideal regions with Gaussian distributions on their station-voting diagrams. In different regions, these distributions are different. Therefore we add two Gaussian densities. We can get a wavy line, see Figure 6.

Even if we get a function with one peak, the graph will be asymmetric.
Sum of many Gaussian summands is a graph of non-predictable form. For a homogeneous country (as Sweden) we apparently will get a Gaussian-like picture (something having one maximum and relatively symmetric). For strongly inhomogeneous Russia there are no reasons to expect a Gauss-like curve. See also argumentation in [10].
In note [8], I tried to explain to a reader familiar with modern life of the Russian Federation that an approximate form of graphs of main parties on Figure 1 seems to be realistic (if to keep in mind situation in the exceptional regions). Falsifications in ordinary regions deform graphs. Final results of elections depend on the precise positions of graphs on Figure 3.
Certainly, if we omit the exceptional regions from the considerations, then the form of UR-graph changes (it must be lower at the segment 65-100%). But it have to be non-Gaussian.
3.4. A station-voting distributions Gaussian in West countries? This was verified by several authors. Kuznetsov [7] presents station-voting diagrams for elections in Great Britain, 2010 (Figure 7), Kalinin [5] for Canada, blogger ’8cinq’ for Poland (Figure 8), blogger ’levrrr’ for Israel, (Figure 9). Graphs, which have no reasons to be Gaussian are not Gaussian. No mystery.
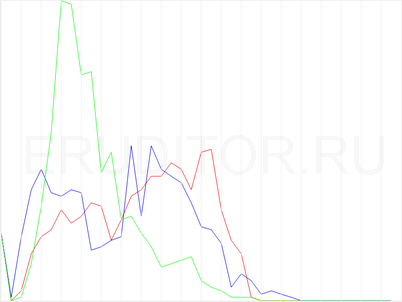
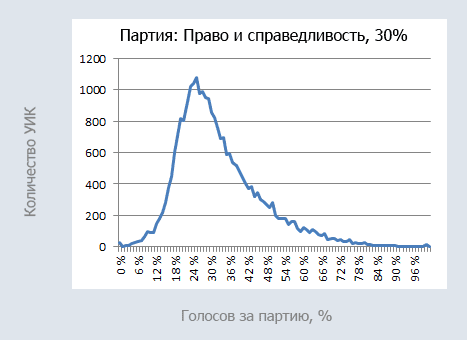
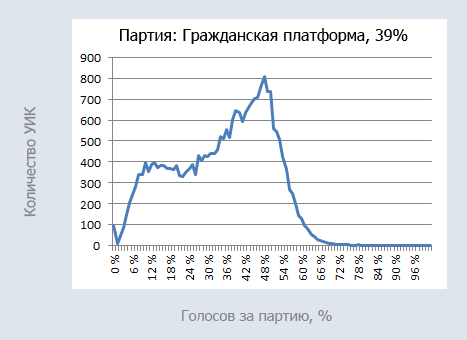
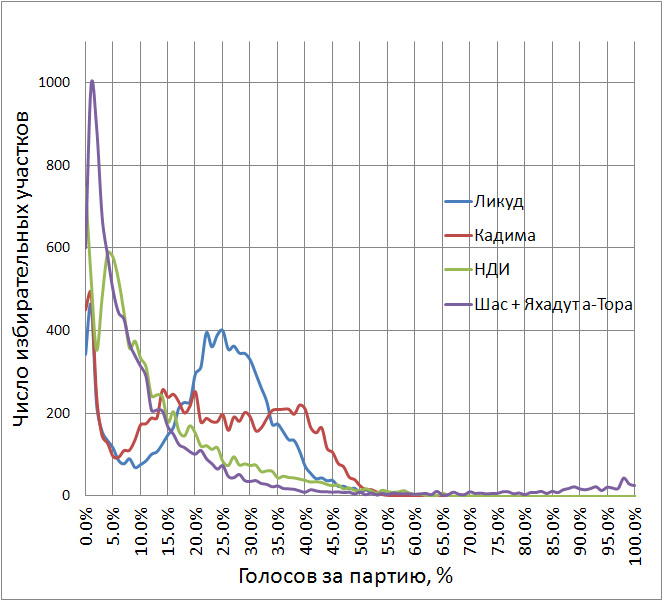
3.5. Computer-generated graphics again. It is interesting to compare Figures 1 and 3. Both distributions for UR are non-Gaussian. But the second figure is less impressive181818… and corresponds to real distribution of voices., and only the first picture can serve turn a meeting poster (see Figure 24).
4 Distributions of voting turnout
4.1. Distribution of turnout. Next, D.Shpilkin draws diagrams with distribution of turnout, i.e. he evaluates number of stations with a given turnout. He claims that the distributions in democratic countries are Gaussian (Figure 10) and in Russia they are not Gaussian (Figure 11).
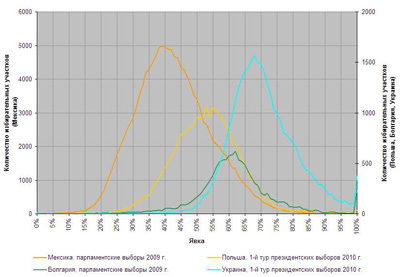
Mexico, president elections 2010 (brown),
Bulgaria, 2010 parliament elections (green),
Poland, first tour of president elections 2010 president elections 2010 (yellow)
Ukraine, first tour of president elections 2010 (blue)
.
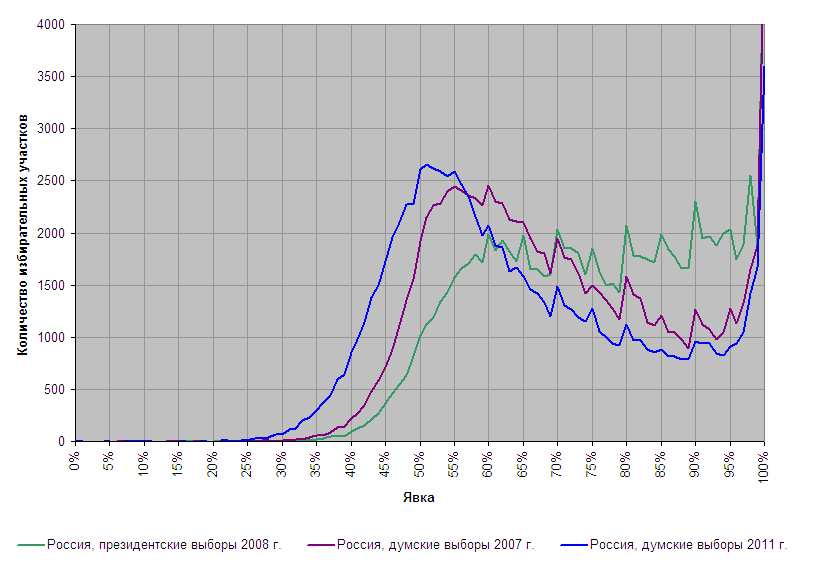
president elections, 2008 (green);
parliament elections, 2007 (lilac);
parliament elections, 2011 (blue).
.
.
.
Here we repeat the same arguments as above
1. This distribution has no reasons to be Gaussian in an inhomogeneous country.
2. Assume that electors solve the question ’to vote or not to vote?’ by a coin flip. As it was mentioned above, the corresponding distribution is not Gaussian.
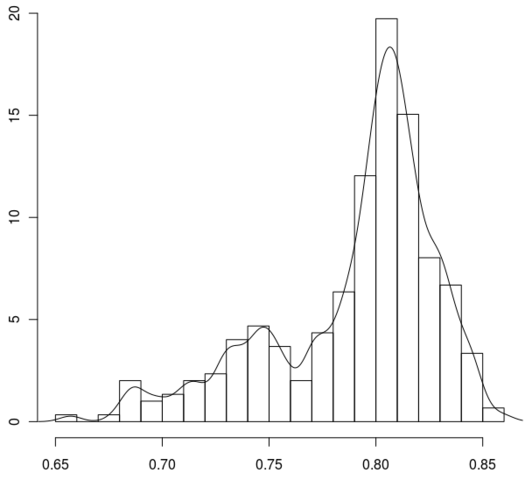
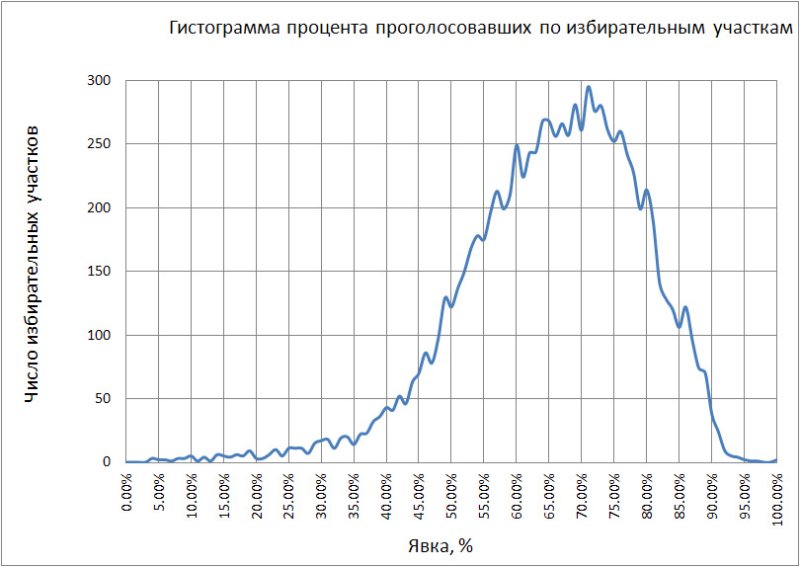
4.2. Some West countries. We present graphs of such distributions for Germany (Figure 12) and Israel (Figure 13).
4.3. Natural explanations. There are relatively obvious reasons for non-democratic parts of Russian graphs on Figure 11. For instance:
1) As it was mentioned in Footnote 16, there is a lot of small voting stations in Russia. Such stations easily produce large turnout (see the list in the footnote). In some cases lists of electors are generated during the voting.
2) Voting in army.
3) Voting in the exceptional regions.
It seems that after removing these components we must get something similar to (non-Gaussian) Israel graph (modulo a reflection).
5 Correlations between voting turnout
and results of voting
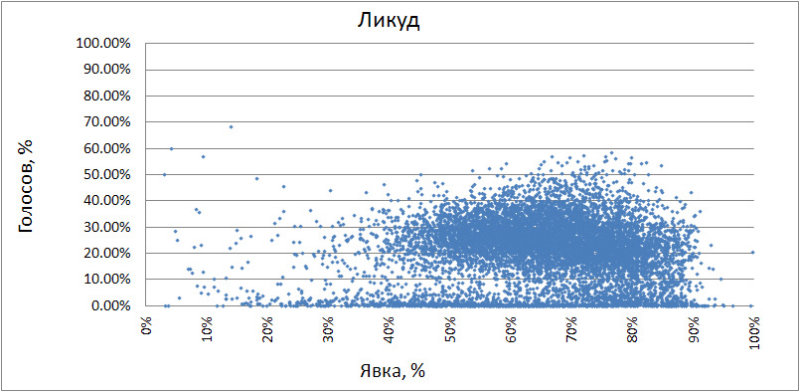
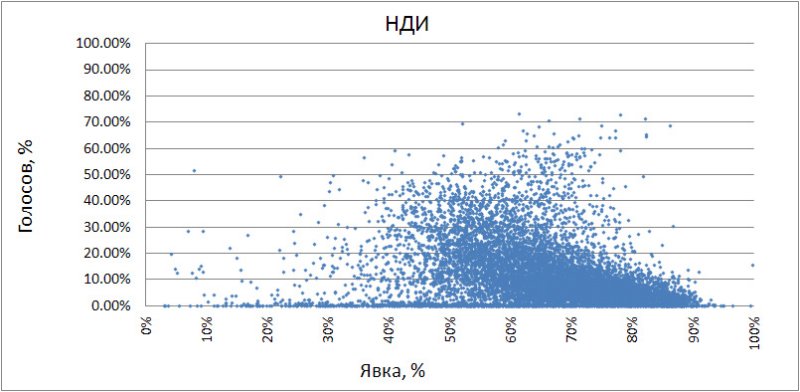
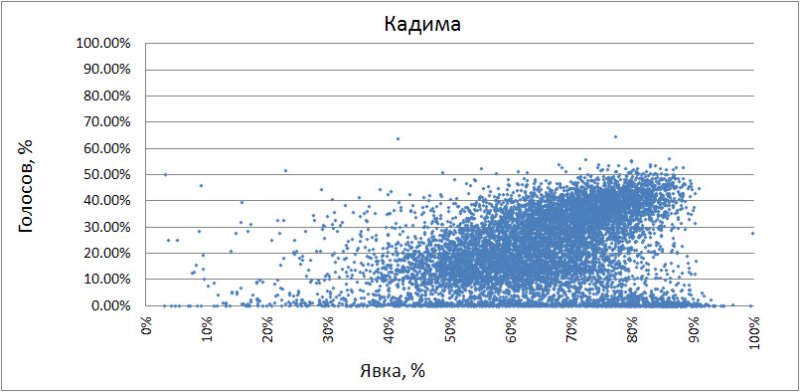
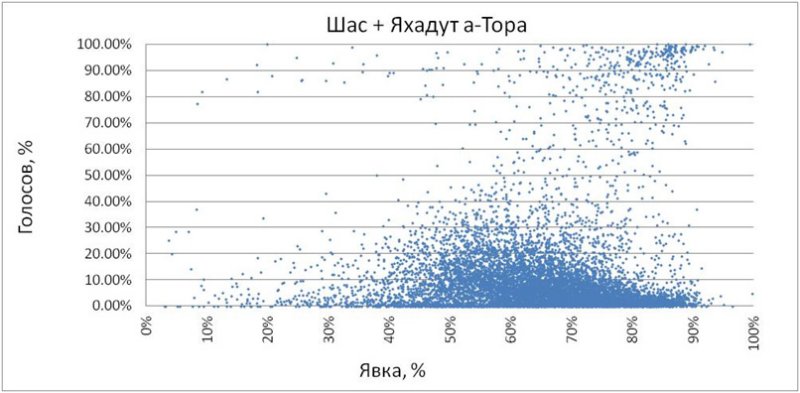
5.1. Cloud diagrams. In computer-generated graphics of Russian elections diagrams of the following two types are popular.
a) Cloud diagrams. For each voting station we draw a point
Thus we get a cloud of points in the square , .
b) Compressed cloud diagrams. For each voting station we draw a point with coordinates
The compressed cloud diagram is obtained from the cloud diagram by the transformation
| (5.1) |
It is contained in the triangle .
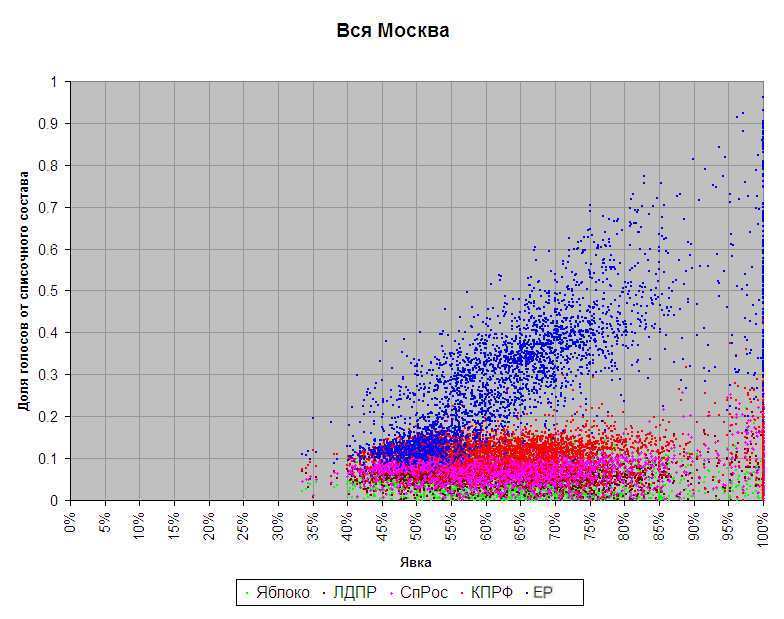
5.2. Correlation. D. Shpilkin [11], [12] presents the compressed cloud diagram for Moscow, see Figure 14.
We observe that clouds of 3 main oppositional parties are horizontal, the cloud for UR is inclined. D.Shpilkin says that the inclination of UR-cloud is generated by falsifications. He concludes that only the piece of UR-cloud in the corner , is realistic and the rest is falsified.,
In particular, this means a global injection of ballots on large majority of voting stations of Moscow.
5.3. Doubts-1. West analogs. The argumentation is based on the axiom:
’Result of voting on a given station and voting turnout are independent variables’.
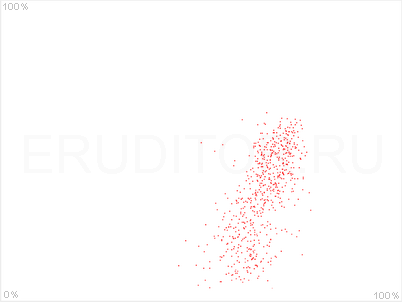
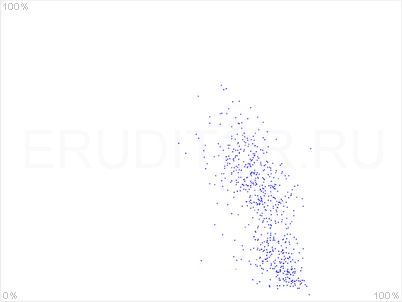
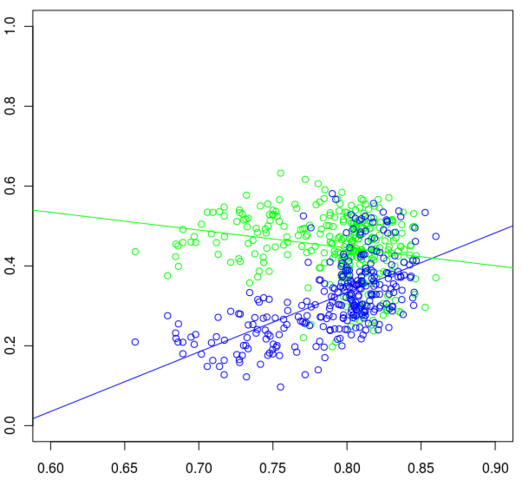
Kuznetsov [7] presents cloud diagrams for elections in Great Britain, Figure 15. Blogger ’jemmybutton’ also checked elections in Germany, Figure 16, blogger ’levrrr’ for Israel (Figure 17). We observe that the axiom contradicts to experiments…
5.4. Doubts-2. Social reasons. Accepting the claim of [11], [12] we get a global injection of ballots on the large majority of voting stations of Moscow. The statement seems suspiciously strong.
First, each case of such falsification can be easily unmasked by tools of the usual law and the usual forensics. The number of voices in a final report must correspond to the number of signatures in account books (containing also passport data of each person and the address of his registration). Therefore it is necessary to write huge number of false signatures in each voting station. I admit that statement of [11], [12] can be correct, but in such case this can be easily verified without mathematics (for more detailed discussion of types of electoral falsifications, see Petrov, [9], see also Buzin, Kynev [4]).
Second. Participants of electoral commissions are not members of a secrete guard, they are ordinary people fulfilling social duties. Lot of voting stations are traditionally located in schools, many thousands of Moscow school teachers work on elections… On the other hand, voting of patients in hospitals was organized in hospitals by doctors.202020Voting in hospitals produces many voting stations with small number of electors and with large voting turnout.,212121It seems that both strata, school teachers and health professionals, have no reasons to like the power of the country. The best hated ministers in Russia in 2011 were the Minister of education and the Minister of health..
5.5. Doubts-3. On alternative conjectures. The simplest conjecture is the following. Assume that a voting area is homogeneous. People, who are against the power, go to elections and vote for one of oppositional parties. The remains (for instance people, who consider the existing power as lesser evil) do not want too much to go to elections. If they go, then they vote for UR… In an inhomogeneous area a density of oppositional population can be a function of point.
Another version of the same conjecture: we have natural voting + falsification. In this case we can not separate two parts of the blue cloud.
It can have other reasons. However Shpilkin [11], [12] claims an axiom about independence (see above) and proposes to accept it or to search contra-arguments222222As two axiom about Gauss discussed above (see also an axiom of homogeneity of Moscow discussed below)..
5.6. Computer-generated graphics. I present a quote from [11].
’The remaining points of voting for UR are spread as a diagonal cloud corresponding artificial raising of voices for UR, and probably, lowering of voices for other parties.’
6 Is Moscow metropolis homogeneous?
The topic of the following discussions is not contained in Shpilkin [11], [12]. However it is a continuation of the previous section and it is one of main arguments of ’electoral science’.
6.1. Moscow UR-cloud again. Next, we look to Figure 18.
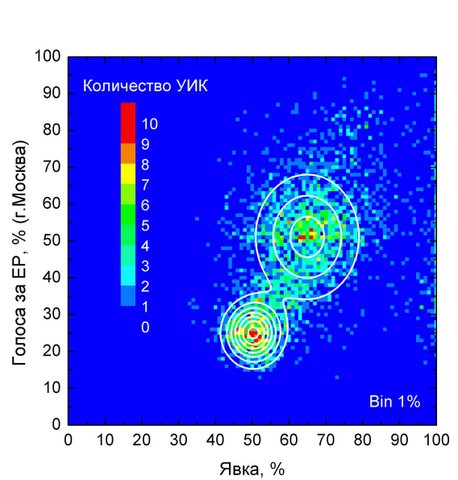
Modas of the UR cloud are at the ponts , . Passing to the compressed diagram we get points , . The slope is
and we observe that the inclination of the ER-cloud is more than 45 degrees. Hence the result of elections can not be explained by the injection of ballots…
There is a conjecture about robbing of the Yabloko (it is popular among adherents of Yabloko). We look to Figure 20.
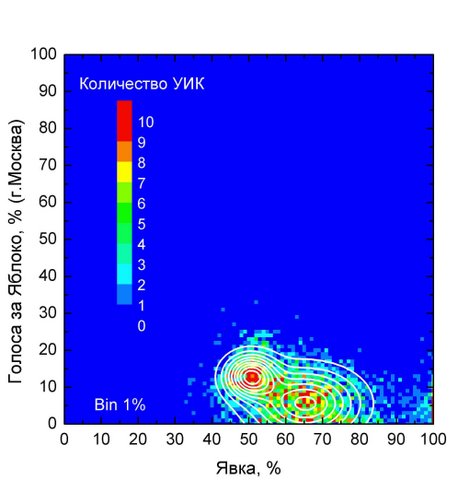
First, we observe that there is a correlations between clouds of UR and of the Yabloko (modas are on the same vertical lines). Modes of the Yabloko cloud are at points , . Passing to compressed diagrams we get points , . The inclination is
It seems that this is not sufficient to ’help’ to the United Russia.
Keeping the paradigm we have to assume that the results of elections on the majority of Moscow voting stations were more-or-less ’drawn’ by electoral commissions232323Such commissions in Moscow consist of tens thousands of more-or-less ordinary people and include numerous representatives of opposition parties. There are to much criminals (near 15-20 thousands) and they are too silent … This is not reductio ad absurdum, but we get very strong corollaries from our axioms. Such social phenomena must be observable without computer-generated graphics. ,
6.2. Is Moscow homogeneous? In my opinion, this is the first question, which must be asked by a mathematician looking to Figure 18. An important thesis of adherents of electoral computer graphics is ’Moscow is homogeneous’. Let us discuss this using simple arguments.
The next Figure 21 shows a territorial distribution of voting for UR in Moscow.
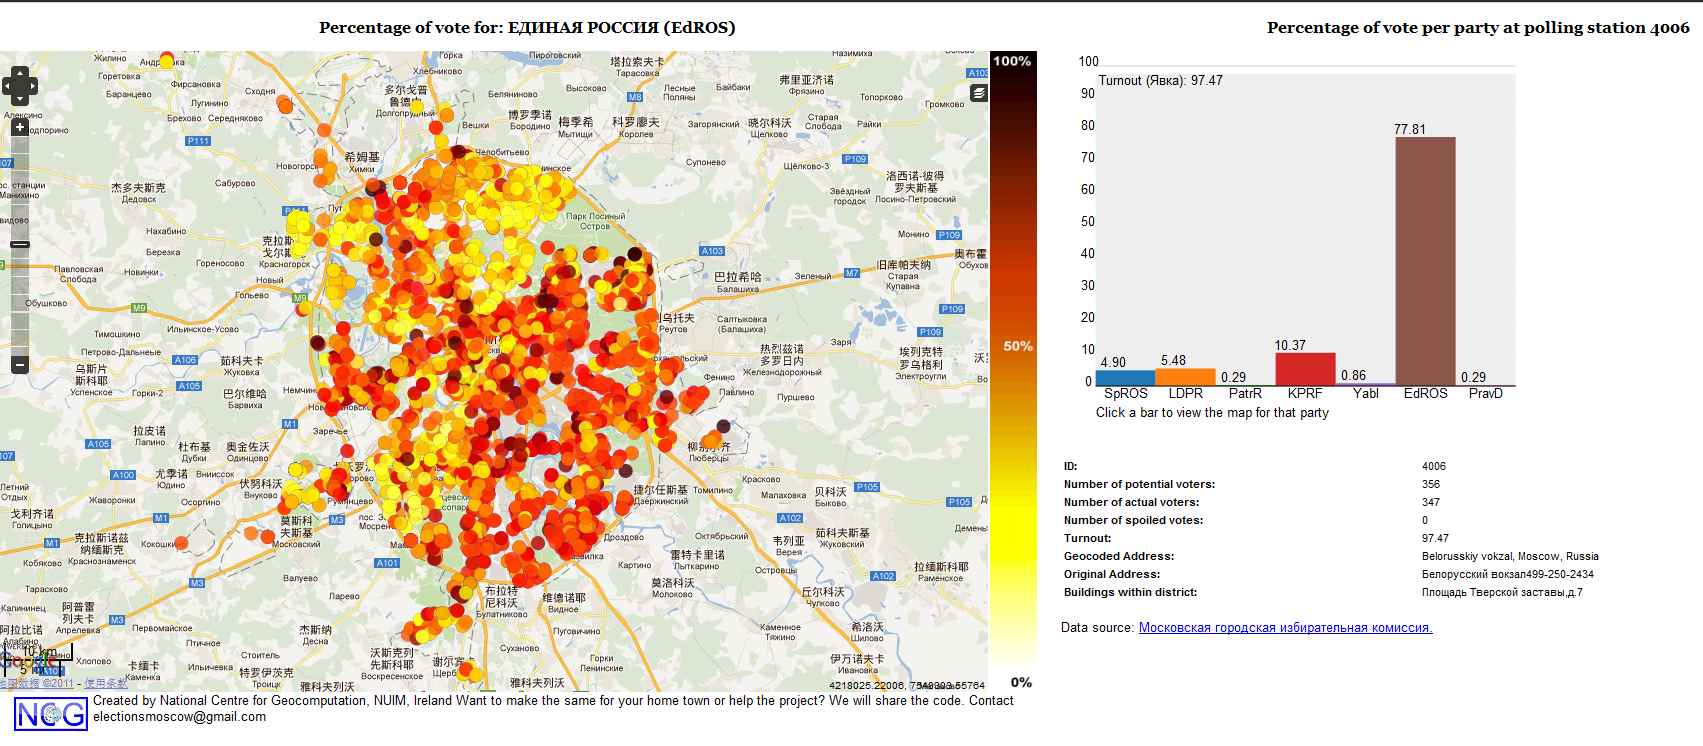
Being in the paradigm of [11], [12], we have to assume that ’red’ areas of Moscow are areas of total falsification, ’yellow’ areas are bastions of honey.
But it can happened that ’yellow’ areas are simply places of concentration of stratas of Moscow population that now are ’angry’ (including ’intelligent242424This explains correlation between modes of the United Russia and the Yabloko’ and some other strata of ’middle class’252525Notice that there were two diverse electoral slogans of ’angry’ stratas, ’Vote against the United Russia, the Party of swindlers and thiefs’ and ’Boycott elections!’. For this reason, ’angry’ population was not sufficiently well-represented on elections.).
6.3. Inhomogeneity of Moscow population. Soviet time. The author of these notes during 20 years (1966-1987) lived in a working class area. Such areas arose in Moscow in the period of industrialization and produced usual problems related to such areas. I only mention high level of aggression of teenagers and tense atmosphere in schools. This ’defended’ such areas from an infiltration of ’intelligent’.
Later (70-80s) so-called ’bedroom districts’ became usual in Moscow. This means that the majority of population of these areas were employed far from their houses. Apartments in Soviet time were distributed by the state. But the ’state’ in this case was not an abstraction, it was represented by numerous economical and social structures of different level, starting with some strong firms (as big factories, technological-research centers, etc…) and ending with ministries. Such centralized settlement had to produce numerous inhomogeneities of the population.
On the other hand it was possible to buy a flat with payment by installment (’cooperative’). Such projects were initiated by state structures, this produced exceptional buildings or groups of buildings.
6.4. Post-Soviet time. After 1991 Moscow met the usual problems of modern huge cities (may be, in more rigid forms), it seems that the growth of non-homogeneity is one of such phenomena…
In any case, Moscow has sufficient reasons to be inhomogeneous, and the statement ’Moscow is homogeneous’ is non-justified. In particular, this statement claims that Moscow is an extraordinary metropolis…
Certainly, the problem of social and ethnic inhomogeneity of Moscow is not a problem of mathematics.
7 Final remarks
I recall that his note is not a text about parliament elections in Russia.
7.1. I do not review numerous non-Gaussian electoral distributions, which have no a priori reasons to be Gaussian.
7.2. There exists also argumentation related to difference between results of voting on stations equipped with systems of automatic counting of ballots and remaining stations. See comments in the papers of Petrov [9] and Kobak [6].
7.3. Modern methods of investigation of Russian elections allow to give a mathematical proof of falsification of elections in arbitrary sufficiently inhomogeneous country262626Examples mentioned above are Great Britain, Germany, Canada, and (unawares) Poland, Israel.. In particular, they allow to prove falsification of any elections, which can happen in Russia (and apparently to assign any desired percent of falsification).
7.4. Tens of men equipped with modern computers can produce numerous correlations that can be declared as impossible. They also can pronounce numerous ’axioms’ of electoral statistics.
References
- [1] Official cite of Central Electoral Commission HTTP://cikrf.ru/eng/ (Russian, English)
- [2] Official cite "Elections to Duma, 2011 http://duma11.ru/ (Russian)
- [3] Scientific newspaper "Troitskij variant 20.12.2011 (Russian), http://trv-science.ru/94N.pdf
- [4] Buzin A.Yu., Kynev K. V. Elections in Russia 14 March 2011. Analytic report. Library of association "Golos http://www.golos.org/news/3729
- [5] Kalinin, K. Ferrow argument for Central Electoral Commission: statistics will not prove falsifications (Russian), http://slon.ru/russia/zheleznyy-argument-dlya-tsika-statistika-ne-dokazhet-falsifikatsii-726144.xhtml
- [6] Kobak, D.Mathematics of elections-2011. An addition, in [3]
- [7] Kuznetsov S.G. Mathematical distributions and Duma elections, 2011 (Russian). http://eruditor.ru/k/?15
- [8] Neretin, Yu. Is a falsification of mathematics a reasonable answer to the falsification of elections? (Russian). http://www.za-nauku.ru//index.php?option=com-content&task=view&id=5102&Itemid=29
- [9] Petrov, O. Массовые фальсификации wanted. 18.11.2011 (Russian). http://www.wiz-aut.narod.ru/L040-falsifikacii-1-konkretno.htm http://www.wiz-aut.narod.ru/L042-falsifikacii-2-statistika.htm http://www.wiz-aut.narod.ru/L042-falsifikacii-3-statistika.htm
- [10] Simkin, M.V., Mathematical proof of fraud in Russian elections unsound (English), http://arxiv.org/abs/1112.3627
-
[11]
Shpilkin, D. Statistics had investigated elections, (Russian),
Electronic newspaper gazeta.ru,
http://www.gazeta.ru/science/2011/12/10-a-3922390.shtml.
Electronic journal za-nauku.ru,
http://www.za-nauku.ru//index.php?option=com-content&task=view&id=5083&Itemid=29. - [12] Shpilkin, D. Mathematics of elections-2011,(Russian) in [3].
Math.Dept., University of Vienna,
Nordbergstrasse, 15, Vienna, Austria
&
Institute for Theoretical and Experimental Physics,
Bolshaya Cheremushkinskaya, 25, Moscow 117259, Russia
&
Mech.Math. Dept., Moscow State University, Vorob’evy Gory, Moscow
e-mail: neretin(at) mccme.ru
URL:www.mat.univie.ac.at/neretin
wwwth.itep.ru/neretin
Addendum 1. Regional statistics
Reference to footnote 11.
Below we present the list of regions of Russian Federation ordered according percent of voices for United Russia party (UR). For each region we present
— the total number of electors (the first column, in brackets, millions);
— percent of voices for UR (the second column);
— voting turnout (column 3);
— the percent of voices for UR with respect to the total number of electors (column 4);
— column 5 contains a geographic information (see abbreviations after the table).
We distinguish regions according their status in the Constitution.
— national republics are marked by bold;
— ordinary regions (oblasts and krays) by the usual rm font.
— we also mark 4 autonomous okrugs and a unique autonomous oblast by italic, apparently these cases must be considered as an exoticism outside statistics.
| 1 | 2 | 3 | 4 | 5+ | 5- |
| 1. Republic of Chechenia (0.6) | 99,5 | 99,5 | 99.0 | NC,I | |
| 2. Republic of Mordovia (0,7) | 91,6 | 94,2 | 86.3 | For | |
| 3. Republic of Daghestan (1.6) | 91,4 | 91.1 | 83.3 | NC, I | |
| 4. Republic of Ingushetia (0.2) | 91,0 | 86,4 | 78.6 | NC, I | |
| 5. Karachaevo-Circassian Rep. (0.3) | 89,8 | 93,2 | 83.7 | NC, I | |
| 6. Republic of Tyva (0,2) | 85,3 | 86,1 | 73.4 | East | |
| 7. Rep. of Kabardino-Balkaria (0.5) | 81,9 | 98,4 | 80.6 | NC, I | |
| 8. Republic of Tatarstan (2,9) | 77,8 | 79,5 | 61.9 | I, Pr | |
| 9. Yamal-Nenets autonomous okrug (0,4) | 71,7 | 82,2 | 58.9 | WS | |
| 10. Republic of Bashkortostan (3,0) | 70,5 | 79,3 | 55.9 | I | For |
| 11. Chukotka autonomous okrug (0,03) | 70,3 | 79,1 | 55.6 | East | |
| 12. Republic of North Osetia (0.5) | 67,9 | 85,8 | 58.0 | NC | |
| 13. Tambov oblast (0,9) | 66,7 | 68,3 | 45.6 | Pr | |
| 14. Republic of Kalmykia (0,2) | 66,1 | 63,2 | 41.8 | Pr | |
| 15. Saratov oblast (2,0) | 64,9 | 67,3 | 43.7 | Pr | |
| 16. Kemerovo oblast (2,1) | 64,2 | 69,4 | 44.6 | WS | |
| 17. Tyumen oblast (1,0) | 62,2 | 76,2 | 47.4 | WS | |
| 18. Tula oblast (1,3) | 61,3 | 72,8 | 44.6 | Pr | |
| 19. Republic of Adygeya (0.3) | 61,0 | 65,9 | 40.2 | NC,I | |
| 20. Astrakhan oblast (0,8) | 60,2 | 56,0 | 33.7 | Pr | |
| 21. Republic of Komi (0,7) | 58,8 | 72,6 | 42.7 | For | |
| 22. Penza oblast (1,1) | 56,3 | 64,9 | 36.6 | Pr | |
| 23. Krasnodar kray (3.8) | 56,2 | 72.6 | 40.8 | Pr | |
| 24. Republic of Altai (0,2) | 53,3 | 63,6 | 33.9 | WS | |
| 25. Republic of Mari (0,5) | 52,2 | 71,3 | 37.2 | For | |
| 26. Belgorod oblast (1,2) | 51,2 | 75,5 | 38.7 | Pr | |
| 27. Chelyabinsk oblast (2,8) | 50,3 | 59,7 | 30.0 | (Pr) | |
| 28. Rostov oblast (3.3) | 50,2 | 59.3 | 29.8 | Pr | |
| 29. Bryansk oblast (1,0) | 50,1 | 59,9 | 30.0 | (Pr) | |
| 30. Voronezh oblast (1,9) | 50,0 | 64,3 | 32.2 | Pr | |
| 31. Republic of Yakutia (0,6) | 49,2 | 60,1 | 29.6 | East | |
| 32. Stavropol kray (2.0) | 49,1 | 50.9 | 25.0 | Pr | |
| 33. Republic of Buryatia (0,7) | 49,0 | 56,9 | 27.9 | East | |
| 34. Jewish autonomous oblast (0,1) | 48,1 | 52,1 | 25.0 | East | |
| 35. MOSCOW-city (7,2) | 46,6 | 61,7 | 28.9 | (For) | |
| 36. Kursk oblast (0,9) | 45,7 | 54,7 | 25.9 | Pr | |
| 37. Kamchatka kray (0,3) | 45,3 | 53,6 | 24.3 | East | |
| 38. Republic of Udmurtia (1,2) | 45,1 | 56,6 | 25.5 | For | |
| 39. Nizhny Novgorod oblast (2,7) | 44,6 | 58,9 | 26.3 | For | |
| 40. Kurgan oblast (0,8) | 44,4 | 56,5 | 25.1 | WS | |
| 41. Ul’yanovsk oblast (1,1) | 43,6 | 60,4 | 26.3 | Pr | |
| 42. Amur oblast (0,7) | 43,5 | 54,0 | 23.5 | East | |
| 43. Republic of Chuvashia (1,0) | 43,4 | 61,7 | 26.3 | For | |
| 44. Zabaikal’e kray (0,8) | 43,3 | 53,6 | 23.2 | East | |
| 45. Sakhalin oblast (0,4) | 41,9 | 49,1 | 20.6 | East | |
| 46. Magadan oblast (0,1) | 41,0 | 52,6 | 21.6 | East | |
| 47. Kaluga oblast (0,8) | 40,4 | 57,5 | 23.2 | For | |
| 48. Lipetsk oblast (1,0) | 40,1 | 56,9 | 22.8 | Pr | |
| 49. Khanty-Mansi auton. okrug (1,1) | 41,0 | 54,9 | 22.5 | WS | |
| 50. Republic of Khakassia (0,4) | 40,1 | 56,2 | 22.6 | East | |
| 51. Ivanovo oblast (0,8) | 40,1 | 53,2 | 21.3 | For | |
| 52. Ryazan oblast (1,0) | 39,8 | 52,7 | 21.0 | For | |
| 53. Omsk oblast (1,6) | 39.6 | 55,7 | 22.1 | WS | |
| 54. Samara oblast (2,6) | 39,4 | 53,0 | 20.9 | Pr | |
| 55. Orel oblast (0,7) | 39,0 | 64,7 | 25.2 | Pr | |
| 56. Tver oblast (1,1) | 38,4 | 53,5 | 20.5 | For | |
| 57. Vladimir oblast (1,3) | 38,3 | 48,9 | 18.7 | For | |
| 58. Khabarovsk kray (1,1) | 38,1 | 53,2 | 20.3 | East | |
| 59. Tomsk oblast (0,8) | 37,5 | 50,5 | 18.9 | WS | |
| 60. Altai kray (2,0) | 37,2 | 52,5 | 19.6 | WS | |
| 61. Kaliningrad oblast (0,8) | 37,1 | 54,6 | 20.3 | For | |
| 62. Pskov oblast (0,6) | 36,7 | 52,9 | 19.4 | For | |
| 63. Krasnoyarsk kray (2,2) | 36,7 | 49,7 | 18.2 | East | |
| 64. Perm kray (2,1) | 36,3 | 48,1 | 17.5 | For | |
| 65. Smolensk oblast (0,8) | 36,2 | 49,6 | 18.0 | For | |
| 66. Nenets autonomous okrug (0,0) | 36,0 | 56,1 | 20.2 | T | |
| 67. Volgograd oblast (2,0) | 35,5 | 52,0 | 18.5 | Pr | |
| 68. ST.PETERSBURG (city) (3,6) | 35,4 | 55,2 | 19.5 | (For) | |
| 69. Kirov oblast (1,1) | 34,9 | 54,0 | 18.8 | For | |
| 70. Orenburg oblast (1,6) | 34,9 | 51,2 | 17.7 | Pr | |
| 71. Irkutsk oblast (1,9) | 34,9 | 47,1 | 16.4 | East | |
| 72. Novgorod oblast (0,5) | 34,6 | 56,6 | 19.6 | For | |
| 73. Novosibirsk oblast (2,1) | 33,8 | 56,8 | 19.2 | WS | |
| 74. Vologda oblast (1,0) | 33,4 | 56,3 | 18.8 | For | |
| 75. Leningrad oblast (1,3) | 33,0 | 51,5 | 17.0 | For | |
| 76. Primor’e kray (1,5) | 33,0 | 48,7 | 16.1 | East | |
| 77. Moscow oblast (5,6) | 32,8 | 51,0 | 16.7 | For | |
| 78. Sverdlovsk oblast (3,5) | 32,7 | 51,2 | 16.7 | For | |
| 79. Republic of Karelia (0,6) | 32,3 | 50,3 | 16.2 | For | |
| 80. Murmansk oblast (0,7) | 32,0 | 51,8 | 16.6 | For, T | |
| 81. Archangelsk oblast (1,0) | 31,9 | 50,0 | 16.0 | For | |
| 82. Kostroma oblast (0,6) | 30,7 | 57,3 | 17.6 | For | |
| 83. Yaroslavl oblast (1,1) | 29,0 | 55,9 | 16.2 | For |
We see that voting in ’republics’ and ordinary regions was strongly different, but ’republics’ also are different. We observe impressive 12 top-lines of the table (recall that autonomous okrugs were omitted from the considerations).
We split the table on 3 parts, lines 1–12, 13–23, 24–83 respectively. The first and the second groups are distinguished due a jump in the 4th column of the table 61.9%–(58.9%)–58.0%–(55.9%)–55.6% in the leading group and 45.6% (Tambov), 47.6% (Tyumen).
The boundary between the second and the third group is not precise. Here there is a jump 56.2%–53.3% in the second column (but attributions of Astrakhan, Mari, and Belgorod can be regarded as problematic).
The last group 24-83 is a dense.
Abbreviations in Column 5.
NC — North Caucasus;
I — a republic with Islamic title nation;
Pr — a region in European prairies or forest-steppe (the south of European part of Russia);
For — a region in European forest zone (the north of European part of Russia);
T — a region in European tundra (Arctic prairie);
WS — West Siberia;
East — East Siberia and Far East (Pacific).
Addendum 2. Voting stations with given results of United Russia.
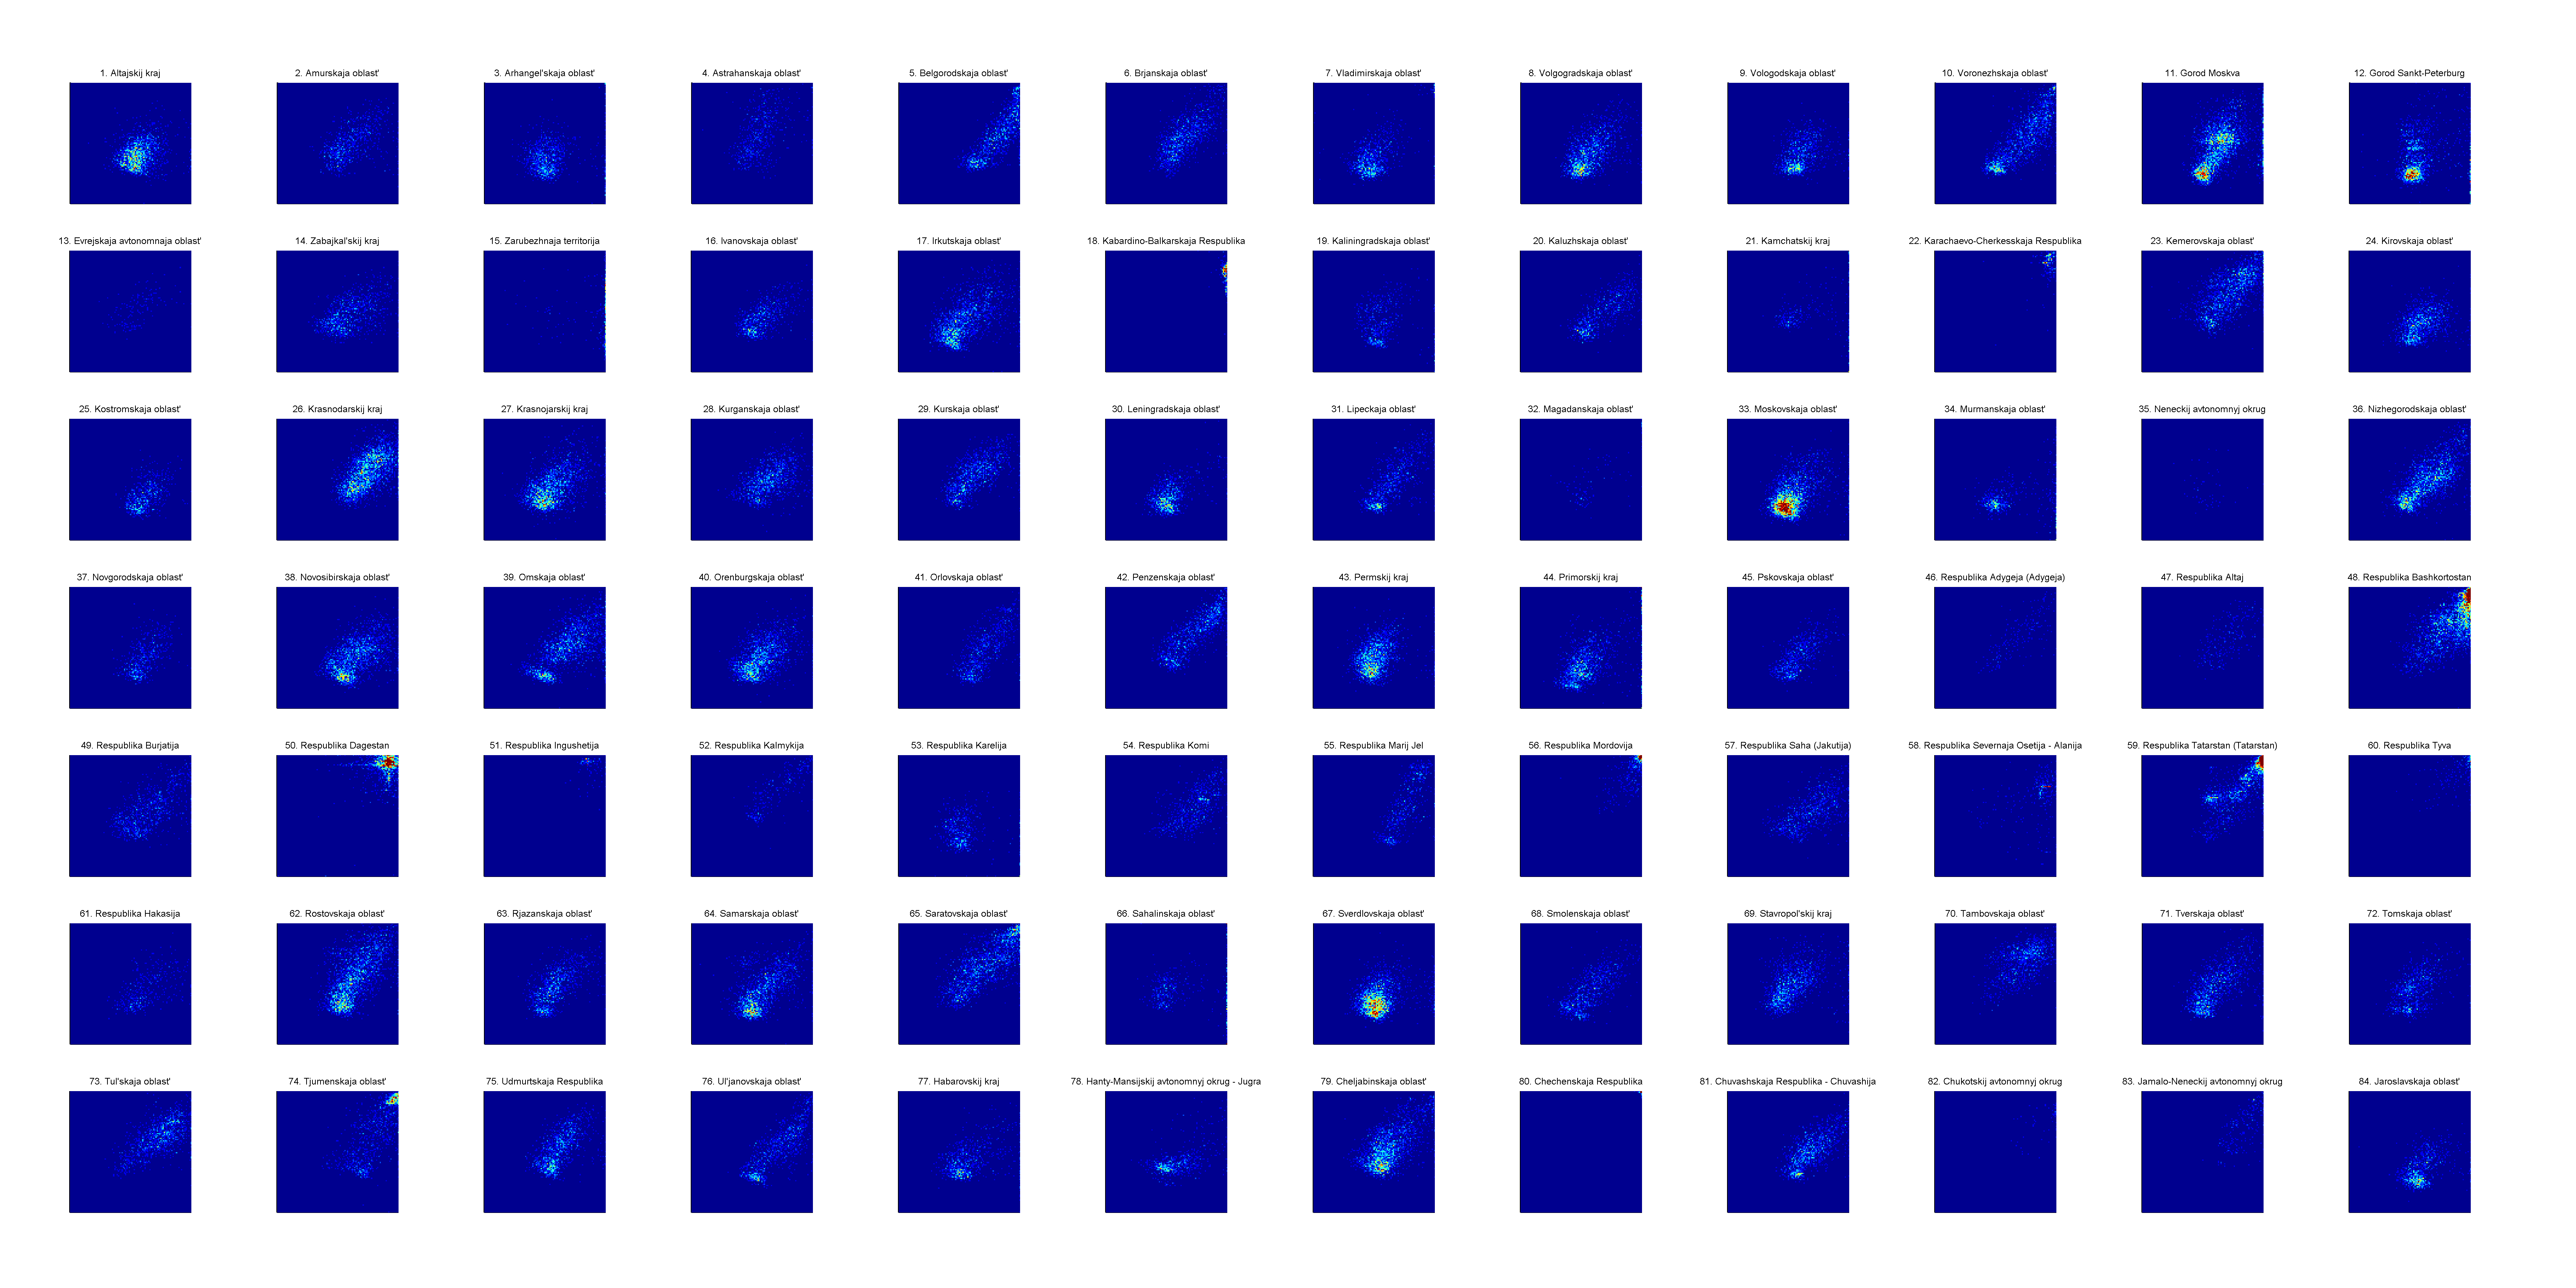
Reference to footnote 10.
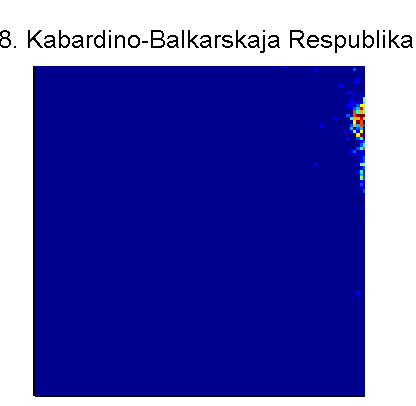
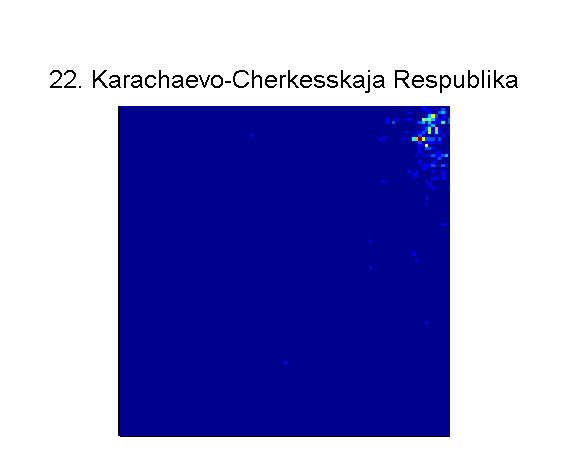
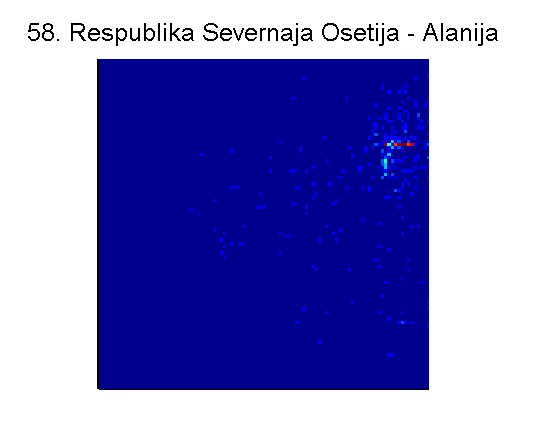
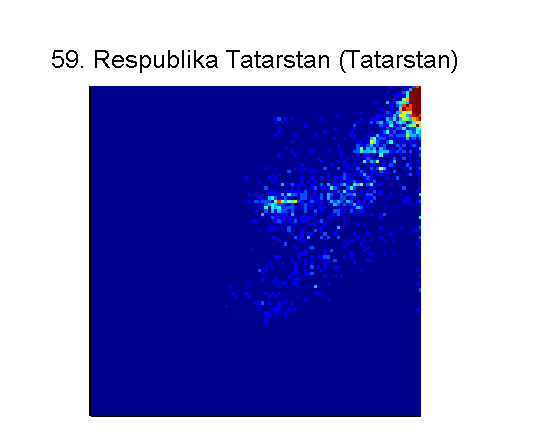
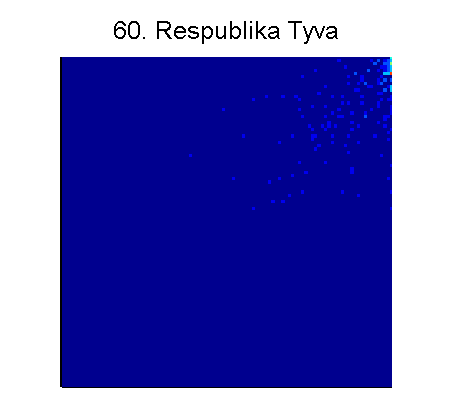
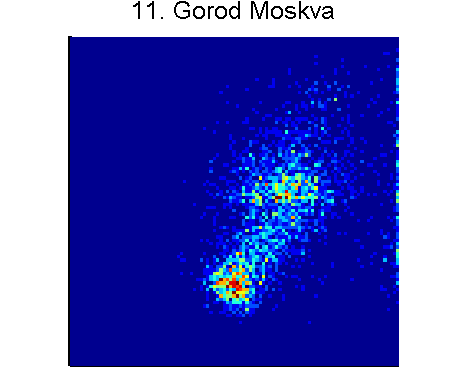
Figure 22 presents UR-cloud diagrams for all regions of Russia. For ordinary regions pictures looks as comets, sometimes ellipses or circles. Moscow-city discussed above is slightly unusual (oval with waist). Separately, we present cloud diagrams for the exceptional regions. It seems that they are very individual and very strange. It seems that elements of real elections in the Republics of Bashkortostan, Tatarstan, and North Osetia are visible on these Figures.
