[subfigure]style=plain,capbesideposition=left, top, capbesidesep=space,heightadjust=object \session-title2011 Hadron Collider Physics symposium (HCP-2011) 11institutetext: Max-Planck-Institut für Physik, München
Single Top Results by ATLAS and CMS
Abstract
Electroweak production of top quarks, the so-called single top production, is interesting both in the context of measurements of the Standard Model of Particle Physics as well as searches for new phenomena beyond that. Analyses based on data taken in 2010 and 2011 by the ATLAS and CMS collaborations at a centre-of-mass energy of 7 TeV at the LHC proton-proton collider will be presented. Different production channels, including t-channel, s-channel, and associated boson production, have been addressed using datasets of up to 2.1 fb-1. A first search for Flavour Changing Neutral Currents has been performed as well.
1 Introduction
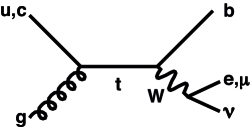
In the Standard Model (SM) of Particle Physics, top quarks can be produced either in top-antitop pairs via the strong interaction or as single top quarks by the electroweak interaction. Top quarks decay (in the SM) almost exclusively to a boson and a quark. Therefore, the decay signature depends solely on the , decaying either leptonically into lepton+neutrino or hadronically into quark-antiquark . In general, cross sections are lower and backgrounds higher for single top quark production compared to top pairs making analyses more difficult. Therefore, single top production was established only in recent years at the Tevatron. At the higher centre-of-mass energy at the LHC, cross sections are larger for the different production channels, leading to higher statistics. Figure 1 shows examples of Feynman diagrams for t-channel, associated boson production (Wt-channel) and s-channel single top production. Table 1 lists the cross sections at Next-to-leading order (NLO) with Next-to-next-to- leading-log (NNLL) resummation (NNLO approximation) for Tevatron and LHC centre-of-mass energies xsec_1 ; xsec_2 ; xsec_3 . Cross sections at the LHC are between about 4 and 30 times larger than at the Tevatron. Especially the Wt-channel, which was not accessible before, has a significant cross section at the LHC. Even the s-channel cross section, the smallest one at the LHC, is more than two times larger than the largest one at the Tevatron. This allows detailed measurements of the Standard Model and searches for new phenomena in the coming years. The different production channels will be established, their cross sections compared to Standard Model predictions, the unitarity of the CKM matrix can be tested and b-quark Parton Density Functions studied. Possible searches include signatures of Flavour Changing Neutral Currents (FCNCs) (cf. Fig. 1d), ’ boson, charged Higgs H+, a fourth generation of quarks and so on. Part of that program is already possible with the current ATLAS and CMS datasets of up to 2 fb-1. More signatures will be studied in the future.


2 Measurements in the t-channel
Due to its large cross section, the t-channel single top quark production has been addressed first by the ATLAS and CMS collaborations. Both have presented measurements based on the first year of LHC data, corresponding to 36 pb-1 (CMS) CMS_t and 35 pb-1 (ATLAS) ATL_t_1 . The ATLAS collaboration has updated this analysis with 2011 data corresponding to 156 pb-1 ATL_t_2 and a second time with 700 pb-1 ATL_t_3 . Only the latter analysis will be described in the following. Both collaborations have used cut-based measurement techniques which are simple and robust as well as multivariate approaches which have in general higher sensitivities as they exploit the full kinematics of signal and backgrounds. However, those techniques have larger model dependencies. CMS uses a Boosted Decision Tree (BDT) approach, whereas ATLAS applies a Neural Network (NN) technique.
Both collaborations only consider events, where the boson originating in the top quark decays leptonically into a lepton and neutrino. Therefore, an isolated lepton, either an electron or a muon, is required in the event selection. They use anti-kT jets with a size parameter of 0.5 for CMS and 0.4 for the ATLAS analysis. CMS selects only events with exactly 2 jets whereas ATLAS also allows 3-jet events. Both analysis teams require one jet to be identified as a -jet. CMS uses a technique based on the interaction point significance, whereas ATLAS explicitly identifies a secondary vertex, indicating a -decay. Both collaborations also make requirements on the boson from the top decay. CMS asks for a transverse mass of the lepton and the neutrino to be larger than 40 GeV in the muon case and larger than 50 GeV in the electron case. ATLAS requires that the transverse lepton-neutrino mass is larger than 60 GeV minus the missing transverse energy (). In addition, ATLAS makes an explicit cut on to be larger than 25 GeV. More details about the event selection can be found in CMS_t ; ATL_t_3 .
After this event selection, the most important backgrounds are pair production, bosons in association with jets (jets) and QCD multijet events. ATLAS normalizes the background to the theory prediction, CMS to the measured value of 150 pb. For the jets background ATLAS takes the shape from Monte Carlo simulation. The size is estimated from a simultaneous fit to the NN output or in the cut-based analysis taken from scale factors derived in three control regions. CMS distinguishes jets background containing heavy flavour jets (HF) or light jets only. For the first LO predictions are used scaled by factors of the cross section analysis. The latter is scaled to NNLO precision in the BDT analysis. The cut-based analysis uses a normalization fitted to the transverse mass of the W boson in two control regions. The shape is estimated by a data-driven model. For the QCD multi jet background ATLAS performs a likelihood fit to the distribution to estimate the size and takes the shapes from a jet-electron model and a loose isolation muon sample. CMS measures the size in a likelihood fit to the distribution and the shape from orthogonal lepton isolation samples.
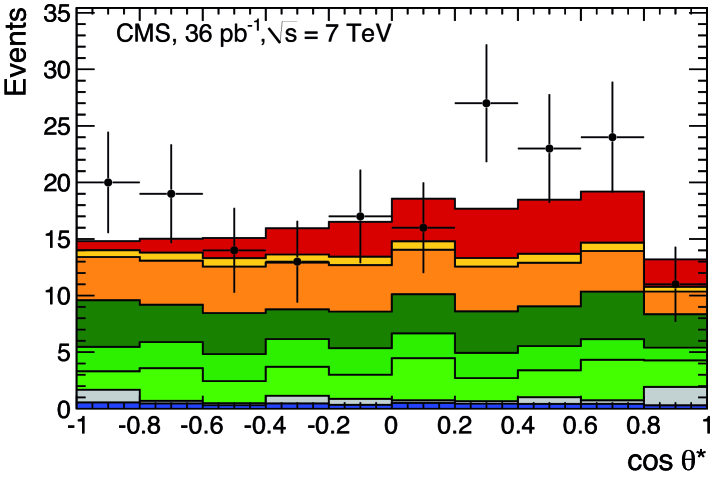
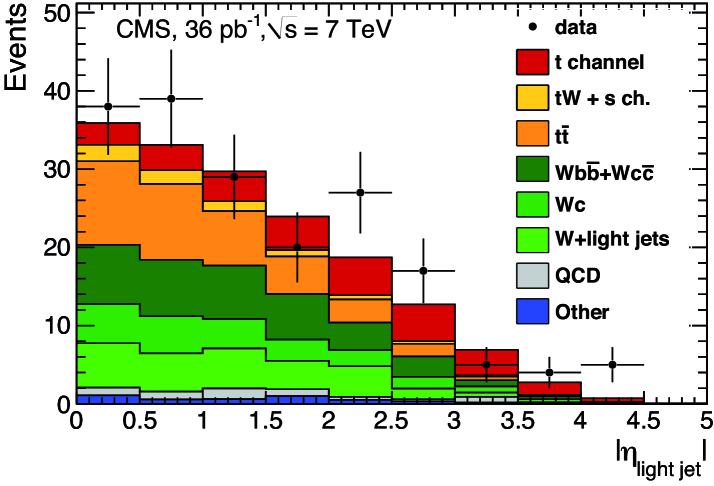
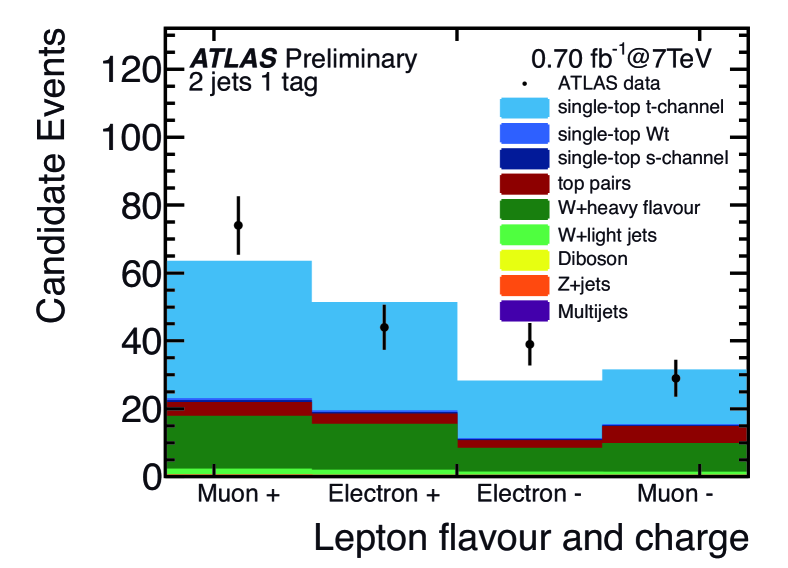
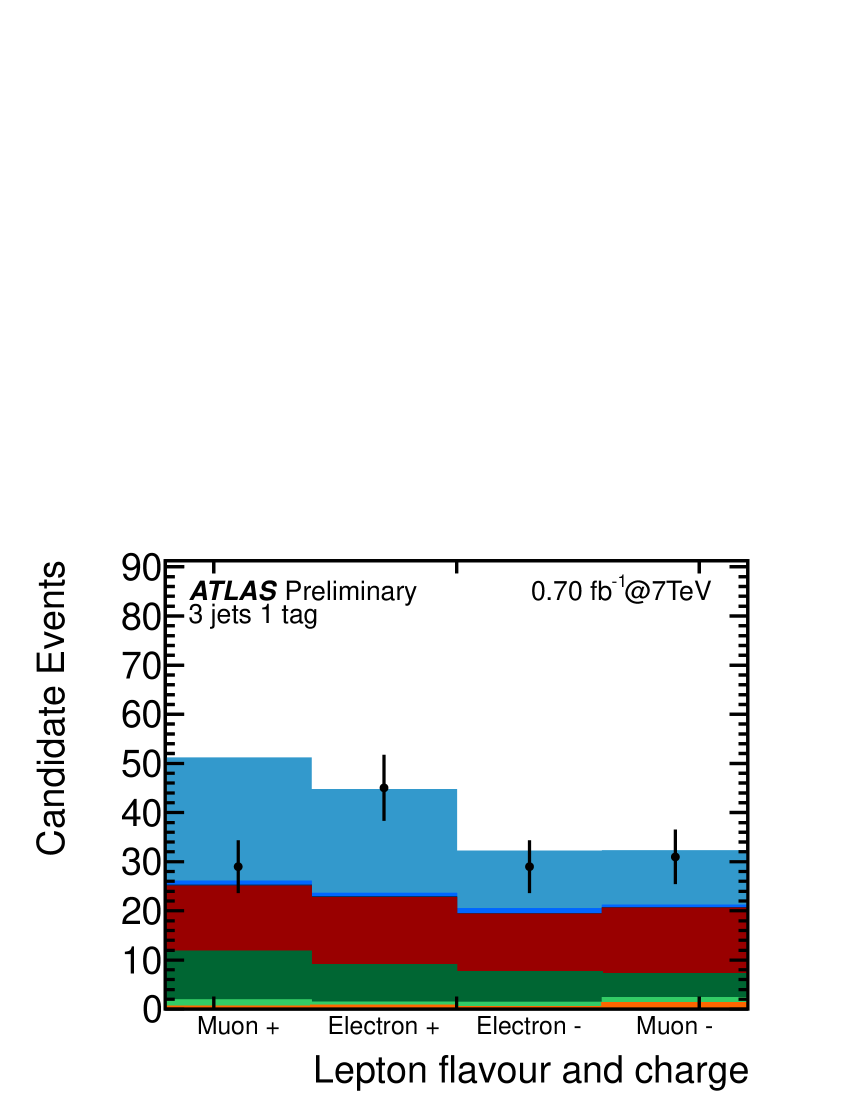
In the cut-based approach, CMS performs a maximum likelihood fit in two variables, which are the cosine of the angle between the light jet (i.e. the non--identified jet) and the lepton and the absolute value of the pseudorapidity of the light jet . These variables are chosen in order to minimize model dependencies. The background is treated as a free parameter in the fit. The data distributions of the two variables together with the results of the fit are shown in Fig. 2. As stated before, ATLAS uses both the 2-jets (1 -tag) and 3-jets (1 -tag) samples. Both samples are separated into four subsamples of lepton flavour and charge. These eight subsamples are simultaneously fitted. As in the CMS analysis, the background is a free parameter. The result of the fit together with the data points for the eight subsamples is given in Fig. 3
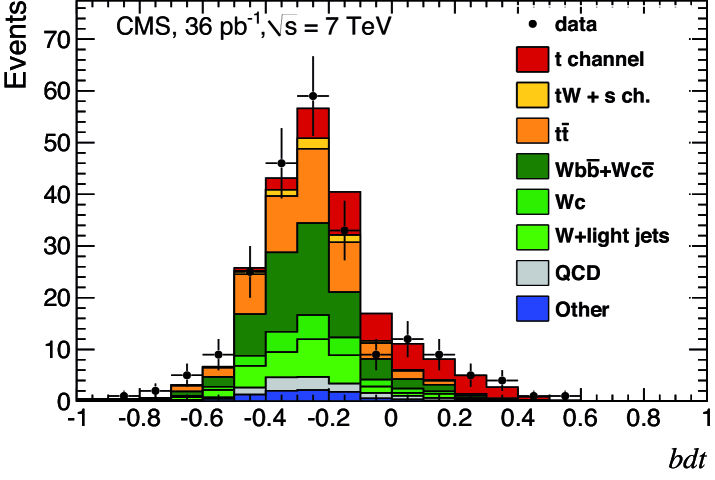
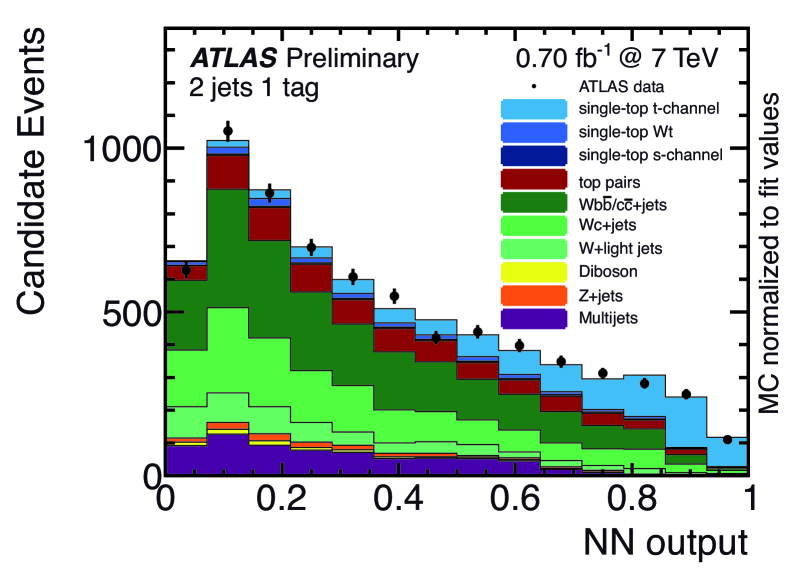
In the multivariate analyses, a Boosted Decision Tree (BDT) and a Neural Network (NN) are used by the CMS and ATLAS collaborations, respectively. Both analysis teams perform a fit to the full output distribution and again include the background as free parameter. In the ATLAS analysis it should be noted that only the 2-jet sample is used, therefore the statistics are lower than in the respective cut-based analysis. Results of the fits are shown in Fig. 4.
CMS measures a cross section of pb in the cut-based analysis and pb in the BDT analysis. The first uncertainty is statistical whereas the second one is systematic. The dominant systematic uncertainty is the -identification efficiency. Other major systematics are the signal model, the factorization and renormalization scales of the jets background, the jet energy scale and the size of the jets background. A combination of the two measurements yields a cross section of pb for the t-channel single top production. In a background only hypothesis, the deviation between measurement and expected background corresponds to 3.5 . CMS derives a lower limit for the CKM matrix element of 0.62 in the cut-based and 0.68 in the BDT approach. The estimate is restricted to a range of .
ATLAS measures the cross section of t-channel single top production to be pb in the cut-based approach, corresponding to 7.6 . The NN analysis on the smaller dataset of 2-jet events only serves as a cross check and yields pb. As for CMS -identification is the dominant systematic uncertainty, expressed in the -tagging scale factor. Other major systematics are the jet pseudorapidity reweighing, the choice of Monte Carlo generator, the parton shower model and the jet energy scale.
3 Measurements in the Wt-channel
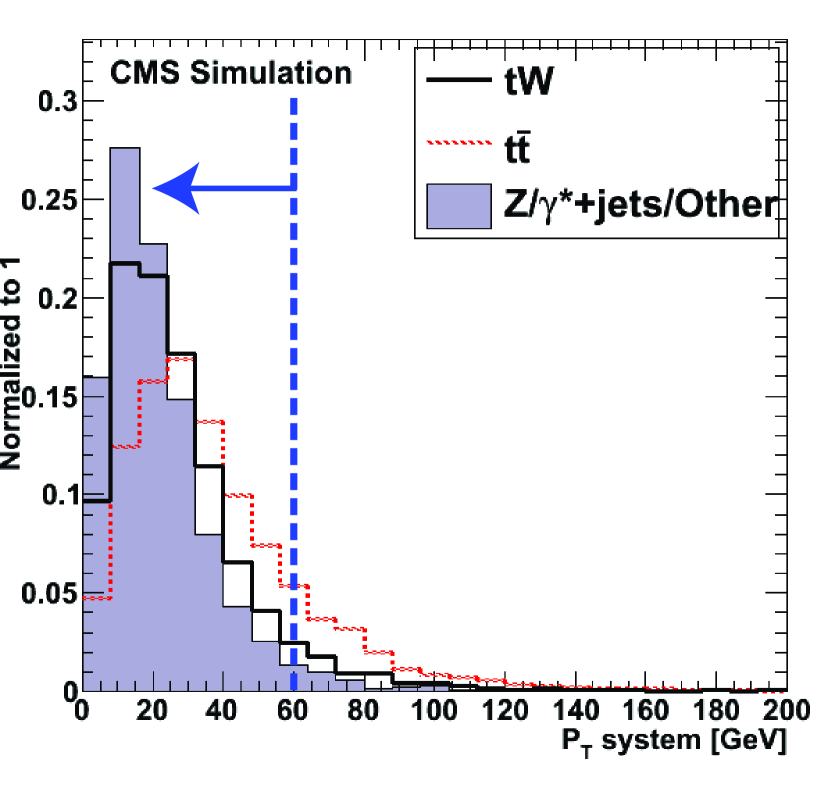
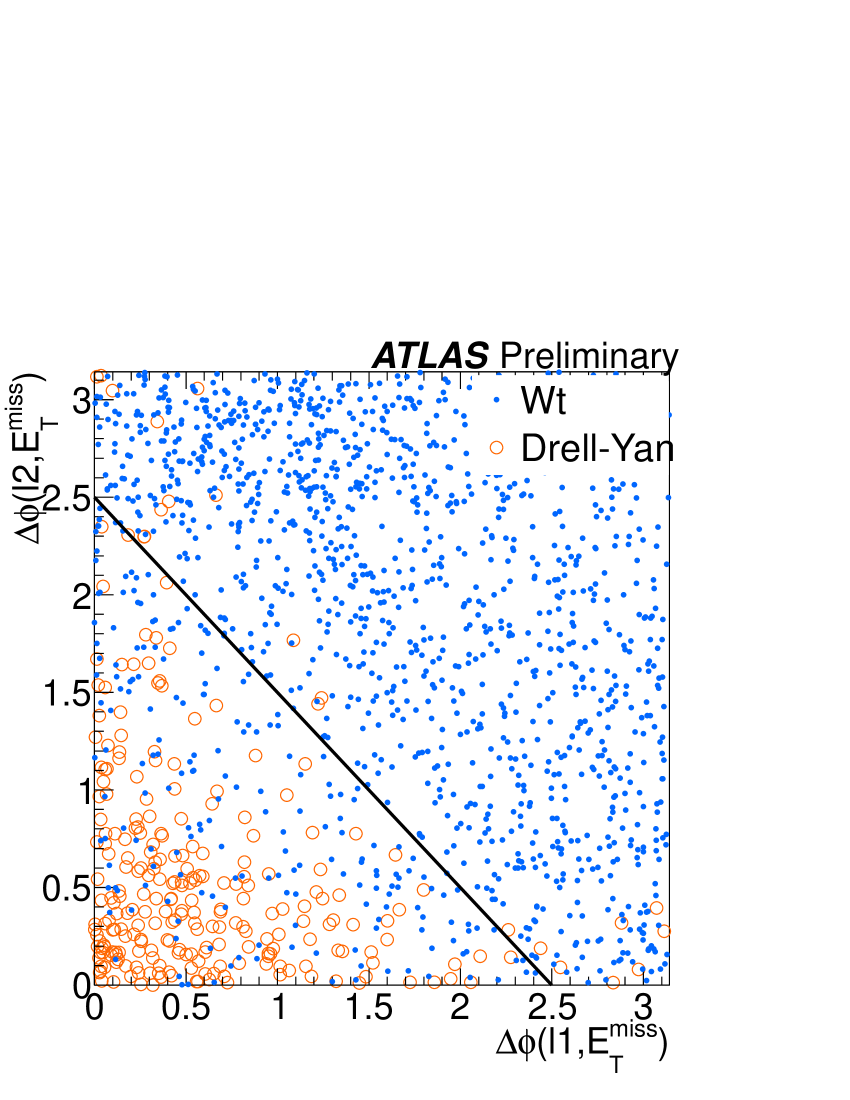
In the single top production channel with an associated boson, CMS has performed an analysis on 2.1 fb-1 CMS_Wt . ATLAS has analyzed the full 2010 dataset of 35 pb-1 ATL_t_1 and updated this analysis with 700 pb-1 of 2011 data ATL_Wt . Both collaborations select the dilepton signatures only (ee, , e) where both the associated and the stemming from the top decay leptonically. Due to that, exactly two opposite-sign leptons are required. ATLAS cuts on GeV in all three signatures. CMS cuts on GeV in the ee and signatures. In the e case, no cut on is performed, but the total transverse mass in the event is required to be larger than 160 GeV. CMS asks for exactly one jet, which has to be identified as a -jet, whereas ATLAS does not have a -identification requirement on its one jet. To reduce the amount of background in the samples, events in the boson mass window GeV are rejected in both analyses. To get rid of Drell-Yan background, CMS rejects events where the dilepton mass mll is smaller than 20 GeV. ATLAS performs a triangle cut on the angle between the lepton and in the transverse plane (see Fig. 5, right). In order to reduce background, CMS rejects events with an additional -jet above 20 GeV and requires the transverse momentum of the system consisting of the two leptons, jet and to be smaller than 60 GeV (cf. Fig. 5, left).
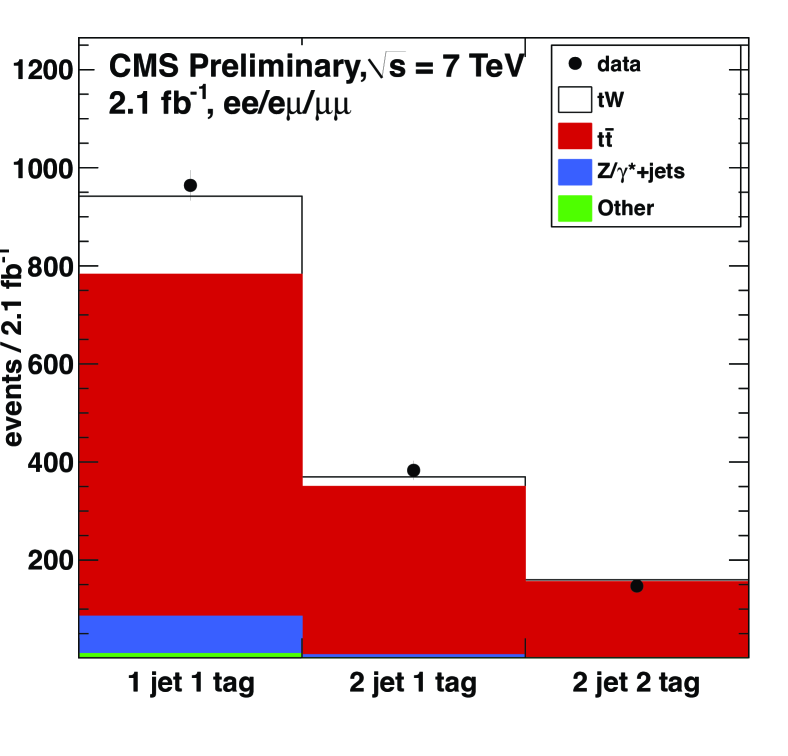
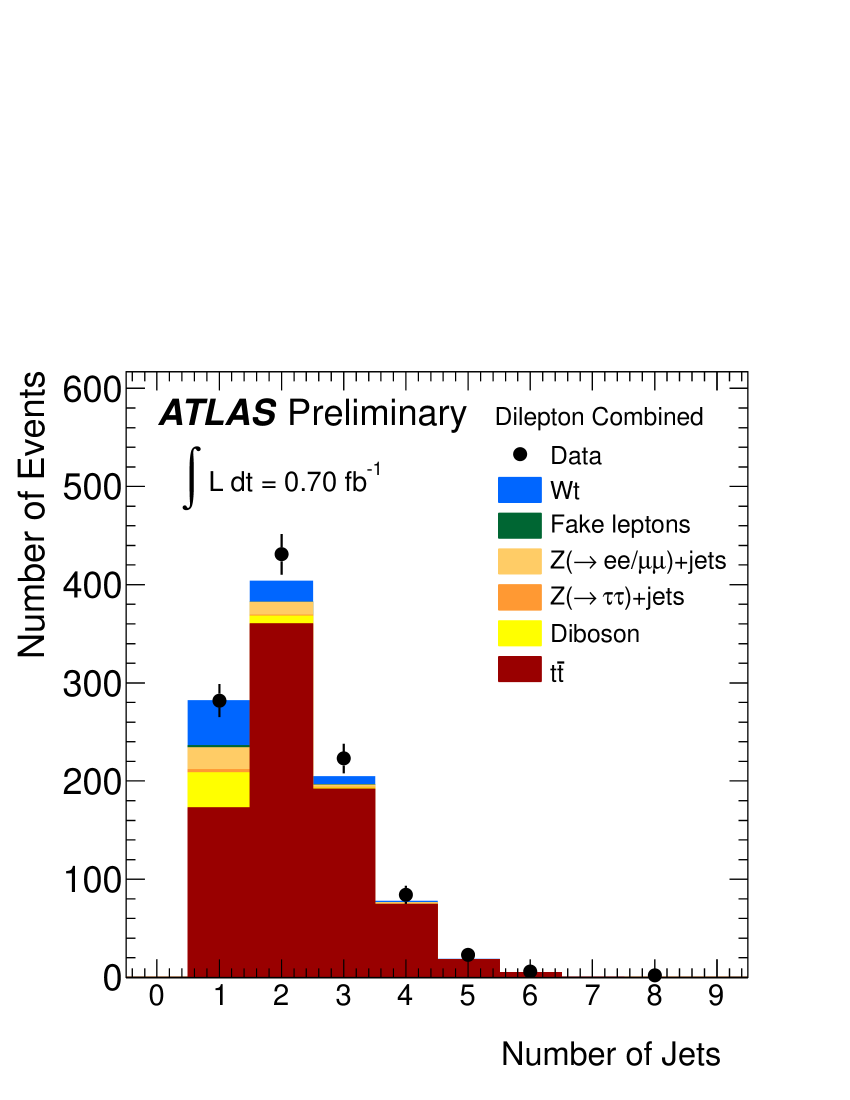
Both ATLAS and CMS perform data-driven background estimates. The Drell-Yan background is estimated by CMS from the -veto rejection region. ATLAS estimates this background with the ABCDEF method in the (, ) plane. The background is estimated from the sideband, namely the -jets region. In contrast, CMS performs a simultaneous fit of the signal and two control regions, the 2-jet 1-tag and the 2-jet 2-tags samples. Results for both analyses are shown in Fig. 6.
The CMS analysis of 2.1 fb-1 measures a cross section in the Wt-channel of pb where statistical an systematic uncertainties have been combined. This corresponds to a 2.7 deviation from the background-only hypothesis, where 1.80.9 are expected. The dominant systematic uncertainty comes from the jet energy scale and jet resolution. Also the factorization / normalization scale, initial and final state radiation and -identification contribute significantly. The ATLAS analysis on the smaller dataset of 0.7 fb-1 yields a cross section of pb. As this is consistent with a background-only hypothesis on the 1.2 level, an upper bound on the Wt-channel cross section is derived. It is measured to be 39 pb, where 41 pb are expected. Dominant systematic uncertainty also in this case is the jet reconstruction including energy scale, resolution and efficiency. The generator choice is important as well. Although the analyzed dataset is still small compared to what is already available and will be provided in the future, the uncertainty is already dominated by systematics.
4 Measurement in the s-channel
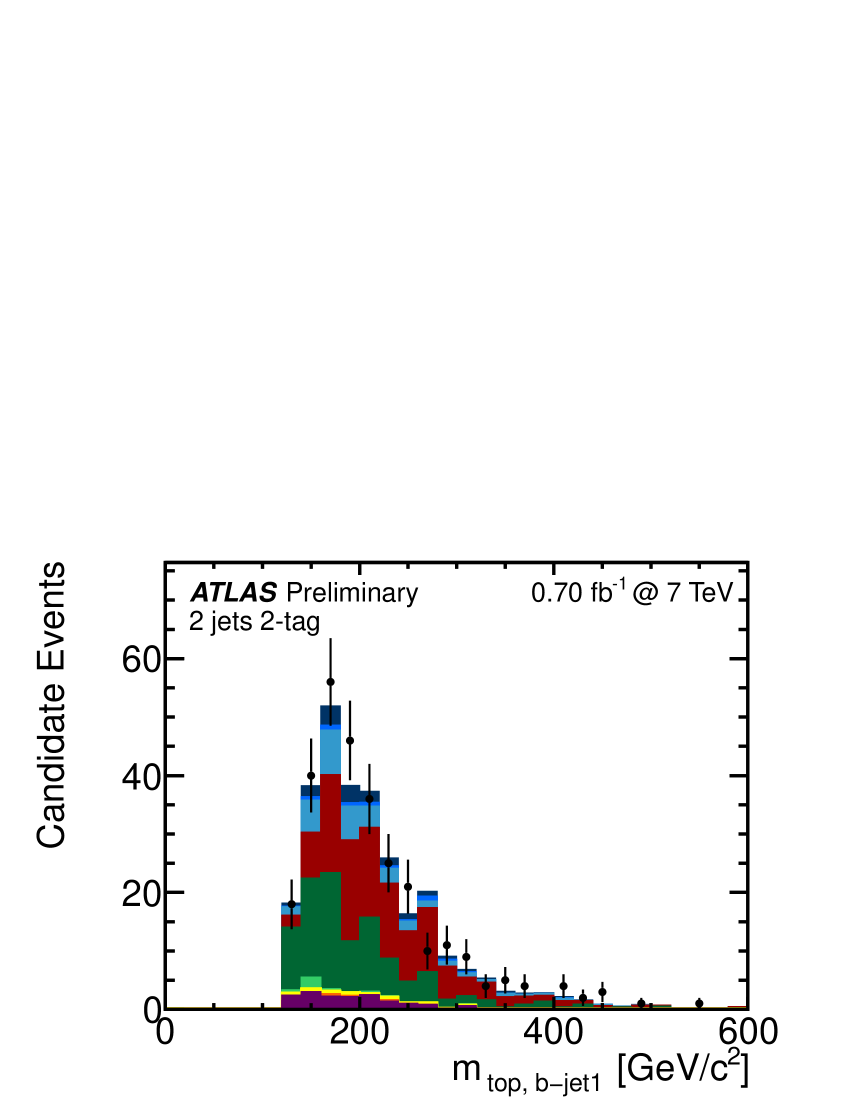
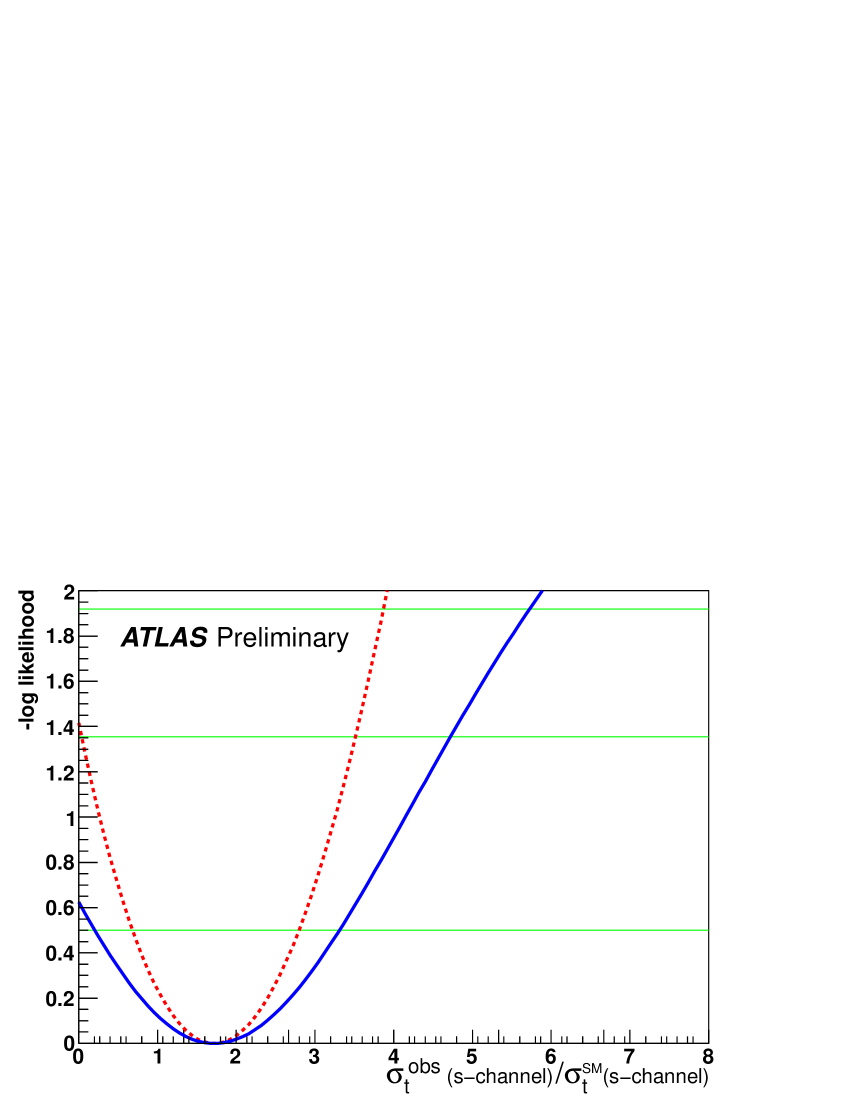
The s-channel, which has the smallest cross section of the three single top production channels has been addressed only by ATLAS so far. The analysis is based on 0.7 fb-1 ATL_s corresponding to the same 2011 dataset as the t-channel and Wt-channel analyses. Again, only leptonic decays to electrons or muons are taken into account. the transverse momentum of the lepton and jets are required to be larger than 25 GeV as well as the . The same cut on the transverse mass of the as in the t-channel analysis is performed (). The QCD multijet background is estimated from data from the distribution in a loose isolation lepton sample. The jets background shape is taken from Monte Carlo simulation whereas the overall normalization and contributions of the different flavour subsamples is derived from data. Background from other top production channels, i.e. and t-channel single top, is estimated from theory predictions. In a final selection step, exactly two jets identified as -̱jets are required. This brings from 0.26 to 0.88. In addition, cuts on the mass of the reconstructed top quark and the first, respectively second, jet, the transverse momentum of the two jets combined, the transverse mass of the reconstructed and the distance in between the first jet and the lepton as well as the two jets are performed. A detailed list of these cuts is given in ATL_s . This increases to 0.98. A total of 296 events are selected, where 28517 are predicted. Figure 7, left shows the reconstructed top mass distribution build from l, and the leading -jet.
A likelihood fit (cf. Fig. 7, right) is performed that yields an upper limit on s-channel single top production of 20.5 pb, where uncertainties have been taken into account. The expected limit is 26.5 pb. The dominant systematic uncertainties are roughly equal in size from Monte Carlo generator choice, luminosity estimate, QCD background normalization and -identification. This analysis is still statistically limited however the systematic uncertainty already contributes significantly.
5 Search for Flavour Changing Neutral Currents
Flavour Changing Neutral Currents (FCNC) in single top production are highly suppressed in the Standard Model. However, many models beyond the Standard Model (BSM) predict enhanced branching ratios for this process, which can be seen in Fig. 1d. Still, the expected signal is very small compared to background processes and only multivariate techniques seem to be promising in separating them.
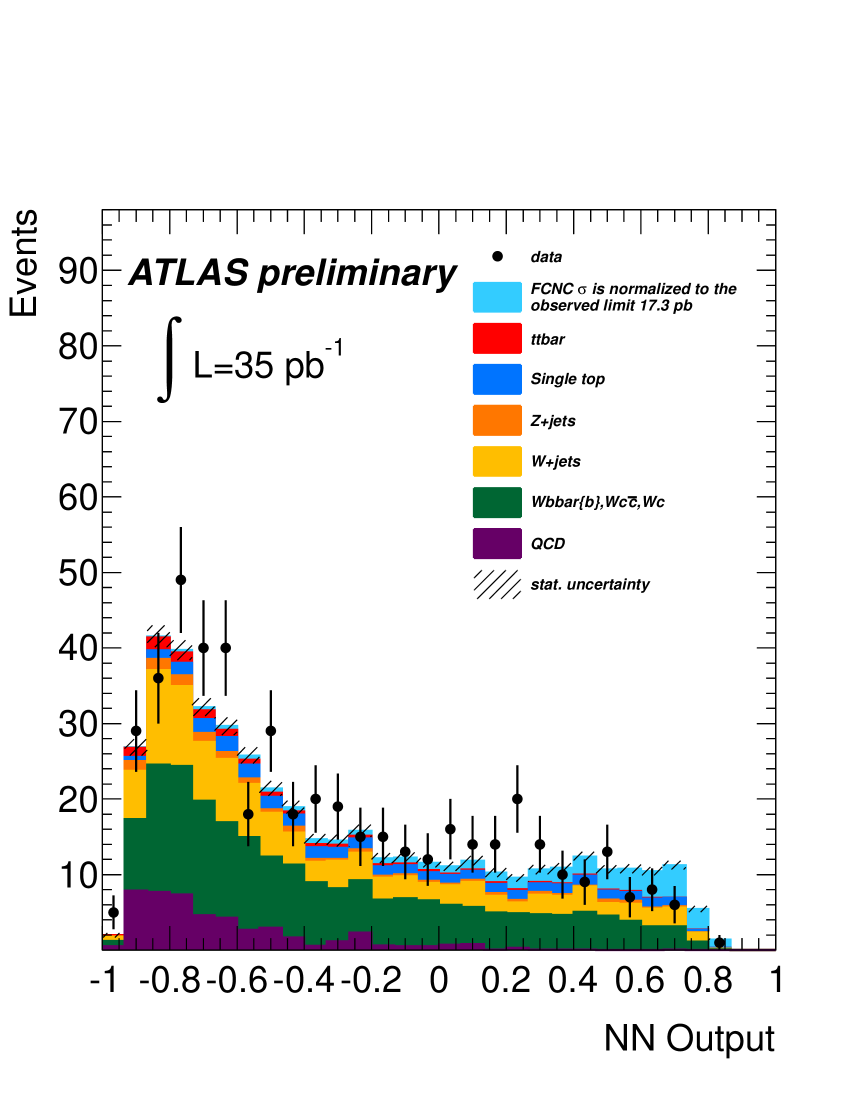
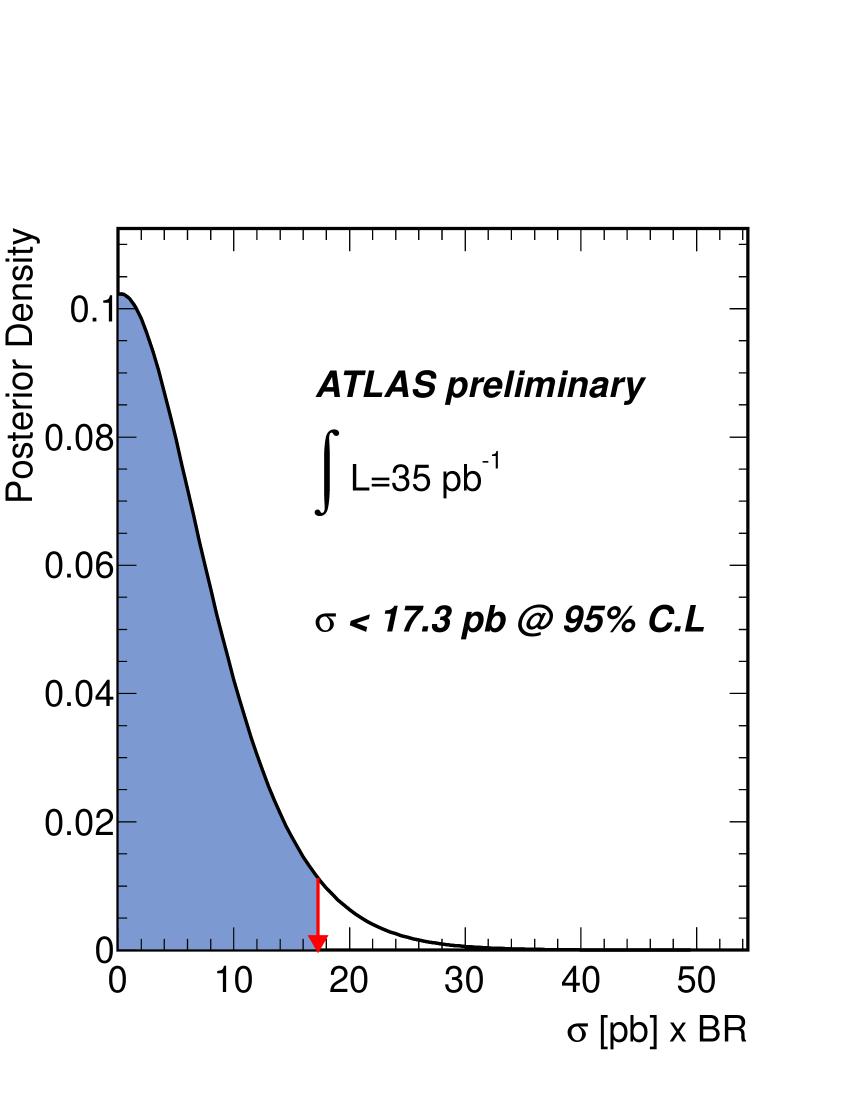
ATLAS has performed an analysis on 35 pb-1 ATL_FCNC , the full 2010 dataset, which is the first search for BSM processes in single top signatures. As in the previously described cross section analyses, only leptonic boson decays are considered, with an electron or muon above 25 GeV in the final state. Cuts on the missing transverse energy and the transverse mass of the require GeV (20 GeV) and GeV (60 GeV) in the electron (muon) channel. Events with exactly one jet, which has to be identified as a -jet, with a transverse momentum above 25 GeV are selected. A Neural Network is used to separate the signal from , SM single top production, / +jets and QCD multijet background. The result is shown in Fig. 8, left. No evidence for a signal has been found and an upper limit on a possible FCNC contribution has been derived (cf. Fig 8, right). On a 95% confidence level (C.L.), the cross section is smaller than 17.3 pb. This is in good agreement with the expected limit of 17.4 pb.
6 Conclusions
Analyses of single top production have been performed by the ATLAS and CMS collaborations in the t-channel and Wt-channel on 2010 and 2011 data. The t-channel has been established by ATLAS with a significance of 7.6 in a data sample of 700 pb-1. The cross section was measured as pb, with pb being expected in the Standard Model. This is the first observation of single top production at the LHC. CMS has analyzed the full 2010 dataset of 36 pb-1 and found evidence for t-channel single top production on the 3.5 level.
The Wt-channel has been measured for the first time as this channel was not accessible at the Tevatron. CMS found a cross section of pb with pb expected. Although this analysis has been performed on the largest dataset of 2.1 fb-1 in all single top analyses, the result is still compatible with the background-only hypothesis on the 2.7 level. ATLAS, on a smaller dataset of 0.7 fb-1, found a deviation of only 1.2 . However, it should be noted that a dataset of 5 fb-1 is already available in both collaborations, so that evidence in this channel can be expected in the near future. Both collaborations have shown that with the larger statistics available at the LHC simple cut-based analyses are possible in both channels and multivariate techniques, which were used at the Tevatron, are not a necessary prerequisite anymore.
The s-channel, with the smallest expected Standard Model cross section of pb, has been analyzed by ATLAS and a cross section limit of 26.5 pb at 95% C.L. was derived. Here, much more statistics are needed before evidence can be claimed.
A search for FCNC in single top production was performed by ATLAS for the first time and a cross section limit of 17.3 pb at 95% C.L. could be set. This analysis was performed on only 35 pb-1 of data, so that a reduced limit based on the larger 2011 dataset can be expected in the next round of analyses. This result shows that searches in single top signatures are already possible with the available datasets and the search program should be extended to more new phenomena signatures in the future.
References
- (1) N. Kidonakis, Phys.Rev. D81, (2010) 054028
- (2) N. Kidonakis, Phys.Rev. D82, (2010) 054018
- (3) N. Kidonakis, Phys.Rev. D83, (2011) 091503
- (4) The CMS Collaboration, PRL 107, (2011) 091802
- (5) The ATLAS Collaboration, ATLAS-CONF-2011-027, http://cdsweb.cern.ch/record/1336762
- (6) The ATLAS Collaboration, ATLAS-CONF-2011-088, http://cdsweb.cern.ch/record/1356197
- (7) The ATLAS Collaboration, ATLAS-CONF-2011-101, http://cdsweb.cern.ch/record/1369217
- (8) The CMS Collaboration, CMS-PAS-TOP-11-022, http://cdsweb.cern.ch/record/1385552
- (9) The ATLAS Collaboration, ATLAS-CONF-2011-104, http://cdsweb.cern.ch/record/1369829
- (10) The ATLAS Collaboration, ATLAS-CONF-2011-118, http://cdsweb.cern.ch/record/1376410
- (11) The ATLAS Collaboration, ATLAS-CONF-2011-061, http://cdsweb.cern.ch/record/1345084