Magnetodielectric effect in nickel nanosheet-Na-4 mica composites
Abstract
Nickel nanosheets of thickness 0.6 nm were grown within the nanochannels of Na-4 mica template. The specimens show magnetodielectric effect at room temperature with a change of dielectric constant as a function of magnetic field, the electric field frequency varying from 100 to 700 kHz. A decrease of 5% in the value of dielectric constant was observed up to a field of 1.2 Tesla. This is explained by an inhomogeneous two-component composite model as theoretically proposed recently. The present approach will open up synthesis of various nanocomposites for sensor applications.
Multiferroic materials 1 ; 2 have been shown to exhibit a coupling between the dielectric property and the static magnetic field 3 ; 4 ; 5 ; 6 . Magnetodielectric effect has been studied for various materials e.g, manganese oxide 5 double perovskites 7 . There has been a number of evidence given in the literature showing that the magnetodielctric effect in suitable composites could arise due to the presence of inhomogeneities in the system concerned 8 ; 9 ; 10 . The present work has been motivated by a recent theoretical analysis, which predicted that such an effect could be possible in a two component two dimensional composite media, the components having different conductivities 11 . Two-dimensional crystals of various materials have been the subject of investigation of late because of unusual properties expected in such systems 12 ; 13 ; 14 ; 15 . Chemical exfoliation of materials having layered structures has been adopted for generating flakes with few layers. A simple rubbing of fresh surfaces of suitably chosen crystals led to the formation of single layers of crystals 15 . Recently two dimensional single crystalline nickel of triangular and hexagonal shape have been grown by a solution phase method 16 ; 17 . These have thicknesses around 6 nm, and edge length of the order of 15.4 nm.
We have taken a template based approach to grow two dimensional silver 18 and compounds like 19 and GaN 20 ; 21 . For this purpose Na-4 mica, having the chemical composition , was used as the template. Na-4 mica has nanochannels within its crystal structure having a thickness of 0.6 nm 22 ; 23 . The structural characteristics of Na-4 mica allow the presence of four cations per unit cell. These can be exchanged with suitable ions which then contribute to the formation of the target compound after proper heat treatment. Because of a small thickness of the grown material, a much higher aspect ratio can be induced in it than that reported so far. In this letter, we report on the growth of Ni nanosheets within Na-4 mica channels. The composites exhibit magnetodielectric characteristics. The results are consistent with the inhomogeneous conductor model referred to earlier. The details are reported in this letter. Primarily Na-4 mica was synthesized by usual sol-gel technique. Synthesis of Na-4 mica has been described elsewhere 19 ; 24 . The Na-4 mica powder was kept inside a saturated solution of (as obtained from E.Merck (India) Ltd.) for two and a half months, at an elevated temperature 333K in an air oven, for the ion exchange reaction, to take place. The mixture was stirred from time to time. Besides the ion exchange process, the nanochannels were filled with molecules, which had gone into the channels by means of diffusion. The powder was then dried and washed thoroughly with deionised water several times, so that no molecule was left on the surface of the powdered sample. After few repetitions no trace of nickel was present in the filtrate as found by chemical group test. Dimethyl Glyoxime was added to the filtrate and no red colored precipitate was found which signified that there was no nickel in the filtrate. Then the sample was subjected to a reduction treatment. The powder, in an alumina boat, was brought to 1273 K in nitrogen atmosphere inside a tubular furnace and then it was subjected to Hydrogen () gas flow at that temperature for 1 hour. Hydrogen reduced the ions in the nanochannels to form nickel. The sample was brought back to room temperature by furnace cooling in nitrogen atmosphere.
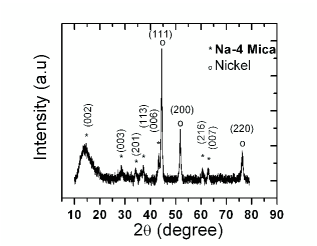
X-ray diffraction study on the samples was performed using monochromatic radiation (wavelength 0.1540 nm), (Bruker D8 XRD SWAX) starting from 2 =10o
to 80o.
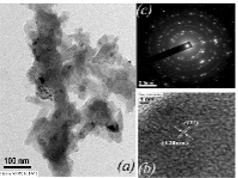
To study the microstructure, nickel nanosheets were extracted from the Na-4 mica channel by etching the composite sample with
40% HF aqueous solution and centrifuged in SORVALL RC 90 ultracentrifuge at 40,000 rpm for 30 minutes. The morphology and electron diffraction
pattern were studied by transmission electron microscope (JEOL 2010) operated at 200kV.
For dielectric and magnetoelectric coupling measurements the composite powder was cold pressed by applying a pressure of to form a pellet
of 1cm diameter and 1 mm thickness. Silver paint (supplied by M/S Acheson Colloiden, Netherland) was applied on both faces of the samples to form electrodes.
The capacitance change as a function of applied magnetic field (using a large water cooled electromagnet) was measured using an Agilent E4980A precision LCR meter.
In the latter measurement the orientation of the applied magnetic field was perpendicular to the electric field for determining the value of the dielectric constant.
From X-ray diffraction pattern of the composite sample, presence of both nickel and Na-4 mica can be confirmed with their corresponding lattice planes, marked on the figure 1 25 . Figure 2(a) shows the transmission electron micrograph of nickel nanosheets grown within Na-4 mica. Figure 2(b) gives the high resolution transmission electron micrograph of one of the nanosheets. The interplanar spacing obtained from the image is 0.20 nm, which is in agreement with the value for the (111) plane in nickel. The presence of nickel phase is further confirmed by figure 2(c), which shows the selected area electron diffraction pattern. The values are calculated from figure 2(c) and summarized in table 1. These are compared with Joint Committee on Powder Diffraction Standards (JCPDS) data (file no.04-0850) for nickel and Na-4 mica 25 . It is evident that the composite contains both the nickel and Na-4 mica phases confirming the growth of nickel films within the Na-4 mica structure.
| Observed | Na-4 mica | Nickel |
| (nm) | (nm) | (nm) |
| 0.25 | 0.244 | |
| 0.20 | 0.203 | |
| 0.15 | 0.15 | |
| 0.12 | 0.124 | |
| 0.10 | 0.101 | |
| 0.09 | 0.088 |
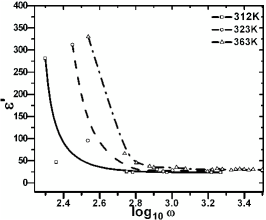
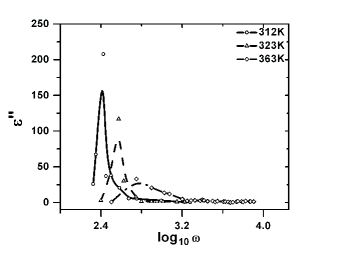
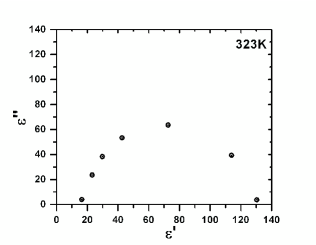
We have performed the dielectric permittivity measurement of the composite specimen and delineated the real and imaginary components of the same. Figures 3 and 4 show the frequency dependence of the real and imaginary parts respectively, measured at different temperatures. It is seen that the real part decreases from a high value as the frequency is increased, whereas the imaginary part clearly shows a Debye like relaxation peak 26 which shifts to higher frequencies as the temperature is increased. It is to be noted that the lines in figures 3 and 4 are drawn to guide the eye. The composite material shows dielectric dispersion and we have shown this more clearly in fig. 5 where a Cole-Cole diagram 26 has been plotted. It is evident that the semi-circle characterizes the dielectric data. This can be explained on the basis of a heterogeneous dielectric having laminae with different values of dielectric permittivity and electrical conductivity. It was shown earlier that such a system exhibits a dielectric dispersion with a single relaxation time 27 ; 28 . The laminae in our case comprise the nickel films within the nanochannels of Na-4 mica and the mica blocks constituted by silicon-oxygen tetrahedra and aluminum-oxygen octahedra. Thus the dielectric measurement and the analysis thereof establish the fact that this composite is electrically inhomogeneous.
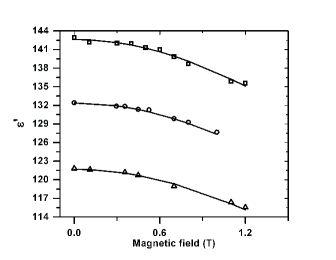
We have investigated a possible magnetodielectric effect in our system. This was motivated by a recent theoretical work in which it was shown that magnetocapacitance effect can be observed in a two component composite medium [11]. The physical mechanism is essentially based on the accumulation of space charge layer at the boundary of the conducting and non conducting layers respectively. This causes an effective dipole moment within the system which is reflected in the corresponding dielectric constant of the material. Application of a magnetic field causes movement of these charges perpendicular to both the electric and magnetic field directions (Hall effect). This brings about a lowering of the space charge and hence a decrease in the value of the dielectric constant. The dielectric permittivity of an inhomogeneous medium consisting of a purely resistive and purely capacitive region connected in series has been shown to be given by
| (1) |
where, is the effective dielectric permittivity, is the angular frequency of the applied electric field, the dielectric constant of the region in Na-4 mica containing the covalently bonded blocks comprising Si, Al, Mg, and O, , being the resistivity of the nickel nanofilm, and ; being carrier mobility and H the applied magnetic field. Figure 6 shows the variation of real part of effective dielectric permittivity of our sample as a function of magnetic field H. It is seen that decreases as H is increased. We have fitted the experimental data to equation (1) using as the parameter. A value of 29 for bulk nickel and = 17 24 for Na-4 mica were used in these calculations. The theoretically fitted points are also shown in figure 6. It is evident that the dielectric constant of the composite system shows an increase with the lowering of frequency. This is a characteristic feature of Maxwell-Wagner polarization effect 26 . Our dielectric data substantiate this aspect of the nanocomposite we have studied here.
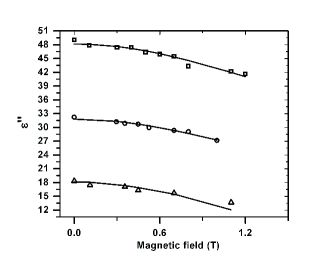
In figure 7 is shown the experimental and theoretically fitted data for the imaginary part of dielectric permittivity as a function of applied magnetic field. It is to be noted that the percentage changes in the real and imaginary parts of dielectric permittivity were found to be in the ranges of to and to respectively. A satisfactory agreement is observed between the two sets of values for all frequencies at which measurements were carried out. The theoretical analysis and successful fitting of the experimental data to the model of a two component two-dimensional composite medium validates the space charge polarization effect we have invoked in our discussion. The extracted value of is found to be 0.28 . The dimension of should be . The latter which is can be related by Faraday’s law of electromagnetic induction to . This is much larger than the mobility of carriers in the bulk nickel viz, . We argue that in our case the conducting phase i.e. nickel has got higher mobility due to its ultrathin configuration. Such an increase in mobility has been shown to occur in ultra-thin films 30 . This is related to a decrease in carrier density and a consequential increase in the average time between carrier collisions under the influence of an applied electric field. As the number of collisions decreases the movement of the carriers becomes much easier. This is reflected in an increase in mobility. It may be mentioned that the magnetodielectric effect studied here was measured with an electric field of frequency in the range 100 kHz to 700 kHz at room temperature with a maximum magnetic field applied as 1 Tesla. These are conditions ideal for the construction of a magnetic sensor as pointed out by earlier authors 8 .
Lastly, we need to point out that the present nanocomposite system contains nickel and as such the latter could be expected to contribute independently to its magnetodielectric behaviour. Our measurements show this material to be ferromagnetic, exhibiting superparamagnetic behavior above 428 K. Details of these properties will be reported elsewhere. It has not been possible to directly measure the magnetoresistance of the nickel films present in our system. However, we have used the magnetoresistance data of 80nm thick nickel film as reported in literature 31 . Using equation (1) and incorporating a negative change in resistivity of 0.3% at an applied magnetic field 1.2 T we estimated a change in dielectric constant of 0.14%. This is an order of magnitude less than the changes observed in our studies. Hence the effect of magnetoresistance of nickel on the magnetodielectric properties of our nanocomposite sample is negligible.
In summary, nanosheets of nickel with thickness equal to 0.6 nm have been grown within the nanochannels of Na-4 mica. The composites show dielectric relaxation behaviour expected of a two-phase laminar conductor. The specimens exhibit a magnetodielectric effect with a change of dielectric constant as a function of magnetic field of up to a field of 1.2 Tesla. The measurements were carried out at room temperature and with an electric field of frequency in the range 100 to 700 kHz. The results are explained on the basis of an inhomogeneous two-component composite model. This strategy of specimen preparation will lead to development of magnetic sensors for various applications.
References
- (1) N. A. Hill, J. Phys. Chem. B 104, 6694 (2000), http://dx.doi.org/10.1021/jp000114x
- (2) T. S. Chan, R. S. Liu, C. C. Yang, W.-H. Li, Y. H. Lien, C. Y. Huang, and J.-F. Lee, J. Phys. Chem. B 111, 2262 (2007), http://dx.doi.org/10.1021/jp067680y
- (3) J. Hemberger, P. Lunkenheimer, R. Fichtl, H.-A. K. von Nidda, V. Tsurkan, and A. Loidl, Nature 434, 364 (2005), http://dx.doi.org/10.1038/nature03348
- (4) T. Kimura, S. Kawamoto, I. Yamada, M. Azuma, M. Takano, and Y. Tokura, Phys. Rev. B 67, 180401(R) (2003), http://dx.doi.org/10.1103/PhysRevB.67.180401
- (5) N. Hur, S. Park, P. A. Sharma, S. Guha, and S.-W. Cheong, Phys. Rev. Lett. 93, 107207 (2004), http://dx.doi.org/10.1103/PhysRevLett.93.107207
- (6) M. P. Singh, W. Prellier, C. Simon, and B. Raveau, Appl. Phys. Lett. 87, 022505 (2005), http://dx.doi.org/10.1063/1.1988979
- (7) N. S. Rogado, J. Li, A. W. Sleight, and M. A. Subramanian, Adv. Mater. 17, 2225 (2005), http://dx.doi.org/10.1002/adma.200500737
- (8) G. Catalan, Appl. Phys. Lett. 88, 102902 (2006), http://dx.doi.org/10.1063/1.2177543
- (9) M. P. Singh, W. Prellier, L. Mechin, and B. Raveau, Appl. Phys. Lett. 88, 012903 (2006), http://dx.doi.org/10.1063/1.2159094
- (10) I. Fina, N. Dix, L. Fábrega, F. Sánchez, and J. Fontcuberta, Thin Solid Films 518, 4634 (2010), http://dx.doi.org/10.1016/j.tsf.2009.12.048
- (11) M. M. Parish and P. B. Littlewood, Phys. Rev. Lett. 101, 166602 (2008), http://dx.doi.org/10.1103/PhysRevLett.101.166602
- (12) M. S. Dresselhaus and G. Dresselhaus, Adv. Phys. 51, 1 (2002), http://dx.doi.org/10.1080/00018730110113644
- (13) L. M. Viculis, J. J. Mack, and R. B. Kaner, Science 299, 1361 (2003), http://dx.doi.org/10.1126/science.1078842
- (14) K. Novoselov, A. K. Geim, S. V. Morozov, D. Jiang, Y. Zhang, S. V. Dubonos, I. V. Grigorieva, and A. A. Firsov, Science 306, 666 (2004), http://dx.doi.org/10.1126/science.1102896
- (15) K. S. Novoselov, D. Jiang, F. Schedin, T. J. Booth, V. V. Khotkevich, S. V. Morozov, and A. K. Geim, Proc. Natl. Acad. Sci. U.S.A 102, 10451 (2005), http://dx.doi.org/10.1073/pnas.0502848102
- (16) Y. Leng, Y. Wang, X. Li, T. Liu, and S. Takahashh, Nanotechnology 17, 4834 (2006), http://stacks.iop.org/0957-4484/17/i=19/a=009
- (17) Y. Leng, Y. Li, X. Li, and S. Takahashi, J. Phys. Chem. C 111, 6630 (2007), http://dx.doi.org/10.1021/jp0676686
- (18) A. Bose, B. N. Pal, A. Datta, and D. Chakravorty, J. Non-Cryst. Solids 355, 1448 (2009), http://dx.doi.org/10.1016/j.jnoncrysol.2009.05.045
- (19) A. Dan, P. K. Mukherjee, and D. Chakravorty, J. Mater. Chem. 15, 1477 (2005), http://dx.doi.org/10.1039/b417240j
- (20) S. Bhattacharya, A. Datta, S. Dhara, and D. Chakravorty, J. Phys. D: Appl. Phys. 42, 235504 (2009), http://stacks.iop.org/0022-3727/42/i=23/a=235504
- (21) S. Bhattacharya, A. Datta, and D. Chakravorty, Appl. Phys. Lett. 96, 093109 (2010), http://dx.doi.org/10.1063/1.3340897
- (22) T. Kodama and S. Komarneni, J. Mater. Chem. 9, 533 (1999), http://dx.doi.org/10.1039/a806758i
- (23) T. Kodama, Y. Harada, M. Ueda, K. ichi Shimizu, K. Shuto, S. Komarneni, W. Hoffbauer, and H. Schneider, J. Mater. Chem. 11, 1222 (2001), http://dx.doi.org/10.1039/b009418h
- (24) P. K. Mukherjee, K. Chatterjee, and D. Chakravorty, Phys. Rev. B 73, 035414 (2006), http://dx.doi.org/10.1103/PhysRevB.73.035414
- (25) M. Park, D. H. Lee, C. L. Choi, S. S. Kim, K. S. Kim, and J. Choi, Chem. Mater. 14, 2582 (2002), http://dx.doi.org/10.1021/cm0116267
- (26) A. R. von Hippel, Dielectrics and Waves (The MIT Press, Massechusets,USA, 1966)
- (27) J. Isard, Proc.Inst.Electr.Eng. 109B, 440 (1962)
- (28) K. S. Cole and R. H. Cole, J.Chem.Phys. 9, 341 (1941)
- (29) C. Hodgman, Handbook of Chemistry and Physics (The Chemical Rubber Publishing Company, Cleaveland, 1962)
- (30) H. Du, J. Gong, C. Sun, S. W. Lee, and L. S. Wen, J. Mater. Sci. 39, 2865 (2004), http://dx.doi.org/10.1023/B:JMSC.0000021466.73734.b1
- (31) P. D. Sparks, N. P. Stern, D. S. Snowden, B. A. Kappus, J. G. Checkelsky, S. S. Harberger, A. M. Fusello, and J. C. Eckert, J. Magn. & Magn. Mater. 272-276, E1339 (2004), http://dx.doi.org/10.1016/j.jmmm.2003.12.586