HI content, metallicities and spin temperatures of damped and sub-damped Lyman alpha systems in the redshift desert ().††thanks: Based on observations made with ESO Telescopes at the La Silla Paranal Observatory under programme IDs 082.A-0569, 166.A-0106, and 085.A-0258, and observations made with the NASA/ESA Hubble Space Telescope, obtained from the data archive at the Space Telescope Institute. STScI is operated by the association of Universities for Research in Astronomy, Inc. under the NASA contract NAS 5-26555. These observations are associated with programs 9051 and 12214.
Abstract
The H i 21 cm absorption optical depth and the (H i) column density derived from Ly absorption can be combined to yield the spin temperature (Ts) of intervening damped Ly absorbers (DLAs). Although spin temperature measurements exist for samples of DLAs with and , the intermediate redshift regime currently contains only two H i 21 cm detections, leading to a “redshift desert” that spans 4 gigayears of cosmic time. To connect the low and high redshift regimes, we present observations of the Ly line of six H i 21 cm absorbers. The dataset is complemented by both low-frequency Very Long Baseline Array (VLBA) observations (to derive the absorber covering factor, ), and optical echelle spectra from which metal abundances are determined. Our dataset therefore not only offers the largest statistical study of H i 21 cm absorbers to date, and bridges the redshift desert, but is also the first to use a fully -corrected dataset to look for metallicity-based trends.
The metallicities of H i 21 cm absorbers are consistent with those of optically-selected DLAs at the same redshift. In agreement with trends found in Galactic sightlines, we find that the lowest column density absorbers tend to be dominated by warm gas. In the DLA regime, spin temperatures show a wider range of values than Galactic data, as may be expected in a heterogenous galactic population. However, we find that low metallicity DLAs are dominated by small cold gas fractions and only absorbers with relatively high metallicities exhibit significant fractions of cold gas. Using a compilation of H i 21 cm absorbers which are selected to have covering-factor corrected spin temperatures, we confirm an anti-correlation between metallicity and Ts at significance. Finally, one of the DLAs in our sample is a newly-discovered H i 21 cm absorber (at towards J1431+3952), which we find to have the lowest -corrected spin temperature yet reported in the literature: Ts K. The observed distribution of Ts and metallicities in DLAs and the implications for understanding the characteristics of the interstellar medium in high redshift galaxies are discussed.
keywords:
galaxies: high redshift, galaxies: ISM, galaxies: abundances, quasars: absorption lines.1 Introduction
The interstellar medium (ISM) gas in galaxies represents the raw material for star formation through cosmic time. With current instrumentation, the most effective way to study this gas (in its neutral, ionised and molecular phases) is with absorption spectra towards bright, high redshift sources such as quasars and gamma-ray bursts (e.g. Rauch 1998; Vreeswijk et al. 2004; Wolfe, Gawiser & Prochaska 2005; Prochaska et al. 2007b; Ledoux et al. 2009). The damped Lyman- systems (DLAs) and sub-DLAs (with log (H i) 20.3 and 19.0 log (H i) 20.3, respectively) have garnered particular attention as the galactic scale absorbers that contain the bulk of the neutral gas, and which can be readily identified in relatively low resolution spectra (e.g. Wolfe et al. 1986; Storrie-Lombardi & Wolfe 2000; Ellison et al. 2001; Peroux et al. 2003; Rao, Turnshek & Nestor 2006). There are now some 1000 DLAs identified, with the largest haul coming from the Sloan Digital Sky Survey (SDSS; Noterdaeme et al. 2009; Prochaska & Wolfe 2009). High resolution spectroscopic follow-up has yielded chemical abundances for over 200 DLAs and sub-DLAs (e.g. Prochaska et al. 2007a; Akerman et al. 2005; Dessauges-Zavadsky, Ellison & Murphy 2009; Meiring et al. 2009). These abundance measurements have been brought to bear on several issues of nucleosynthetic origin and enrichment mechanisms (e.g. Pettini et al. 2000, 2002; Ellison, Ryan & Prochaska 2001; Prochaska et al. 2002; Dessauges-Zavadsky et al. 2002; Ledoux, Bergeron & Petitjean 2002; Cooke et al. 2011).
Despite this wealth of spectroscopic data, surprisingly little is known about the optical emission properties (such as morphologies and luminosities) of DLA and sub-DLA galaxies. Whilst there has been some success in imaging the host galaxies at low redshifts (e.g. Le Brun et al. 1997; Chen & Lanzetta 2003; Chun et al. 2010; Rao et al. 2003, 2011), only a handful of high galaxy counterparts have been identified (e.g. Warren et al. 2001; Weatherley et al. 2005; Fynbo et al. 2010, 2011; Noterdaeme et al. 2012). To address the difficulty of detecting high redshift DLA galaxies, several novel observing techniques have been initiated, such as imaging below the Lyman limit of a higher redshift absorber or using integral field units (O’Meara, Chen & Kaplan 2006; Fumagalli et al. 2010; Peroux et al. 2011). At least at lower redshifts, where the sample sizes are sufficient to draw general conclusions, galaxies selected based on their H i properties alone seem to represent a wide variety of galaxy morphologies and luminosities (e.g. Rao et al. 2003, 2011).
Ultimately, however, it is perhaps the physical conditions within the ISM that may reveal more about the nature and processes in high redshift galaxies. There are a few promising avenues for making such measurements in DLAs. For example, in cases where molecular hydrogen is detected (e.g. Ge & Bechtold 1997; Ledoux et al. 2003; Noterdaeme et al. 2008) the relative populations of the rotationally excited states can be used to constrain temperatures and densities in the ISM (e.g. Srianand et al. 2005; Noterdaeme et al. 2007, 2010). In cases where the background QSO is radio-loud, an alternative measure of the temperature can be obtained through observations of the H i 21 cm line in absorption. In combination with the H i column density (measured from the Ly absorption profile), the H i 21 cm optical depth yields the so-called spin temperature (Ts) of the neutral gas. For the general case of multiple phases of neutral gas along the line of sight (e.g. a cold phase with a kinetic temperature of K and a warm phase with a kinetic temperature of K; Wolfire et al. 2003), the derived spin temperature gives the column density weighted harmonic mean of the spin temperatures of the multiple phases, and thus the distribution of neutral gas in different phases of the ISM (e.g. Kanekar & Briggs 2004). Since the detection of molecular hydrogen in DLAs is biased towards the highest metallicity systems (Petitjean et al. 2006; Noterdaeme et al. 2008), the use of spin temperatures is an appealing option for a more general overview of conditions in the neutral ISM.
Despite its promise, the collection of spin temperature measurements in DLAs has been fairly slow, with the first 25 years of H i 21 cm absorption studies yielding only 10 detections in DLAs at all redshifts, with only 3 detections at (e.g. Brown & Roberts 1973; Wolfe & Davis 1979; Wolfe, Briggs & Jauncey 1981; Wolfe et al. 1985; Lane et al. 1998; Chengalur & Kanekar 1999). The primary reason for the lack of spin temperatures is the paucity of DLAs at suitable redshifts in front of radio-loud QSOs. Moreover, the relatively narrow bandwidth of spectrometers has generally made blind H i 21 cm absorption surveys impractical. The last decade has seen notable improvement in H i 21 cm absorption statistics, due to progress on several fronts. First, optical spectroscopic surveys that include large numbers of QSOs are now available to cross-correlate with all-sky radio surveys. This approach has led to the detection of H i 21 cm absorption associated with DLAs and Mg ii absorbers towards SDSS QSOs (e.g. Kanekar et al. 2009b; Gupta et al. 2009; Srianand et al. 2010, 2012). A more targeted approach is to design an optical search for DLAs towards radio-loud QSOs (Ellison et al. 2001; Jorgenson et al. 2006; Ellison et al. 2008). To fully exploit these new surveys, there has also been progress on the technical side, with improvements in the frequency range accessible by large radio telescopes such as the Westerbork Synthesis Radio Telescope (WSRT), the Green Bank Telescope (GBT) and the Giant Metrewave Radio Telescope (GMRT). As a result of these advances, the opportunity now exists to gather significant numbers of Ts measurements in DLAs at high redshifts, .
Almost immediately, the measurements of Ts in high redshift DLAs yielded a surprise result: whereas DLAs exhibit a range of spin temperatures, the sample of absorbers at appeared to be dominated by spin temperatures in excess of 1000 K (Carilli et al. 1996; Chengalur & Kanekar 2000; Kanekar & Chengalur 2003; Kanekar et al. 2007; Kanekar et al. 2012). Although York et al. (2007) discovered the first low Ts DLA at , whether or not there is a wholesale evolution in Ts with redshift has remained a hotly debated topic (e.g. Kanekar & Chengalur 2003; Wolfe, Gawiser & Prochaska 2003; Curran et al. 2005; Kanekar et al. 2009c). In addition to being limited by statistics, there has been considerable focus on the possible effect of the so-called covering factor, (e.g. Wolfe, Gawiser & Prochaska 2003; Curran et al. 2005; Kanekar et al. 2009a). If the background radio source is extended, then the foreground absorber will not fully cover it; this would imply a low covering factor, . Since most H i 21 cm absorption studies actually determine the ratio Ts/ (and not Ts alone), assuming would result in an over-estimate of the spin temperature. It has also been claimed (Curran & Webb 2006) that due to cosmological geometry, different covering factors are to be expected in different redshift regimes. In particular, absorbers at high redshifts, , are always at larger angular diameter distances than the background QSOs, potentially leading to systematically lower covering factors for higher redshift DLAs. However, in a Very Long Baseline Array (VLBA) study of radio-loud QSOs with foreground DLAs, Kanekar et al. (2009a) found none of the 24 DLAs of their sample have , and that there was no difference in the distributions of the covering factors of the high- and low- DLA samples. Kanekar et al. (2009a) hence concluded that low covering factors in high- DLAs were not the cause of the apparent redshift evolution in the spin temperature.
A second intriguing suggestion involving spin temperatures is the possible anti-correlation between Ts and metallicity (Kanekar et al. 2009c). Since metals are the primary coolant in the ISM, one would expect the fraction of cold gas to increase as the metallicity increases (Kanekar & Chengalur 2001). Kanekar et al. (2009c) reported a tentative detection of this anti-correlation at significance from a sample of 26 DLAs, of which 10 had measurements of (rather than limits on) both Ts and metallicity. Again, the absorber covering factors were available for only a subset of the DLAs.
The main challenge in confirming the redshift evolution of Ts and the anti-correlation of Ts and metallicity is simple statistics. For example, there remains a glaring gap in the redshift coverage of Ts measurements between , the so-called H i 21 cm redshift desert. There are only two published H i 21 cm detections in DLAs in this regime, which spans 4 gigayears in cosmic time (Brown & Roberts 1973; Kanekar et al. 2009b). To fill this regime, several surveys have searched for H i 21 cm absorption in strong Mg ii systems that have been identified from ground-based optical surveys (e.g. Ellison et al. 2004; Prochter, Prochaska & Burles 2006). Although these H i 21 cm surveys have now yielded a significant number of H i 21 cm absorption detections in the redshift desert (Gupta et al. 2007, 2009; Srianand et al. 2008; Kanekar et al. 2009b), the critical (H i) measurements required to determine the spin temperatures have been missing. A second obstacle has been determining covering factors for the full redshift range of H i 21 cm absorbers, since these corrections are required to confidently test any trends in Ts.
In this paper, we present a comprehensive set of multi-wavelength data for six H i 21 cm absorbers in the redshift desert. This is an effective way to improve spin temperature statistics since the main limitation of identifying systems with H i 21 cm detections has already been addressed. The data span six decades in rest wavelength ranging from near ultra-violet (UV) absorption at 1216 Å through the optical and out to the redshifted 21 cm line frequency in the radio regime. The sample is selected primarily based on H i 21 cm absorption in a sample of strong Mg ii absorbers (Gupta et al. 2009; Kanekar et al. 2009b). The near-UV data cover the Ly transition, from which the H i column density of the absorber can be measured. We also present VLBA images of all of the QSOs in order to determine their low-frequency covering factors. Finally, we complement the dataset with optical echelle spectra that permit the measurement of the column densities of a variety of elements. Combined with the (H i) measurements from the Ly data, we can hence also determine metal abundances. The dataset presented here is therefore unique at this redshift and represents the first systematic study of metallicities and spin temperatures in the redshift desert. In this paper, we focus on the metallicities of H i 21 cm absorbers. In a companion paper (Kanekar et al. in preparation) we will address the issue of Ts evolution.
2 Observations
| QSO | NUV | Optical | |||
|---|---|---|---|---|---|
| mag. | mag. | (Jy) | |||
| B0105008 | 1.374 | 1.37078 | 18.8 | 0.93 | |
| B0237233 | 2.223 | 1.67235 | 19.5 | 6.26 | |
| B0801+303 | 1.451 | 1.19110 | 19.8 | 1.27 | |
| J1431+3952 | 1.215 | 0.60190 | … | 0.22 | |
| J1623+0718 | 1.648 | 1.33567 | … | 0.081 | |
| B2355106 | 1.639 | 1.17303 | 20.7 | 0.77 |
2.1 H i 21 cm spectroscopy with the GBT


The targets in our sample are listed in Table 1. Of the 6 absorbers included in the current sample, 5 have previously published H i 21 cm detections with the GMRT or the GBT (Kanekar et al. 2009b; Gupta et al. 2009). The final target, J1431+3952, is a new H i 21 cm absorption detection that we present here for the first time. For completeness, the details of the H i 21 cm detections of all six absorbers in our sample, including J1431+3952, are given in Table 2.
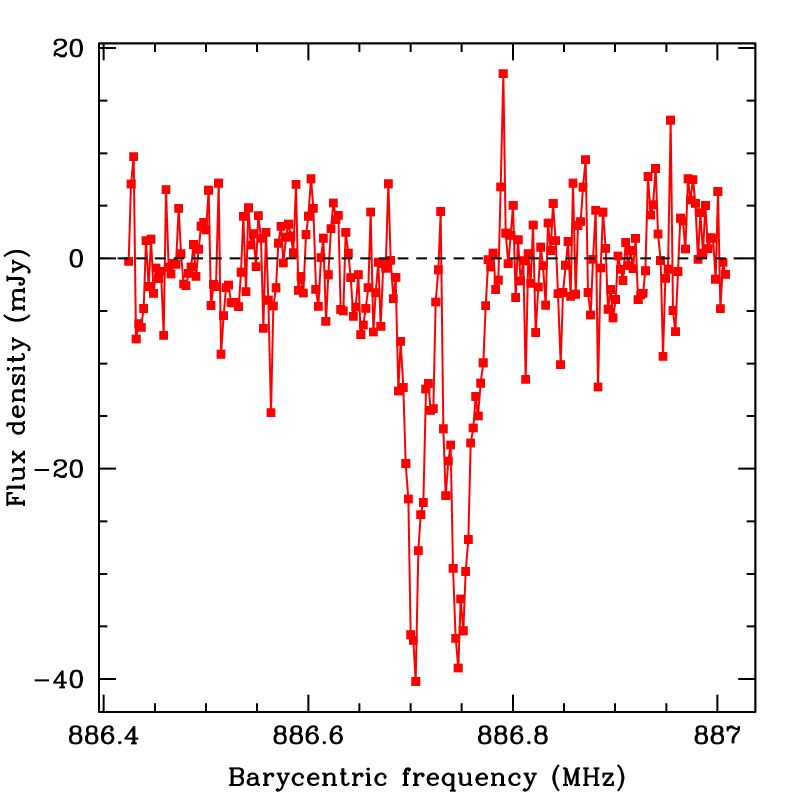
We initially observed J1431+3952 with the GBT on September 29 2009, using the PF1-800 receiver, the Spectral Processor and a 2.5 MHz bandwidth centred at 886.645 MHz and sub-divided into 1024 channels. This was part of a large new GBT H i 21 cm absorption survey of strong Mg ii absorption systems (proposal AGBT10B_008; PI Kanekar). Position-switching with an On/Off time of 5 minutes was used to calibrate the bandpass, while the system temperature was determined via a blinking noise diode. The total on-source time was 15 minutes, sub-divided into 10-second integrations.
The initial observations of J1431+3952 revealed a strong absorption feature at the expected redshifted H i 21 cm line frequency. We hence repeated the observations on October 20 2010 and January 21 2011, using a 1.25 MHz bandwidth to obtain higher velocity resolution, as well as longer integration times (30 minutes on-source at each epoch). These observations confirmed the 21 cm absorption by a detection of the doppler shift in the observed H i 21 cm line frequency, due to the Earth’s motion around the Sun.
The GBT data were analysed using the NRAO AIPS++ single-dish package DISH, following standard procedures. The data were first visually inspected for radio frequency interference (RFI) and Spectral Processor failures, with corrupted data edited out. After editing, the individual spectra were calibrated and averaged together, in the barycentric frame, to measure the flux density of J1431+3952 at 886.64 MHz. A second-order spectral baseline was then fit to each 10-second spectrum, during calibration, and subtracted out, before averaging the residual spectra together, again in the barycentric frame, to produce the final spectrum.
We note that very different source flux densities were obtained in the October and January observing runs ( mJy), although the depth of the absorption features agree within the noise. The strong out-of-band RFI present above 887 MHz makes it difficult to accurately calibrate the flux density scale in such total power measurements. We have used the average flux density from the two runs ( mJy) to compute the H i 21 cm optical depth; the final quoted error includes the above systematic error in the flux density scale calibration, assumed to be mJy, i.e. %.
The final H i 21 cm spectrum from the higher-resolution observations of 2010 October and 2011 January is shown in Fig. 1; this has a velocity resolution of 0.83 km s-1 (after Hanning-smoothing and re-sampling) and a root mean square (RMS) noise of 4.5 mJy per independent 0.83 km s-1 spectral channel. Two clear features are visible in the spectrum, with depths of mJy; each has high statistical significance and was detected on all three observing runs. The integrated H i 21 cm optical depth is km s-1, where we have added in quadrature the errors on the integrated flux density and the flux density scale.
| QSO | Telescope | Resolution | On-source Time | RMS | dV | Reference |
|---|---|---|---|---|---|---|
| (km s-1) | (hours) | (mJy) | (km s-1) | |||
| B0105008 | GMRT | 2.0 | 3.5 | 3.3 | Kanekar et al. (2009b) | |
| B0237233 | GBT | 0.69 | 1.5 | 56 | Kanekar et al. (2009b) | |
| B0801+303 | GMRT | 3.6 | 5.0 | 2.2 | Kanekar et al. (2009b) | |
| J1431+3952 | GBT | 0.8 | 1.0 | 8.3 | This work | |
| J1623+0718 | GMRT | 3.9 | 11.7 | 1.0 | Gupta et al. (2009) | |
| B2355106 | GMRT | 1.8 | 4.0 | 2.5 | Kanekar et al. (2009b) |
2.2 High spatial resolution radio imaging with the VLBA
| QSO | On-source | Frequency | Beam | RMS | Ang. size | Spatial extent | |||
|---|---|---|---|---|---|---|---|---|---|
| time (hours) | (MHz) | (mas2) | (mJy/Bm) | (Jy) | (Jy) | mas mas | pc2 | ||
| B0105008 | 2.0 | 606 | 4.0 | 0.403 | 1.26 | 0.32 | |||
| B0237233 | 2.0 | 606 | 23 | 4.95 | 5.53 | 0.90 | |||
| B0801+303 | 2.0 | 606 | 2.3 | 0.053 | 2.45 | 0.02 | |||
| J1431+3952 | 1.6 | 1420 | 0.14 | 0.065 | 0.207 | 0.32 | |||
| J1623+0718 | 2.0 | 1420 | 0.21 | 0.028 | 0.081 | 0.34 | |||
| B2355106 | 2.0 | 606 | 2.2 | 0.42 | 0.42 | 1.0 |
We used the VLBA in proposals BK159 and BK174 (PI Kanekar) to obtain high spatial resolution images of five of the background quasars of our sample, at frequencies close to the redshifted H i 21 cm line frequency. The observations of four targets (B0105008, B0237233, B0801+303 and B2355106) used the 606 MHz receivers, while J1431+3952 was observed with the 1.4 GHz receivers. The 606 MHz observations were carried out on 11 September 2009 and 4 January 2010 using two adjacent 2 MHz baseband channel pairs, while the 1.4 GHz observations were carried out on 27 December 2011 using four adjacent 16 MHz baseband channel pairs, both with right- and left-hand circular polarizations, and sampled at 2 bits. The 606 MHz and the 1.4 GHz data were correlated using the VLBA hardware correlator and the VLBA DiFX software correlator (Deller et al. 2011) in Socorro, NM, respectively, with a 4 second correlator integration time and 32 spectral channels per respective baseband channel. The total bandwidth of the data was 4 and 64 MHz for the 606 MHz and 1.4 GHz observations, respectively. Phase referencing was not used. Bandpass calibration was carried out using observations of the strong calibrators 3C345, 3C454.3, 3C48 and 3C147. The total on-source time was hours for the 606 MHz targets and 1.6 hours for J1431+3952. In addition, we also retrieved and analysed an archival VLBA 1.4 GHz dataset on the last source in our sample, J1623+0718 (proposal BG0189, PI Gupta); these observations had a similar setup to the above noted 1.4 GHz observations but used four adjacent 8 MHz baseband channel pairs, resulting in a total bandwidth of 32 MHz.
The VLBA data were analysed in “classic” AIPS, using standard procedures. After applying the initial ionospheric corrections and editing data affected by RFI, the flux density scale was calibrated using the measured antenna gains and system temperatures. This was followed by fringe-fitting for the delay rates and bandpass calibration, after which the data towards each target were averaged in frequency to produce a single-channel visibility dataset. The 606 MHz data were found to be of relatively low quality, with only 6-7 working antennas and poor ionospheric conditions. A number of cycles of self-calibration and imaging were used to derive the antenna-based gains for each target, with phase-only self-calibration used for the 606 MHz datasets and amplitude-and-phase self-calibration for the 1.4 GHz datasets. For each source, the above cycles were repeated until no improvement was seen on further self-calibration. The final images obtained from the above procedure are shown in Fig. 2, in order of increasing right ascension. For each source, the synthesised beam and off-source RMS noise are listed in Table 3.
Finally, the AIPS task JMFIT was used to fit a gaussian model to the radio continuum images, to measure the compact flux density of each quasar. A single gaussian was used as the model for all sources but J1431+3952 and B0105008, where a 2-gaussian model was used due to the clear presence of a jet or extended structure. The VLBA results are summarised in Table 3, whose columns contain (1) the source name, (2) the on-source time, (3) the observing frequency (MHz), (4) the synthesised beam, (5) the RMS noise (mJy/Bm), (6) the integrated core flux density (Jy) from the VLBA images, obtained using JMFIT, (7) the total flux density from low resolution interferometric images at a similar frequency (Jy), (8) the deconvolved angular size of the core radio emission, in mas mas, (9) the spatial extent of the core emission at the absorber redshift, and (10) the covering factor , obtained by taking the ratio of the core flux density to the total flux density. We do not quote formal errors on the covering factor for two reasons. First, the VLBA and low-frequency measurements were not carried out simultaneously, which means that it is hard to account for source variability in the error estimates. Second, it is possible that the foreground DLA also covers some of the extended radio emission, making the values of lower limits. For two sources (B0105008 and J1431+3952), the deconvolved angular size and the spatial extent are along one axis; this implies that the core is unresolved along this axis, with an angular size significantly smaller than the VLBA synthesised beam.
2.3 Near UV spectroscopy with HST/COS
Hubble Space Telescope (HST) Cosmic Origins Spectrograph (COS) spectra have been obtained for 4 of the 6 absorbers in our sample (proposal ID 12214, PI Ellison). For B0237, the Ly line is covered by a Very Large Telescope (VLT) UV and Visual Echelle Spectrograph (UVES) spectrum and discussed in Section 2.4. The final target, J1431+3952, has an existing archival HST Space Telescope Imaging Spectrograph (STIS) spectrum from Cycle 10 (proposal ID 9051, PI Becker) for which we use the pipeline-reduced spectrum available from the archive.
The HST/COS data were obtained with the near-UV (NUV) channel and the G230L grating which yields a full width at half maximum (FWHM) resolution of 0.8 Å. The target was acquired using Guide Star Catalog 2 (GSC2) coordinates in ACQ/IMAGE mode in order to minimise acquisition overheads. Spectroscopic data were obtained in TIME-TAG mode with at least two exposures per target, each in a different FP-POS position. Total exposure times and central wavelength settings are given in Table 4.
The COS spectra were homogeneously reduced using CALCOS v2.15.4 and custom routines for background estimation and co-addition of individual exposures in the Poisson limit (e.g. Worseck et al. 2011). The data were flat-fielded, deadtime-corrected, doppler-corrected and wavelength-calibrated using the default CALCOS calibration files as of September 2011. For 1-d extraction we adjusted the source extraction window to a rectangular box (height 17 pixels, corresponding to 5 the spatial FWHM) to preserve integer extracted counts in the Poisson regime, and to maximise the signal-to-noise ratio (S/N) for our well-centred point sources. Likewise, the background extraction windows were maximised (150 pixels each), and background smoothing by the pipeline turned off to investigate spectral variations of the background. After visual inspection, the smoothed background was determined by a 51-pixel running average in wavelength. Individual exposures were co-added by adding the integer source counts and the non-integer mean background per pixel on the homogeneous NUV wavelength grid, accounting for individual pixel exposure times induced by offsets in dispersion direction. The counts were then flux-calibrated with the NUV flux calibration curve and the pixel exposure times. The S/N ratios per pixel (in the continuum on either side of the Ly absorption) of the final combined spectra are given in Table 4.
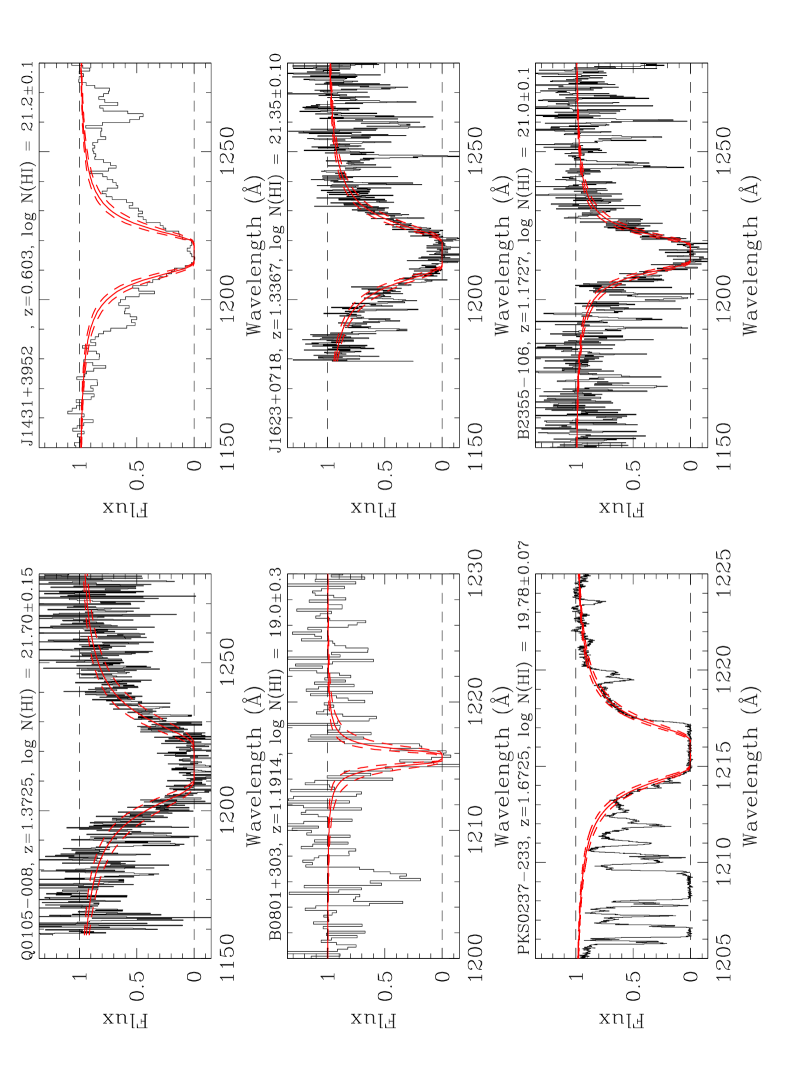
The Starlink package DIPSO was used to model a Voigt-profile absorption to the normalised spectra. To normalise the spectra, a cubic spline was fit through unabsorbed regions of the QSO continuum and the data then divided by the polynomial fit. Despite the relatively low S/N, the (H i) could usually be determined to within 0.1 dex, which is typical for moderate resolution spectra of low S/N (e.g. Russell, Ellison & Benn 2006). The dominant source of error in (H i) is from uncertainty in the continuum placement. This is a particular issue for the proximate DLA towards B0105008 where the Ly absorption lies on top of the QSO’s Ly emission. Nonetheless, errors on (H i) are less 0.15 dex for all the bona-fide DLAs (log (H i) 20.3) in our sample. Table 4 lists the measured (H i) column densities for both the COS and STIS data and Figure 3 presents the Ly fits to the absorbers in our sample.
From Table 4 it can be seen that 4/6 absorbers in our sample qualify as DLAs; indeed these 4 have high H i column densities, in excess of 1021 cm-2. The absorbers towards B0801+303 and B0237233 have (H i) values below the DLA threshold, but can still be well fit with reasonable accuracy and fall into the category of sub-DLAs.
| QSO | Telescope/ | Grating/ | # | Time | S/N | log N(HI) |
|---|---|---|---|---|---|---|
| Instrument | wavelength (Å) | orbits | (s) | pix-1 | ||
| B0105008 | HST/COS | G230L/2950 | 1 | 2,454 | 4 | 21.700.15 |
| B0237233 | VLT/UVES | 346+580 | … | 42,927 | 40 | 19.780.07 |
| B0801+303 | HST/COS | G230L/2635 | 2 | 5,619 | 5 | 19.00.3 |
| J1431+3952 | HST/STIS | G230L | 1 | 2,292 | 15 | 21.20.1 |
| J1623+0718 | HST/COS | G230L/2950 | 4 | 11,499 | 5 | 21.350.10 |
| B2355106 | HST/COS | G230L/2635 | 4 | 11,451 | 4 | 21.00.1 |
2.4 Optical echelle spectroscopy with Keck/HIRES and VLT/UVES
High resolution echelle spectra have been obtained for B0105008, B1430178, J1431+3952 and J1623+0718 using the High Resolution Echelle Spectrograph (HIRES; Vogt et al. 1994) on the Keck telescope and UVES on the VLT. Our HIRES observations of B0105008 were supplemented with archival UVES data of this target (proposal 082.A-0569, PI Srianand) in order to extend the wavelength coverage of the spectrum. Archival UVES data were also downloaded and reduced for B2355106 (proposal 085.A-0258, PI Srianand). The same UVES program also obtained data for J1623+0718 which we use to supplement our HIRES data (which extend further into the blue and cover the UVES inter-arm and chip gaps). B0237233 was a target in the ESO Large Program 166.A-0106 (PI Bergeron) and its UVES data cover both the Ly and metal transitions. We do not have echelle spectra for the final target in our sample (B0801+303). Table 5 summarises the available observations, instrument set-ups, wavelength coverage and final S/N ratios.
| QSO | Instrument | Date/ | Time | Instrument | Wavelength | S/N |
|---|---|---|---|---|---|---|
| Archive ID | (s) | set-up | coverage (nm) | pix-1 | ||
| B0105008 | HIRES | Jan. 2008 | 7,200 | 0/1.250 | 307-593 | 10–20 |
| UVES | 082.A-0569 | 14,790 | 390+580 | 350-450, 476-684 | 20–50 | |
| B0237233 | UVES | 166.A-0106 | 42,927 | 346+580 | 305-1008 | 40-150 |
| 48,030 | 437+860 | (combined) | ||||
| J1431+3952 | HIRES | Jan. 2012 | 1,200 | 0/1.156 | 317-603 | 6–15 |
| J1623+0718 | HIRES | Sept. 2010 | 7,200 | 0/1.0005 | 320-588 | 10 |
| UVES | 085.A-0258 | 13,356 | 390+580 | 349-451, 479-680 | 10–40 | |
| B2355106 | UVES | 085.A-0258 | 23,373 | 390+580 | 350-450, 476-684 | 8–25 |
UVES is a dual-arm echelle spectrograph with a grating cross disperser (Dekker et al. 2000). The data presented in this paper were obtained in service mode (or from the archive) using various combinations of standard wavelength settings. The actual wavelength coverage is given in Table 5 as measured directly from the spectra. The CCDs were binned 2x2 and a 1 arcsecond slit was used, resulting in a typical resolution of . The spectra were reduced using a custom version of the Midas reduction pipeline, with manual intervention at several stages. In particular, the tolerance of the wavelength solution was adjusted to optimise the number of identified arc lines and accuracy of the wavelength solution. The typical accuracy of the wavelength solution was 60–70 m/s. The extracted spectra from each exposure were converted to a common vacuum-heliocentric wavelength scale. The heliocentric correction was calculated externally, as the UVES fits headers do not always accurately record this parameter. Where multiple exposures in a given setting were obtained, or where there is spectral overlap between settings, the data were combined, weighting by the inverse of the flux variances. The final extracted 1-dimensional spectrum was normalised by fitting the continuum with Starlink’s DIPSO package.
HIRES data for three targets were obtained in PI mode. B0105008 was observed with HIRES on 12 January, 2008 with the blue cross-disperser and collimator (i.e. HIRESb). We employed the C1 decker for a nominal spectral resolution of FWHM km s-1. Two exposures totalling 7200s were acquired under fair conditions. J1431+3952 was observed on 16 January 2012 in good conditions, also with the C1 decker and HIRESb, with a single exposure of 1200s. The HIRES data were reduced with the HIRedux pipeline that is available within the XIDL software package111http://www.ucolick.org/xavier/IDL. The main difference in the processing of the UVES and HIRES data occurs in the normalization procedure. Whereas normalisation is the final step in the UVES reductions, the HIRedux package fits the continuum order-by-order before conversion to a 1-dimensional spectrum. The HIRES spectra are also corrected to a vacuum heliocentric scale.
Mosaics of many of the metal line transitions detected in the HIRES and UVES data are presented in Figures 12 to 16.
| QSO | N(FeII) | N(SiII) | N(ZnII) | N(CrII) | N(MnII) | N(TiII) | N(NiII) | |
|---|---|---|---|---|---|---|---|---|
| B0105008 | 1.37078 | 15.590.03 | 15.85 | 12.930.04 | 13.920.03 | 13.290.04 | 13.00.2 | 14.250.04 |
| B0237233 | 1.67325 | 14.570.02 | 14.920.02 | 11.840.09 | 12.720.06 | 12.240.06 | 11.46 | 13.510.04 |
| J1431+3952 | 0.60190 | 15.150.11 | … | 13.030.19 | 13.530.18 | 13.070.14 | 12.700.15 | … |
| J1623+0718 | 1.33567 | 15.280.05 | 15.780.05 | 12.910.09 | 13.550.06 | 13.060.06 | 12.54 | 14.110.07 |
| B2355106 | 1.17303 | 15.080.10 | 15.420.13 | 12.760.17 | 13.2 | 12.910.10 | 12.9 | 14.170.12 |
| QSO | [Fe/H] | [Si/H] | [Zn/H] | [Cr/H] | [Mn/H] | [Ti/H] | [Ni/H] | |
|---|---|---|---|---|---|---|---|---|
| B0105008 | 1.37078 | |||||||
| B0237233 | 1.67325 | 0.66 | 0.37 | 0.57 | 0.70 | 1.02 | 1.23 | 0.47 |
| J1431+3952 | 0.60190 | 1.50 | … | 0.80 | 1.31 | 1.61 | 1.41 | … |
| J1623+0718 | 1.33567 | 1.52 | ||||||
| B2355106 | 1.17303 | 1.37 | 1.09 | 0.87 | 1.44 | 1.57 | 1.01 | 1.03 |
| QSO | log N(HI) | Ts (K) | [Zn/H] | |
|---|---|---|---|---|
| B0105008 | 1.37078 | 21.700.15 | 30545 | 1.40 |
| B0237233 | 1.67235 | 19.78 | 390127 | 0.57 |
| J1431+3952 | 0.60190 | 21.20.1 | 9023 | |
| J1623+0718 | 1.33567 | 21.350.10 | 460105 | 1.07 |
| B2355106 | 1.17303 | 21.00.1 | 2145570 | 0.87 |
2.5 Metallicities and spin temperatures
Metal column densities were determined from the echelle spectra using the apparent optical depth method on unsaturated transitions (Table 6). The metal column densities were combined with (H i) following standard procedures to determine an abundance relative to solar, with solar abundances taken from Asplund et al. (2009):
| (1) |
We follow the standard assumption that each element’s absorption is dominated by a single ionization state such that N(Fe) = N(Fe ii) etc. This should be a good apprioximation for DLA gas shielded from the UV background and whose ionisation state is determined by its stellar population. Final abundances are given in Table 7.
For H i 21 cm absorption studies of DLAs towards radio-loud QSOs, the H i 21 cm optical depth, H i column density (H i) and spin temperature Ts are related by the expression
| (2) |
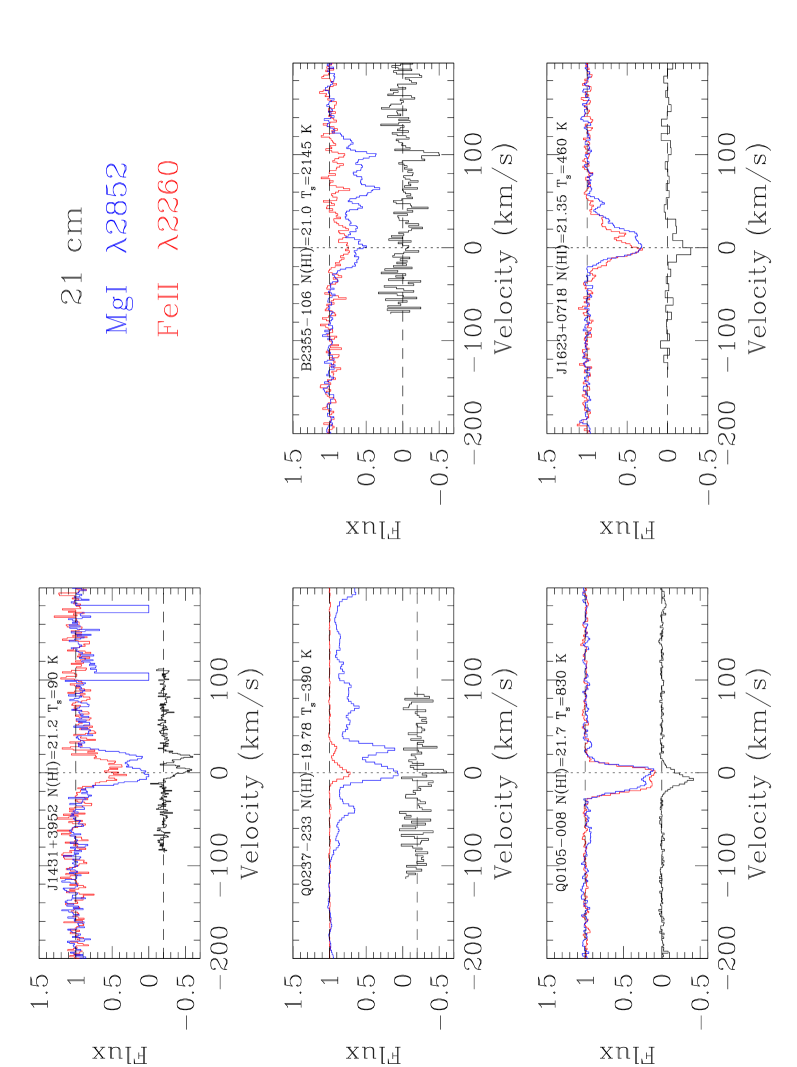
where (H i) is in cm-2, Ts is in K, and d is in km s-1. We adopt the measurements of (H i), and derived in Sections 2.1–2.4 in the final estimates of our spin temperatures. In Table 8, we provide the final spin temperatures (corrected for the source covering factor) for five of the targets of our sample. Note that the table does not list a spin temperature for the sub-DLA towards B0801+303; see Section 2.6.3 below. In Figure 4 we overlay the H i 21 cm and metal line profiles. In all cases, we show the same two metal line transitions: Fe ii 2260 and Mg i 2852. Whilst Mg i is likely to be a better tracer of the cold neutral medium (CNM) gas that is associated with H i 21 cm absorption than the singly ionised species that are the most commonly detected (e.g. Mg ii, Fe ii etc.), it can also have contributions from warm ionised gas (e.g. Kanekar et al. 2010). However, in the absence of, for example, C i detections, Mg i is our best tracer of the CNM amongst the UV resonance lines.
Below, we briefly summarise the noteworthy features of each absorber.
2.6 Notes on individual absorbers
The H i 21 cm absorbers presented in this paper are part of two samples of “strong” Mg ii absorbers, selected from the SDSS and the CORALS survey (Ellison et al. 2001), towards radio-loud quasars that were surveyed for H i 21 cm absorption with the GMRT and the GBT (Kanekar et al. 2009b; Gupta et al. 2009). The selection criteria were (1) Å and Å (where and are the rest equivalent widths in the Mg ii2796 and Fe ii2600 transitions, respectively) and (2) that the absorber should lie towards a radio-loud background quasar with flux density mJy at the redshifted H i 21 cm line frequency.
2.6.1 B0105008
The relative velocity between the DLA and the background QSO is 200 km s-1. Although this velocity offset is likely to be uncertain by several hundreds of km s-1 (van den Berk 2001; Richards et al. 2002; Shen et al. 2007), the absorber is almost certainly a “proximate” DLA (PDLA; e.g. the surveys by Ellison et al. 2002; Russell, Ellison & Benn 2006; Prochaska, Hennawi & Herbert-Fort 2008). There is evidence that high (H i) PDLAs may have elevated abundances, by a factor (Ellison et al. 2010, 2011). Further, the spin temperatures in PDLAs are likely to be affected by the proximity of the gas to a bright radio source (e.g. Field 1958). We discuss the treatment of PDLAs in our sample explicitly in Section 3.2.
The H i 21 cm absorption towards this absorber has a narrow profile that is well fit with a simple 2-gaussian model (Gupta et al. 2007; Kanekar et al. 2009b). As noted in Section 2.2, there is evidence of a core-jet structure in the 606 MHz VLBA image, which leads to a core covering factor of 0.32. The core is unresolved along the declination axis, with angular extent mas (i.e. spatial extent pc).
The H i column density in this absorber has a larger uncertainty than that of the other DLAs in our sample as the absorption overlaps with the Ly emission line; this is a common problem for PDLAs. Nonetheless, the (H i) is clearly extremely high in this absorber, the largest in our sample with log (H i) = .
Both HIRES and UVES data are available for this sightline; the latter were obtained from the UVES archive, from proposal 082.A-0569 (PI Srianand). The UVES data have a higher S/N and wider wavelength coverage and are used in preference to the HIRES data for most transitions. However, the HIRES data have more extensive coverage of the blue spectrum for transitions with rest wavelengths 1290 1475 Å.
The combination of good S/N and high (H i) facilitates the detection of a wide range of metal line transitions, which all show a blended two-component structure. The H i 21 cm absorption is offset from the strongest metal line component, and lies between the two components in velocity space (Figure 4). The column density of Si ii is reported as a lower limit due to the mild saturation of the 1808 transition. Overall, this absorber has a metallicity of , which is relatively metal-poor for this redshift (see Section 3). The low metallicity also puts this absorber at odds with the majority of other high (H i) PDLAs, which tend to have relatively high abundances (Ellison et al. 2010, 2011).
2.6.2 B0237233
The UVES spectrum of B0237233, obtained as part of a UVES Large Program, (166.A-0106, PI Bergeron), is truly exquisite. The combination of very long integration times (approximately 25 hours split between two different wavelength settings) and a bright apparent magnitude () leads to S/N ratios up to 150. The high quality of the UVES spectrum, which extends as blue as 3050 Å, therefore permits a precise measure of (H i) in this low absorber without the need for HST. We note the presence of a saturated Ly line in the red wing of the DLA. Lack of coverage of unsaturated higher order Lyman lines precludes an accurate (H i) measurement of this line. However, this contamination is unlikely to affect the DLA fit, which is driven by the extended damping wings.
Despite the low (H i) of this absorber, which is below the traditional threshold of DLAs, the metal lines are sufficiently strong to enable us to determine a wide suite of abundances. The only species listed in Table 7 that we do not significantly detect is the challenging Ti ii. There is actually a very weak absorption feature at the expected wavelength of Ti ii 1910.6, but its significance is only 2. We therefore conservatively report the formal 3 limit for this transition.
The H i 21 cm absorption is well aligned with the strongest of the two metal line components (Figure 4)222The extended absorption around the Mg i profile is due to contamination from the atmospheric A band.. There is a single pixel feature in the H i 21 cm absorption spectrum which is aligned with the weaker metal feature. Although suggestive, this feature is not statistically significant in the current GBT spectrum and is not included in the integrated H i 21 cm optical depth.
The VLBA map of this quasar reveals a compact radio core, from which we derive a very high covering factor of 0.90. The spatial extent of the core emission is pc2, at the absorber redshift.
2.6.3 B0801+303
Kanekar et al. (2009b) discuss the likely low covering fraction of this absorber (see also Kunert et al. 2002). Our VLBA imaging shows a weak, compact continuum source with a flux density that is only about 2% of the total flux density measured with a lower resolution interferometer. This clearly suggests that the radio emission from this source is extended on scales larger than 0.22 arcsec; a value set by the VLBA short spacing limit at 606 MHz. It is therefore likely that the H i 21 cm absorption arises against the extended radio flux and not against the radio core. The likely non-coincidence of the optical and radio sightlines implies that we cannot determine the spin temperature of this absorber. We therefore do not include this sub-DLA in our spin temperature analysis (it is excluded from Table 8) and have not sought to obtain high resolution optical spectroscopy.
2.6.4 J1431+3952
This paper presents a new detection of H i 21 cm absorption in the sightline towards J1431+3952. The integrated H i 21 cm optical depth is quite high, with the profile consisting of 2 narrow absorption components separated by 15 km s-1 (Figure 1). The two H i 21 cm absorption components are well aligned with the velocity structure seen in Mg i (Figure 4). The relatively low S/N around the Fe ii 2260 line makes its velocity structure harder to discern. However, the two component structure is still present in the singly ionised species, e.g. in Zn ii 2026, again well aligned with the Mg i.
The VLBA image of J1431+3952 shows a core-jet structure, with a clear southern jet. The central radio emission was hence fit with a 2-component gaussian model and a covering factor of 0.32 was obtained for the unresolved core. The core is extremely compact, with a deconvolved angular size of 0 mas along the declination axis, indicating that the angular extent along this axis is mas (i.e. a spatial extent of pc).
After correction for its sub-unity (%) covering factor, this DLA has the lowest measured spin temperature to date, Ts K. The only other DLAs with spin temperatures K (after correcting for the covering factor) are the systems at towards Q1229021 (Brown & Spencer 1979) and towards TXS0311+430 (York et al. 2007) which have Ts=95 and 120 K respectively. In the measurements of Galactic spin temperatures by Kanekar et al. (2011), two Milky Way sightlines have comparably low values (Ts=89 and 119 K), both at very low Galactic latitudes. Given the suggestion that DLAs with low spin temperatures are often (at least at low ) associated with spiral galaxies (Chengalur & Kanekar 2000; Kanekar & Chengalur 2001), the high implied CNM fraction towards J1431+3952 may be associated with the intersection of a galactic disk.
The SDSS image of J1431+3952 shows a faint galaxy at 5 arcsec separation from the QSO. At a redshift this would correspond to a physical projection of 38 kpc, which is fairly large given the implied intersection of a cold disk gas. Moreover, a fit of the SDSS photometry yields a photometric redshift (Michael Palmer, 2012, private communication). A high spatial resolution image of the J1431+3952 field would be of great interest to attempt to identify the absorbing galaxy.
2.6.5 J1623+0718
The redshift of the H i 21 cm absorption () is in excellent agreement ( km s-1) with the centroid of the metal lines (). For the majority of metal line transitions, we use the UVES spectrum, for its superior S/N. However, the Zn ii 2026 line falls between the blue and red arm coverage, so the HIRES data is used for this transition. The overall metallicity of this absorber is .
In order to compare the structure in the metal lines with the H i 21 cm absorpion (originally presented by Gupta et al. 2009), we have re-reduced the archival GMRT data (project 14RSA01, PI Srianand) for this target using standard procedures in AIPS (see, for example, Kanekar et al. 2009b for a full description of the analysis procedure of 610-MHz GMRT data). Our re-reduction of the GMRT data is presented in Figure 4; the strongest H i 21 cm absorption is well-aligned with the strongest metal component.
The VLBA image of J1623+0718 shows a strong core, with a possible weak jet, only tentatively detected in the present map. Only one-third of the total radio emission stems from the core, with a covering factor of ; most of the emission must arise from extended structure that is not detected in the VLBA image. The spatial extent of the core emission is quite small, pc2, at the absorber redshift.
2.6.6 B2355106
The DLA towards B2355106 has Ts=2145 K, making it one of the highest spin temperatures to date in a DLA with a detection of H i 21 cm absorption. The H i 21 cm absorption reported by Kanekar et al. (2009b) in this DLA is located in a single narrow component at . In contrast, the metals show absorption over 150 km s-1 (Figure 16), with the strongest Fe ii absorption at , offset from the H i 21 cm absorption by km s-1. However, Mg i is strongest in the redder components (at km s-1 in Figure 16), which matches well the H i 21 cm absorption (Figure 4). Although not statistically significant, there may be some extended H i 21 cm absorption bluewards of the main detected feature, spanning the broad velocity range over which the metal absorption is observed (Figure 4). However, the extended absorption is not detected in the independent spectrum of Gupta et al. (2009), so we do not include it in the integrated optical depth and spin temperature determination.
There is possible Cr ii 2056 absorption, but the significance of the feature is less than 3 , so a limit is quoted for N(Cr ii) in Table 7. The Ti ii 1910 line is formally detected at 4.9 , but visually this is not very convincing. The significance of detections in this absorber are complicated by the broad velocity structure, so we conservatively quote the Ti ii as a limit. The same broad structure, combined with a relatively low S/N, makes weak features particularly uncertain, which may lead to over-estimation of column densities (e.g. Zn ii).
The VLBA image of this source shows an extremely compact radio core, with a spatial extent of pc2 at the absorber redshift, and a covering factor of unity.
3 Results and discussion
3.1 Filling in the redshift desert
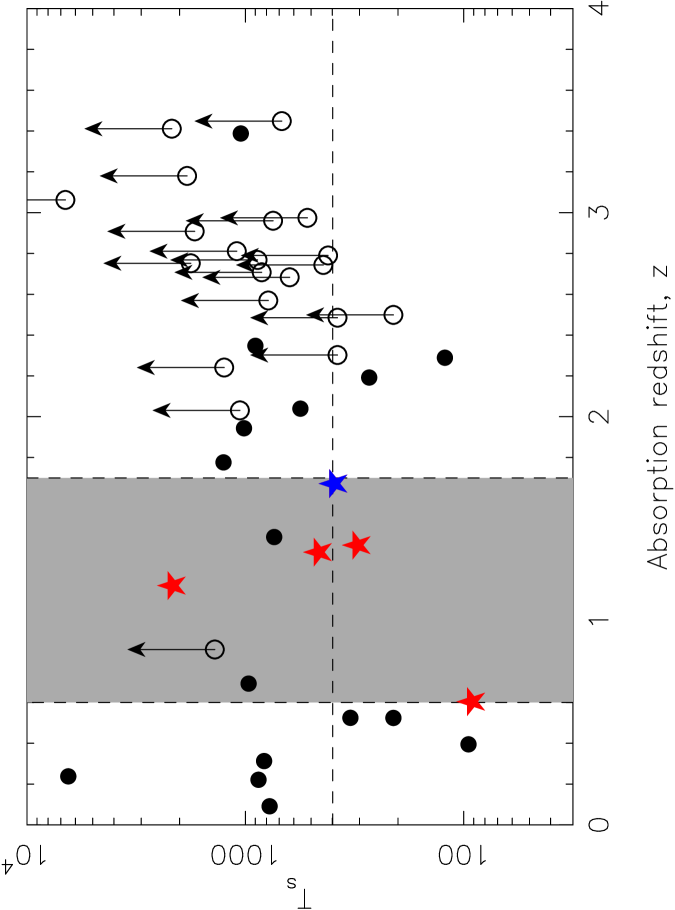
The measurements presented in this paper are combined with a wider literature sample of Ts measurements in order to provide the first attempt at bridging the high and low redshift observations and to improve the overall statistics of spin temperatures and metallicities. The spin temperatures of DLAs and sub-DLAs are shown as a function of redshift in Figure 5. All spin temperatures in this figure include the estimates of the DLA covering factor; indeed, in the following sections, we will deal only with -corrected spin temperatures unless otherwise stated333We use only covering factors that have been determined at frequencies within a factor of of the H i 21 cm absorption. In a companion paper (Kanekar et al. in preparation), we will present the full DLA sample, including both new GBT/GMRT H i 21 cm absorption studies and sources from the literature, as well as the results of an extensive VLBA campaign to determine covering factors for many of the absorbers presented in Figure 5. The redshift desert between is obvious in Figure 5 – prior to the work presented here, only 2 H i 21 cm detections existed in this range. We have added a further 5 Ts measurements (filled stars) which sample the regime over which the spin temperature has been claimed to evolve. It is also interesting to note that our sample encompasses absorbers with a wide range of spin temperatures, including the lowest, and one of the highest values amongst H i 21 cm detections. The full analysis of the spin temperature evolution will be presented by Kanekar et al. (in preparation). For the remainder of this paper, we focus on the metallicity properties of H i 21 cm absorbers.
3.2 Proximate DLAs and sub-DLAs
Four of the DLAs shown in Figure 5 are proximate DLAs within 3000 km s-1 of the QSO (B0105008, Q0405331, Q1013+615 and Q0528250), including one of the absorbers in our intermediate redshift sample (B0105008). There are various reasons why PDLAs might be excluded from a general analysis of abundances in H i 21 cm aborbers. First, radiation from the QSO may alter the hyperfine level populations in the H i atoms (e.g. Field 1958; Wolfe & Burbidge 1975). The result of such irradiation would be that the observed spin temperature would depend both on the radiation field and on the distribution of gas in different temperature phases, significantly complicating the interpretation. Three of the four PDLAs in our sample have Ts K; they are all at where such spin temperatures are typical (Figure 5). The final PDLA is the absorber towards Q0105008 from our redshift desert sample (), with Ts = 305 K (including the correction for a covering factor of 0.32).
Independent of the H i 21 cm absorption, it has been suggested that PDLAs with log (H i) are biased towards higher metallicities (Ellison et al. 2010, 2011). Combined with a possible anti-correlation between Ts and metallicity, the high (H i) PDLAs may have preferentially low values of Ts. Two of the PDLAs in the sample, B0105-008 and Q0528-250, have log (H i) . The abundances of B0105-008 are presented here, and we find a very typical metallicity for this redshift, [Zn/H]=. Q0528-250 was included in the PDLA study of Ellison et al. (2010) and does show a relatively high metallicity for its (H i) (see Figure 15 in Ellison et al. 2010).
In view of these potential biases, we limit the following analyses to absorbers that are at least 3000 km s-1 from the published quasar systemic redshift.
Another class of absorbers that is often distinguished from the general DLA population consists of the so-called sub-DLAs, systems with log (H i) . Although their (H i) falls below the classical DLA criterion, they show clear damping wings and in many cases have reliable abundances (e.g. Dessauges-Zavadsky et al. 2003, although see Richter et al. 2005; Quast et al. 2008; Milutinovic et al. 2010 for counter-examples). Although Peroux et al. (2003) have suggested that sub-DLAs make an important contribution to cosmic H i, particularly at high redshifts, O’Meara et al. (2007) calculated that systems with log (H i) represent only 10% of cosmic neutral hydrogen. Prochaska, Herbert-Fort & Wolfe (2005) have also argued that the sub-DLAs are not tracers of the main gas reservoirs for cosmic star formation. Indeed, there is evidence from Galactic sightlines that below the DLA (H i) threshold there is only a small contribution from the CNM (Kaneker et al. 2011). Finally, it is observed that low-redshift sub-DLAs (which have been mostly identified through their large Mg ii equivalent widths) have systematically higher metallicities than DLAs at the same redshift (e.g. Peroux et al. 2008; Meiring et al. 2009; Dessauges-Zavadsky et al. 2009).
Despite these literature debates, we do include sub-DLAs in the current work, as it is of interest to see whether the Galactic trends with (H i) are also evident in cosmological DLAs and sub-DLAs. In particular, if the CNM fractions (and hence, spin temperatures) depend on metallicity, we might expect trends between these parameters to extend into the sub-DLA regime, regardless of the nature of the intervening galaxy. However, we do distinguish sub-DLAs from DLAs in figures and quoted statistics.
3.3 Metallicities in H i 21 cm absorbers
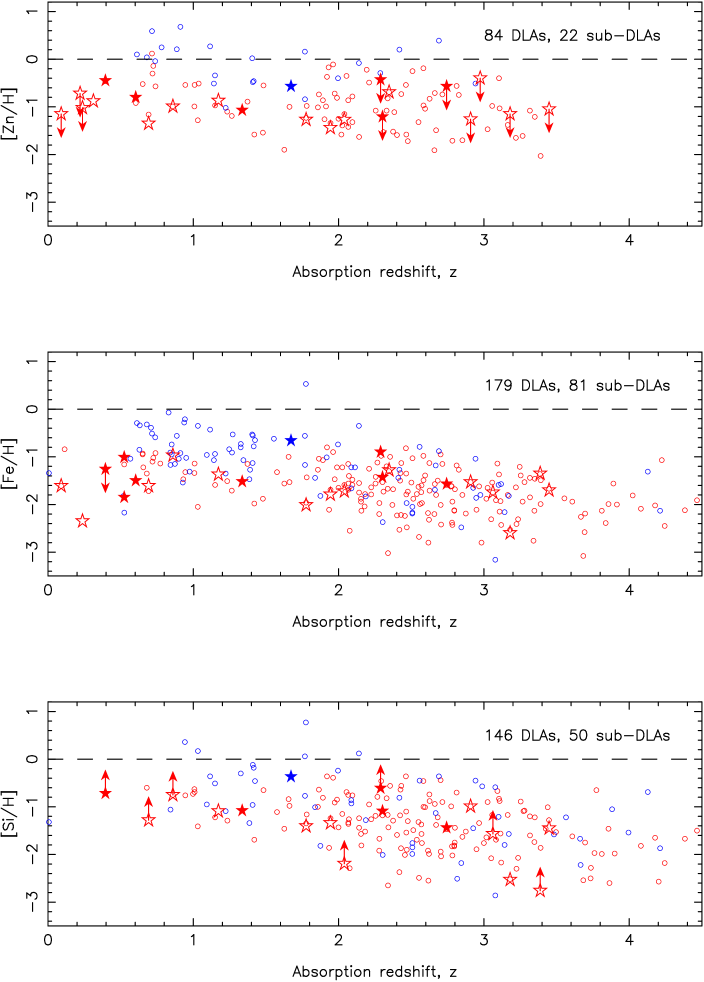
In Figure 6 we show the abundances of three commonly measured elements (Zn, Fe and Si) in DLAs and sub-DLAs with H i 21 cm absorption studies, as a function of redshift. We distinguish low and high (including lower limits) spin temperatures by plotting filled stars for absorbers with Ts 500 K and open stars for absorbers with higher values of Ts. For comparison, we show a literature compilation (Berg et al, in preparation; Rafelski et al. 2012) from DLAs and sub-DLAs (open circles) towards all quasars (i.e. not merely radio quasars). DLAs and sub-DLAs for both samples are shown in red and blue, respectively.
The now well-documented (e.g. Peroux et al. 2008; Meiring et al. 2009) enhancement in sub-DLA abundances is clearly present at low redshifts (). Whilst it has been suggested that their high metallicities indicate that sub-DLAs sample the most massive galaxies, Dessauges-Zavadsky et al. (2009) have argued that this may be a selection effect, since the majority of sub-DLAs in this redshift range were selected via the Mg ii-based survey of Rao et al. (2006).
Whilst Mg ii selection seems to sample DLAs in an unbiased way, Dessauges-Zavadsky et al. (2009) have argued that at lower (H i) there may be a bias towards larger velocity widths and/or metallicities (see also Rao et al. 2006 for a discussion on selection bias, and Bouche 2008 for further evidence of a bias towards high metallicity sub-DLAs selected by Mg ii). In either case, the sample selected using H i 21 cm absorption (many of which, at , were also originally selected based on Mg ii rest equivalent width) show evidence of the same metallicity trends as the absorbers towards the full quasar sample. The H i 21 cm absorber metallicities cover the same ranges as those of the full sample, and the H i 21 cm sub-DLAs show evidence for slightly higher metallicities than DLAs at the same redshift.
Although the elevated metallicities in H i 21 cm sub-DLAs are consistent with optical samples, known trends in H i 21 cm absorbers may make the high metallicities in sub-DLAs with H i 21 cm absorption seem puzzling. Kanekar et al. (2011) have shown that Galactic sightlines with (H i) in the sub-DLA regime tend to have high spin temperatures, and Kanekar et al. (2009c) find that high spin temperatures are more usually found in low metallicity systems. So, we might expect that H i 21 cm absorbers in the sub-DLA regime should have relatively low (rather than the observed high) abundances.
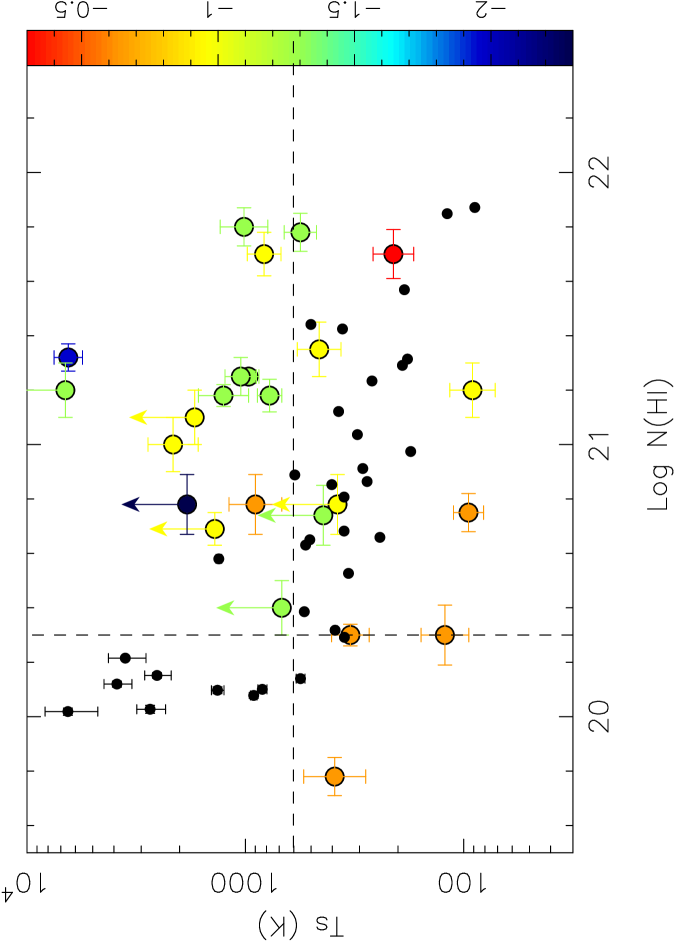
In Figure 7 we put these arguments on a quantitative footing by showing the spin temperature and (H i) Galactic data points used by Kanekar et al. (2011), as well as the values for H i 21 cm detections in DLAs. The latter have been colour-coded by metallicity. Metallicities are taken to be, in order of preference, [Zn/H], [S/H], [Si/H], [Fe/H]+0.4 (where the offset accounts for typical dust depletions; Prochaska & Wolfe 2002). Since the correction to [Fe/H] is rather crude we give priority to, for example, a [Zn/H] limit over a [Fe/H] detection. The exception to these priorities is AO 0235+164 for which we use an X-ray metallicity, as there is evidence that this is a very dusty absorber with depletion considerably larger than the typical value of 0.4 that we otherwise adopt (e.g. Junkarrinen et al 2004; Kulkarni et al. 2007). The lower left part of the diagram with (H i) cm-2 and Ts K is poorly populated by the Galactic and sub-DLA sightlines alike. This supports the suggestion by Kanekar et al. (2011) that below this column density threshold, the neutral medium is dominated by warm gas. At higher column densities, the DLAs show much more scatter in Ts than the Galactic data, but with a clear dependence on metallicity. The DLAs with metallicities below around 1/10 of the solar value (yellow, green and blue points) have high spin temperatures for their (H i), relative to the Milky Way points. The more metal-rich DLAs (orange and red points) have either comparable, or low spin temperatures for their (H i). Such a metallicity dependence may be expected from cooling arguments, whereby metals aid the cooling of the neutral medium (Wolfire et al. 1995; Kanekar & Chengalur 2001), in a similar way that metals have been suggested to aid the transformation from the neutral to molecular regimes (Schaye 2001; Krumholz et al. 2009).
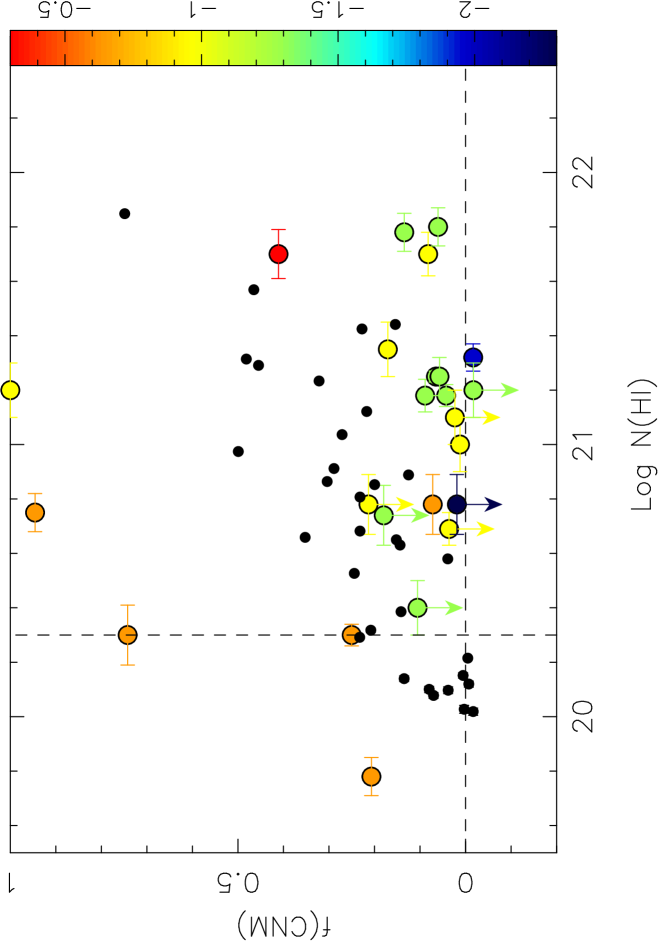
In Figure 8, we make a crude conversion of the spin temperature into a CNM fraction (see also Kanekar & Chengalur 2003). For this calculation, in which we adopt a two phase medium, we must assign spin temperatures to the cold and warm neutral media (WNM). For the CNM, the spin temperature is the same as the kinetic temperature (e.g. Liszt 2001), and we adopt a value of 90K444Although CNM temperatures of 100–200 K are often assumed (e.g. Kanekar & Chegalur 2003), the lowest Ts in our sample is 90K. So as not to exceed CNM fractions of unity, we adopt 90 K as the CNM temperature.. However, in the WNM, the low densities are insufficient to thermalise the H i 21 cm transition (e.g. Liszt 2001). Therefore, although the kinetic temperature of the WNM is expected to be 5000–8000 K, the spin temperature, which will depend on the physical conditions within the cloud, is expected to be considerably lower, 1000-4000 K (Liszt 2001). Although the CNM fractions that are calculated will depend on the temperatures used, the qualitative distribution of points remains the same. We adopt a Ts for the WNM of 3000 K, although we note that this will lead to an (unphysical) negative CNM fraction if the measured Ts 3000 K. Figure 8 shows that, as suggested by Kanekar et al. (2011), the low (H i) Galactic sightlines are dominated by the WNM. As the (H i) increases, a higher CNM fraction is present. The sub-DLA in our sample also has a relatively low CNM fraction, consistent with the upper end of the distribution seen in Galactic (sub-DLA) sightlines. In the DLA regime, the low metallicity absorbers have relatively low CNM fractions, compared with the Milky Way. The DLAs with high CNM fractions tend to be relatively metal-rich.
3.4 The spin temperature-metallicity anti-correlation
In the previous sub-section we showed that sub-DLAs tend to have high Ts (and therefore high fractions of warm gas), regardless of their often elevated metallicities. DLAs may exhibit significant fractions of cold gas, but this is likely to be metallicity dependent.
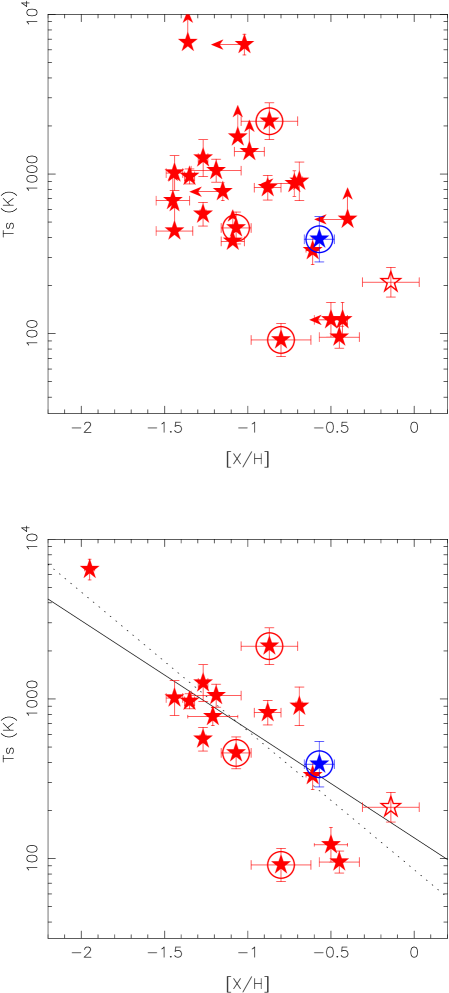
We now turn to the explicit dependence of spin temperature on metallicity. Kanekar & Chengalur (2001) predicted that an anti-correlation between Ts and metallicity would naturally arise if the paucity of cold neutral gas in DLAs was due to fewer cooling routes due to a lack of metals in the absorbers. The largest sample to have been previously used to address this issue was a sample of 26 absorbers, of which 10 systems had both Ts and metallicity measurements and 20 systems had estimates of the low-frequency covering factors (Kanekar et al. 2009c). The number of detections in our sample is significantly increased to 17, even with the additional requirement that all absorbers must have low frequency covering factor measurements to be included in our sample. The new data presented here include DLAs with very high and low spin temperatures, which are particularly useful for anchoring any relationship with metallicity (Figure 9). We note that the lowest metallicity absorber in the lower panel of Figure 9 (which has the highest spin temperature amongst the systems with both H i 21 cm and metal line detections) is Q0952+179. Due to our prioritization of metallicities, this DLA appears in the upper panel as an upper limit from [Zn/H], but its measured value of [Fe/H] is used in the lower panel.
For the full sample of 26 detections and limits, a non-parametric generalised Kendall-tau rank correlation test (the BHK statistic in the ASURV package; Brown et al. 1974; Isobe et al. 1986) detects an anti-correlation between metallicity and spin temperature at significance (Figure 9, upper panel), treating the metallicity as the independent variable. If the DLA towards AO 0235+164 is dropped from the sample (in contrast with the rest of the sample, its metallicity has been obtained from a X-ray measurement), the significance of the anti-correlation is . Reducing the sample to only the 17 systems with measurements of both Ts and metallicity (i.e. excluding limits; see Figure 9, lower panel) yields an anti-correlation with significance. Again, dropping AO 0235+164 from this detection sample gives an anti-correlation with a significance (16 systems).
There is only one sub-DLA included in Figure 9, the absorber towards Q0237233, whose spin temperature we present for the first time in this work. Despite the low (H i), the spin temperature is relatively low in this absorber: Ts K. The moderately high metallicity () places this sub-DLA in good agreement with the DLA data on Figure 9. Dropping the one sub-DLA from the sample yields a Ts-metallicity anti-correlation that is significant at and for limits+detections and detections only, respectively.
We also used a linear regression analysis to obtain the best-fit relation between spin temperature (log[Ts]) and metallicity [Z/H], applying this to the 17 DLAs with measurements of (rather than limits on) both Ts and [Z/H] (see Figure 9, lower panel). We used the BCES(YX) estimator (Akritas & Bershady 1996) for this purpose, again treating [Z/H] as the independent variable X. Note that this method takes into account measurement errors on both variables, as well as correlations between these errors. This is relevant here as both Ts and [Z/H] are derived from the H i column density, and the errors on the two quantities are hence correlated. The regression analysis yielded log[Ts] , consistent with the results of Kanekar et al. (2009c). The fit is shown as a solid line in the lower panel of Figure 9. If, instead of the (YX) technique, we adopt the BCES bisector method for independent variables, the fit is consistent to within 1: log[Ts] .
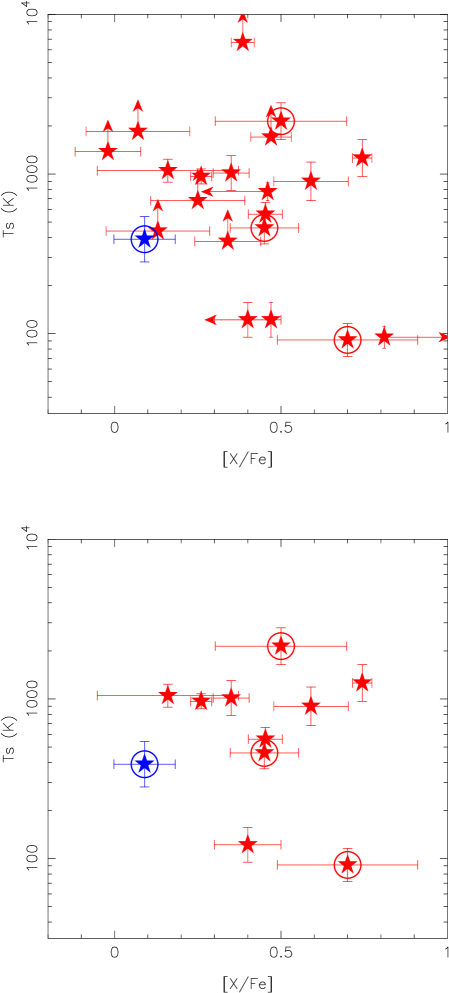
Kanekar et al. (2009c) did not find a significant anti-correlation between dust depletion and Ts. In Figure 10 we confirm this by plotting Ts versus dust depletion [X/Fe] (where X=Zn, S, Si, or the X-ray value for AO 0235+164) for our expanded sample. Applying the generalised Kendall tau test to our sample of 22 systems with either measurements of or limits on Ts and dust depletion (Figure 10, upper panel) we find a anti-correlation between Ts and [X/Fe], considerably weaker than the anti-correlation between Ts and metallicity555Adding a further two absorbers to the depletion sample which do not have Fe abundances, but have detections or limits in Cr ii increases the significance negligibly to 2.0 .. Note that only a handful of DLAs (11 systems) have measurements of both dust depletion and Ts; this sub-sample shows no evidence of an anti-correlation between [X/Fe] and Ts, with a significance of . The lack of a significant dependence of Ts on depletion demonstrates that the Ts-metallicity anti-correlation is not driven by an underlying dependence on dust. We also note that the DLAs with H i 21 cm absorption show a range of depletions that is well-matched to the range in the full DLA sample, where the mean value of [Zn/Fe]+0.4 (e.g. Prochaska & Wolfe 2002).
3.5 H i 21 cm absorption as a tool for selecting DLAs.
The absorbers in the sample selected here were identified first as Mg ii systems, then as H i 21 cm absorbers, with the (H i) determination as the final step. Excluding B0801+303, which was post facto found to be an extended radio source, 4/5 of the Mg ii-selected H i 21 cm absorbers in our sample are found to be DLAs. This compares with a 35% DLA identification rate for absorbers selected purely on Mg ii equivalent width (Rao et al. 2006) and 60% when velocity widths are also taken into account (Ellison 2006; Ellison, Murphy & Dessauges-Zavadsky 2009). The one sub-DLA in our main sample is towards B0237233, whose H i 21 cm optical depth is the lowest in our sample by a factor of 3.
The connection between H i 21 cm absorbers and DLAs is not particularly surprising. Several works (e.g. Kanekar & Chengalur 2003; Curran et al. 2010) have noted a correlation between the integrated H i 21 cm optical depth and (H i). Further, Kanekar et al. (2011) show that most Galactic sightlines with (H i) cm-2 have relatively high spin temperatures, and are hence dominated by the WNM. Only above this approximate threshold can the neutral gas apparently cool sufficiently to form a significant fraction of the cool phase, then becoming readily detectable in H i 21 cm absorption.
H i 21 cm absorbers may therefore represent an interesting alternative identification of DLAs at low redshifts. The obvious concern is how representative such a selection would be. Given the results discussed in this paper, it may be expected that H i 21 cm absorption is most readily detected at large (H i) and high metallicity. Indeed, all four DLAs of the present sample have high (H i), in excess of 1021 cm-2. This is unsurprising, since for a given Ts the H i 21 cm optical depth will be highest for the highest (H i) absorbers. Since DLAs with log (H i) are relatively rare, H i 21 cm selection offers a good opportunity to identify the highest column density absorbers for targeted studies. For example, many of the ‘metal-strong’ DLAs (Herbert-Fort et al. 2006; Kaplan et al. 2010), which are useful for the identification of rare metal species, have such high (H i).
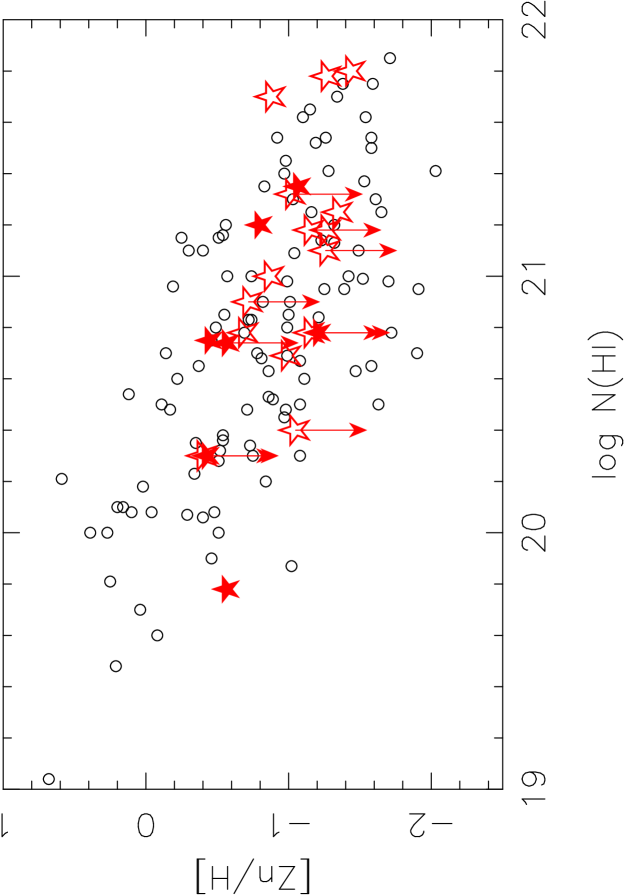
Despite the bias towards high (H i) in an H i 21 cm selected sample of DLAs, the metallicities and dust depletion in H i 21 cm absorbers span the observed range in the full sample of DLAs and sub-DLAs (Figures 6 and 10). In Figure 11, we also show the metallicities (as measured by [Zn/H]) as a function of (H i). It has been argued that the anti-correlation between [Zn/H] and (H i) is inconsistent with a dust bias, given the typical reddening in DLA samples (Elllison, Hall & Lira 2005). The paucity of high (H i) absorbers with high metallicities can instead be understood as a metallicity-dependent transition from the atomic phase to a phase dominated by molecular gas (Schaye 2001; Krumholz et al. 2009). The H i 21 cm absorbers have metallicities consistent with those of the full sample of DLAs at a given (H i). Combined with Figures 6 and 10, this indicates that an H i 21 cm selected sample is not strongly biased for studies of elemental abundances.
4 Conclusions
The study of H i 21 cm absorbers at cosmological distances is now coming of age in terms of sample sizes, redshift coverage and availability of covering factors. This paper focuses on our efforts to fill in the spin temperature redshift desert () and investigate the role of metallicity in modulating spin temperature trends. In a companion paper (Kanekar et al. in prep.) much of the supporting high redshift data used in our analysis is presented, as well as a analysis of the redshift evolution of the spin temperature. The main results of the current paper are as follows.
-
1.
For a sample of six Mg ii-selected H i 21 cm absorbers in the redshift range we have determined (H i) (mostly from HST spectra), metal column densities from optical echelle spectra and covering factors () from VLBA images.
-
2.
One of the absorbers ( towards J1431+3952) is a new H i 21 cm detection made with the GBT. Its spin temperature is the lowest yet reported: Ts=9023 K.
-
3.
The metallicities and dust depletions of H i 21 cm absorbers span the range that is typical for the full DLA sample in the same redshift range (or at fixed (H i)). As is the case for the full DLA, H i 21 cm sub-DLAs have slightly higher metallicities than H i 21 cm DLAs, at a fixed redshift.
-
4.
We confirm the presence of an anti-correlation between spin temperature and metallicity, using an absorber sample with measurements of the covering factor. This is detected at significance for the sample containing both measurements and limits of Ts and metallicity (26 systems) and at significance for a sub-sample (17 systems) with measurements of both Ts and metallicity.
-
5.
Although a wide range of spin temperatures are found at fixed (H i), the CNM fraction clearly depends on metallicity. Absorbers with low metallicity (for their (H i)) tend to have high spin temperatures and low CNM fractions. Only the moderate-to-high metallicity (above 1/10 solar) DLAs tend to show CNM fractions comparable to, or in excess of, Galactic sightlines, at fixed neutral hydrogen column density.
Acknowledgments
SLE is the recipient of an NSERC Discovery Grant which funded this research. NK and JXP have been supported by NSF grants AST-0709235 and AST-1109447. Support for HST program 12214 was provided by NASA through a grant from the Space Telescope Science Institute, which is operated by the Association of Universities for Research in Astronomy, Inc., under NASA contract NAS 5-26555. NK thanks the Department of Science and Technology for support through a Ramanujan Fellowship. We are grateful to Marc Rafelski for obtaining the HIRES spectrum of J1431+3952, to Michael Palmer for providing the photometric redshift of the nearby galaxy in the SDSS image and to Alain Smette for sharing abundance measurements in advance of publication. This work made use of the Swinburne University of Technology software correlator, developed as part of the Australian Major National Research Facilities Programme and operated under licence. The National Radio Astronomy Observatory is a facility of the National Science Foundation operated under cooperative agreement by Associated Universities, Inc. Part of this work was done during a visit by NK to ESO; he thanks ESO for support and hospitality.
References
- [Akerman et al. (2005)] Akerman, C. J., Ellison, S. L., Pettini, M., Steidel, C. C. 2005, A&A, 440, 499
- [Akritas & Bershady (1996)] Akritas, M. G., Bershady, M. A., 1996, ApJ, 470, 706
- [Asplund et al. (2009)] Asplund, M., Grevesse, N., Sauval, A. J., Scott, P., 2009 ARA&A, 47, 481
- [Bouche (2008)] Bouche, N., 2008, MNRAS, 389, L18
- [Briggs, Brinks & Wolfe (1997)] Briggs, F.H., Brinks, E., & Wolfe, A.M. 1997, AJ, 113, 467
- [Brown et al. (1974)] Brown, B. W. M., Hollander, M., Korwar, R. M., 1974, in Reliability and Biometry, ed. F. Proschan & R. J. Serfling (Philadelphia: SIAM), 327
- [Brown & Roberts (1973)] Brown, R. L., & Roberts, M. S., 1973, ApJ, 184, L7
- [Brown & Spencer (1979)] Brown, R. L., & Spencer, R. E., 1979, ApJ, 230, L1
- [Carilli et al (1996)] Carilli, C. L., Lane, W., de Bruyn, A. G., Braun, R., Miley, G. K., 1996, AJ, 112, 1317
- [Chen & Lanzetta (2003)] Chen, H.-W., Lanzetta, K., 2003, ApJ, 597, 706
- [Chengalur & Kanekar 1999] Chengalur, J., & Kanekar, N., 1999, MNRAS, 302, L29
- [Chengalur & Kanekar 2000] Chengalur, J., & Kanekar, N., 2000, MNRAS, 318, 303
- [Chun et al. (2010)] Chun, M. R., Kulkarni, V. P., Gharanfoli, S., Takamiya, M., 2010, AJ, 139, 296
- [Condon et al. (1998)] Condon, J. J., Cotton, W. D., Greisen, E. W., Yin, Q. F., Perley, R. A., Taylor, G. B., Broderick, J. J., 1998, AJ, 115, 1693
- [Cooke et al. (2011)] Cooke, R., Pettini, M., Steidel, C. C., Rudie, G. C., Nissen, P. E., 2011, MNRAS, 417, 1534
- [Curran et al. (2005)] Curran, S. J., Murphy, M. T., Pihlstrom, Y. M., Webb, J. K., Purcell, P. R., 2005, MNRAS, 356, 1509
- [Curran et al. (2010)] Curran, S. J., Tzanavaris, P., Darling, J. K., Whiting, M. T., Webb, J. K., Bignell, C., Athreya, R., Murphy, M. T., 2010, MNRAS, 402, 35
- [Curran et al. (2007)] Curran, S. J., Tzanavaris, P., Pihlstrom, Y. M., Webb, J. K., 2007, MNRAS, 382, 1331
- [Curran & Webb (2006)] Curran, S. J., Webb, J. K., 2006, MNRAS, 371, 356
- [de Bruyn et al. (1996)] de Bruyn, A.G., O’Dea, C.P., & Baum, S.A. 1996, A&A, 305, 450
- [Dekker et al. (2000)] Dekker, H., D’Odorico, S., Kaufer, A., Delabre, B., Kotzlowski, H., 2000, SPIE, 4008, 534
- [Deller et al. (2011)] Deller, A. T., et al. 2011, PASP, 123, 275
- [Dessauges-Zavadsky et al. (2009)] Dessauges-Zavadsky, M., Ellison, S. L., Murphy, M. T., 2009 MNRAS, 396, L61
- [Dessauges-Zavadsky et al. (2003)] Dessauges-Zavadsky, M., Péroux, C., Kim, T.-S., D’Odorico, S., McMahon, R. G., 2003, MNRAS, 345, 447
- [Dessauges-Zavadsky, Prochaska & D’Odorico 2002] Dessauges-Zavadsky, M., Prochaska, J. X., & D’Odorico, S., 2002, A&A, 391, 801
- [Ellison (2006)] Ellison, S. L., 2006, MNRAS, 368, 335
- [Ellison et al. (2004)] Ellison, S. L., Churchill, C. W., Rix, S. A., Pettini, M., 2004, ApJ, 615, 118
- [Ellison, Hall & Lira (2005)] Ellison, S. L., Hall, P. B., Lira, P., 2005, AJ, 130, 1345
- [Ellison et al (2008)] Ellison, S. L., Murphy, M. T., Dessauges-Zavadsky, M., 2009, MNRAS, 392, 998
- [Ellison, Ryan & Prochaska (2001)] Ellison, S. L., Ryan, S. & Prochaska, J. X., 2001, MNRAS, 326, 628
- [Ellison et al. (2010)] Ellison S. L., Prochaska, J. X., Hennawi, J., Lopez, S., Usher, C. G., Wolfe, A. M., Russell, D., Benn, C. R., MNRAS, 2010, 406, 1435
- [Ellison et al. (2011)] Ellison S. L., Prochaska, J. X., Mendel, J. T., MNRAS, 2011, 412, 448
- [Ellison et al. (2001)] Ellison, S. L., Yan, L., Hook, I., Pettini, M., Wall, J., Shaver, P., 2001, A&A, 379, 393
- [Ellison et al. (2002)] Ellison, S. L., Yan, L., Hook, I., Pettini, M., Wall, J., Shaver, P., 2002, A&A, 383, 91
- [Ellison et al. (2008)] Ellison, S. L., York, B. A., Pettini, M., Kanekar, N., 2008, MNRAS, 388, 1349
- [Field et al. (1958)] Field, G. B., 1958, Proc. I. R. E., 46, 240
- [Fumagalli et al. (2010)] Fumagalli, M., O’Meara, J. M., Prochaska, J. X., Kanekar, N., 2010, MNRAS, 408, 362
- [Fynbo et al. (2010)] Fynbo, J. U., et al., 2010, MNRAS, 408, 2128
- [Fynbo et al. (2011)] Fynbo, J. U., et al., 2011, MNRAS, 413, 2481
- [Ge & Bechtold (1997)] Ge, J., Bechtold, J., 1997, ApJ, 477, L73
- [Gupta et al. (2007)] Gupta, N., Srianand, R., Petitjean, P., Khare, P., Saikia, D. J., York, D. G., 2007, ApJ, 654, L111
- [Gupta et al. (2009)] Gupta, N., Srianand, R., Petitjean, P., Noterdaeme, P., Saikia, D. J., 2009, MNRAS, 398, 201
- [Herbert-Fort et al. (2006)] Herbert-Fort, S., Prochaska, J. X., Dessauges-Zavadsky, M., Ellison, S. L., Howk, J. C., Wolfe, A. M., Prochter, G. E., 2006, PASP, 118, 1077
- [Isobe et al. (1986)] Isobe, T., Feigelson, E. D., Nelson, P. I., 1986, ApJ, 306, 490
- [Jorgenson et al. (2006)] Jorgenson, R., Wolfe, A. M., Prochaska, J. X., Lu, L., Howk, J. C., Cooke, J., Gawiser, E., Gelino, D., 2006, ApJ, 646, 730
- [Junkkarinen et al. (2004)] Junkkarinen, V. T., Cohen, R. D., Beaver, E. A., Burbidge, E. M., Lyons, R. W., Madejski, G., 2004, ApJ, 614, 658
- [Kanekar & Briggs (2004)] Kanekar, N., Briggs, F. H., 2004, NewAR, 48, 1259
- [] Kanekar, N., & Chengalur, J.N. 2001, A&A, 369, 42
- [] Kanekar, N., & Chengalur, J.N. 2003, A&A, 399, 857
- [Kanekar et al. (2007)] Kanekar, N., Chengalur, J. N., Lane, W. M., 2007, MNRAS, 375, 1528
- [Kanekar et al. (2009)] Kanekar, N., Lane, W. M., Momjian, E., Briggs, F. H., Chengalur, J. N., 2009a, MNRAS, 394, L61
- [Kanekar et al. (2009)] Kanekar, N., Prochaska, J. X., Ellison, S. L., Chengalur, J. N., 2009b, MNRAS, 396, 385
- [Kanekar et al. (2010)] Kanekar, N., Prochaska, J. X., Ellison, S. L., Chengalur, J. N., 2010, ApJ, 712, L148
- [Kanekar et al. (2009)] Kanekar, N., Smette, A., Briggs, F. H., Chengalur, J. N., 2009c, ApJ, 705, L40
- [Kanekar et al. (2006)] Kanekar, N., Subrahmanyan, R., Ellison, S. L., Lane, W. M., Chengalur, J. N., 2006, MNRAS, 370, L46
- [] Kanekar, N., Ellison, S. L., Momjian E., York, B., Pettini, M., 2012, MNRAS-Letters (submitted)
- [Kaplan et al. (2010)] Kaplan, K. F., J. X., Prochaska, Herbert-Fort, S., Ellison, S. L., Dessauges-Zavadsky, M., 2010, PASP, 122, 619
- [Krumholz et al. (2009)] Krumholz, M. R., Ellison, S. L., Prochaska, J. X., Tumlinson, J., 2009, ApJ, 701, L12
- [Kulkarni et al. (2007)] Kulkarni, V., York, D. G., Vladilo, G., Welty, D. E., 2007, ApJ, 663, L81
- [Kunert et al. (2002)] Kunert, M., Marecki, A., Spencer, R. E., Kus, A. J., Niezgoda, J., 2002, A&A, 391, 47
- [Lane et al. (1998)] Lane, W., Smette, A., Briggs, F., Rao, S., Turnshek, D., Meylan, G., 1998, AJ, 116, 26
- [Le Brun et al. (1997)] Le Brun, V., Bergeron, J., Boisse, P., & Deharveng, J. M. 1997, A&A, 321, 733
- [Ledoux, Bergeron & Petitjean (2002)] Ledoux, C., Bergeron J., & Petitjean, P., 2002, A&A, 305, 802
- [Ledoux et al. (2003)] Ledoux, C., Petitjean, P., Srianand, R., 2003, MNRAS, 346, 209
- [Ledoux et al. (2009)] Ledoux, C., Vreeswijk, P. M., Smette, A., Fox, A. J., Petitjean, P., Ellison, S. L., Fynbo, J. P. U., Savaglio, S., 2009, A&A, 506, 661
- [Liszt (2001)] Liszt, H. S., 2001, A&A, 371, 698
- [Meiring et al. (2009)] Meiring, J. D., Lauroesch, J. T., Kulkarni, V. P., Paroux, C., Khare, P., York, D. G., 2009, MNRAS, 397, 2037
- [Milutinovic et al. (2010)] Milutinovic, N., Ellison, S. L., Prochaska, J. X., Tumlinson, J., 2010, MNRAS, 408, 2071
- [Noterdaeme et al. (2012)] Noterdaeme, P., Laursen, P., Petitjean, P., Vergani, S. D., Maureira, M. J., Ledoux, C., Fynbo, J. P. U., Lopez, S., Srianand, R., 2012, A&A, 540, 63
- [Noterdaeme et al. (2008)] Noterdaeme, P., Ledoux, C., Petitjean, P., Srianand, R., 2008, A&A, 481, 327
- [Noterdaeme et al. (2007)] Noterdaeme, P., Ledoux, C., Petitjean, P., Le Petit, F., Srianand, R., Smette, A., 2007, A&A, 474, 393
- [Noterdaeme et al. (2009)] Noterdaeme, P., Petitjean, P., Ledoux, C., Srianand, R., 2009, A&A, 505, 1087
- [Noterdaeme et al. (2010)] Noterdaeme, P., Petitjean, P., Ledoux, C., Lopez, S., Srianand, R., Vergani, S. D., 2010, A&A, 523, 80
- [O’Meara, Chen & Kaplan (2006)] O’Meara, J. M., Chen, H.-W., & Kaplan, D. L., 2006, ApJ, L642, 9O
- [O’Meara et al. (2007)] O’Meara, J. M., Prochaska, J. X., Burles, S., Prochter, G. Bernstein, R. A., Burgess, K. M., 2007, ApJ, 656, 666
- [Peroux et al. (2011)] Peroux, C., Bouche, N., Kulkarni, V. P., York, D. G., Vladilo, G., 2011, MNRAS, 410, 2237
- [Peroux et al (2003)] Peroux, C., McMahon, R. G., Storrie-Lombardi, L. J., Irwin, M., Hook, I. M., 2003, MNRAS, 346, 1103
- [Peroux (2008)] Peroux, C., Meiring, J. D., Kulkarni, V. P., Khare, P., Lauroesch, J. T., Vladilo, G., York, D. G., 2008, MNRAS, 386, 2209
- [Petitjean et al (2006)] Petitjean, P., Ledoux, C., Noterdaeme, P., Srianand, R., 2006, A&A, 456, L9
- [Pettini et al. 2000] Pettini, M., Ellison, S. L., Steidel, C. C., Shapley, A. E., & Bowen, D. V. 2000, ApJ, 532, 65
- [Pettini et al. 2002] Pettini, M., Ellison, S. L., Bergeron, J., Petitjean, P., 2002, A&A, 391, 21
- [Prochaska et al. (2007)] Prochaska, J. X., Chen, H.-W., Dessauges-Zavadsky, M., Bloom, J. S., 2007b, ApJ, 666, 267
- [Prochaska et al (2002)] Prochaska, J. X., Henry, R., O’Meara, J., Tytler, D., Wolfe, A., Kirkman, D., Lubin, D., Suzuki, N., 2002, PASP, 114, 933
- [Prochaska, Hennawi & Herbert-Fort (2008)] Prochaska, J. X., Hennawi, J. F., & Herbert-Fort, S., 2008, ApJ, 675, 1002
- [Prochaska, Herbert-Fort & Wolfe (2005)] Prochaska, J. X., Herbert-Fort, S., & Wolfe, A. M., 2005, ApJ, 635, 123
- [Prochaska and Wolfe (2002)] Prochaska, J. X., & Wolfe, A. M. 2002, ApJ, 566, 68
- [Prochaska & Wolfe (2009)] Prochaska, J. X., Wolfe, A. M., 2009, ApJ, 696, 1543
- [Prochaska et al. (2007)] Prochaska, J. X., Wolfe, A. M., Howk, J. C., Gawiser, E., Burles, S. M., Cooke, J., 2007a, ApJS, 171, 29
- [Prochter et al. (2006)] Prochter, G. E., Prochaska, J. X., Burles, S. M., 2006, ApJ, 639, 766
- [Quast et al. (2008)] Quast, R., Reimers, D., Baade, R., 2008, A&A, 477, 443
- [Rafelski et al. (2012)] Rafelski, M., Wolfe, A. M., Prochaska, J. X., Neeleman, M., Mendez, A. J., 2012, ApJ, submitted.
- [Rao et al. (2011)] Rao, S. M., Belfort-Mihalyi, M., Turnshek, D. A., Monier, E. M., Nestor, D. B., Quider, A., 2011, MNRAS, 416, 1215
- [Rao et al. 2003] Rao, S. M., Nestor, D. B., Turnshek, D. A., Lane, W. M., Monier, E. M., Bergeron, J., 2003, ApJ, 595, 94
- [Rao, Turnshek & Nestor (2006)] Rao, S.M., Turnshek, D.A., Nestor, D. B., 2006, ApJ, 636, 610
- [Rauch 1998] Rauch, M. 1998, ARA&A, 36, 267
- [Richards et al. (2002)] Richards, G. T., et al., 2002, AJ, 124, 1
- [Richter et al. (2005)] Richter, P., Ledoux, C., Petitjean, P., Bergeron, J., 2005, A&A, 440, 819
- [Russell, Ellison & Benn (2006)] Russell, D., Ellison, S. L., Benn, C. R., 2006, MNRAS, 367, 412
- [Schaye (2001)] Schaye, J., 2001, ApJL, 562, L95
- [Shen et al. (2007)] Shen, Y., et al. 2007, AJ, 133, 2222
- [Srianand et al. (2010)] Srianand, R., Gupta, N., Petitjean, P., Noterdaeme, P., Ledoux, C., 2010, MNRAS, 405, 1888
- [Srianand et al. (2012)] Srianand, R., Gupta, N., Petitjean, P., Noterdaeme, P., Ledoux, C., Salter, C. J., Saikia, D. J., 2012, MNRAS, in press
- [Srianand et al. (2008)] Srianand, R., Gupta, N., Petitjean, P., Noterdaeme, P., Saikia, D. J., 2008, MNRAS, 391, L69
- [Srianand et al. (2005)] Srianand, R., Petitjean, P., Ledoux, C., Ferland, G., Shaw, G., 2005, MNRAS, 362, 549
- [Storrie-Lombardi & Wolfe (2000)] Storrie-Lombardi, L., Wolfe, A. M., 2000, ApJ 543, 552
- [vanden Berk et al. (2001)] Vanden Berk, D. E., et al. 2001, ApJ, 122, 549
- [Vogt 1994] Vogt, S. S. 1994, in ESO Conf. and Workshop Proc 40, High Resolution Spectroscopy with the VLT, ed. M.-H. Ulrich (Garching: ESO), 223
- [Vreeswijk et al (2004)] Vreeswijk, P., et al., 2004, A&A, 419, 927
- [Warren et al (2001)] Warren, S., Møller, P., Fall, S. M., Jakobsen, P., 2001, MNRAS, 326, 759
- [Weatherley et al. (2005)] Weatherley, S. J., Warren, S. J., Møller, P., Fall, S. M., Fynbo, J. U., Croom, S. M., 2005, MNRAS, 358, 985
- [Wolfe, Briggs & Jauncey(1981)] Wolfe, A. M., Briggs, F. H., Jauncey, D. L., 1981, ApJ, 248, 460
- [Wolfe et al (1985)] Wolfe, A. M., Briggs, F. H., Turnshek, D. A., Davis, M. M., Smith, H. E., Cohen, R. D., 1985, ApJ, 294, L67
- [Wolfe & Burbidge (1975)] Wolfe, A. M., & Burbidge, G. R., 1975, ApJ, 200, 548
- [Wolfe & Davis (1979)] Wolfe, A. M., & Davis, M. M., 1979, AJ, 84, 699
- [Wolfe, Gawiser & Prochaska (2003)] Wolfe, A. M., Gawiser, E., & Prochaska, J. X., 2003, ApJ, 593, 235
- [Wolfe, Gawiser & Prochaska (2005)] Wolfe, A. M., Gawiser, E., & Prochaska, J. X., 2005, ARA&A, 43, 861
- [] Wolfe, A.M., Prochaska, J.X., & Gawiser, E., 2003, ApJ, 593, 215
- [Wolfe et al. (1986)] Wolfe, A. M., Turnshek, D. A., Smith, H. E., & Cohen, R. D. 1986, ApJS, 61, 249
- [Wolfire et al. (2003)] Wolfire, M. G., McKee, C. F., Hollenbach, D., Tielens, A. G. G. M., 2003, ApJ, 587, 278
- [Worseck et al. (2011)] Worseck, G., Prochaska, J. X., McQuinn, M., Dall’Aglio, A., Fechner, C., Hennawi, J. F., Reimers, D., Richter, P., Wisotzki, L., 2011, ApJ, 733, L24
- [York et al. (2007)] York, B. A., Kanekar, N., Ellison, S. L., Pettini, M., 2007, MNRAS, 382, 53
Appendix A Metal lines observed in optical echelle spectra
Examples of the echelle data obtained either from the UVES archive or obtained by us from HIRES are presented in Figures 12 to 16.


