Fokker-Planck Models for M15 without a Central Black Hole: The Role of the Mass Function
Abstract
We have developed a set of dynamically evolving Fokker-Planck models for the collapsed-core globular star cluster M15, which directly address the issue of whether a central black hole is required to fit Hubble Space Telescope (HST) observations of the stellar spatial distribution and kinematics. As in our previous work reported by Dull et al., we find that a central black hole is not needed. Using local mass-function data from HST studies, we have also inferred the global initial stellar mass function. As a consequence of extreme mass segregation, the local mass functions differs from the global mass function at every location. In addition to reproducing the observed mass functions, the models also provide good fits to the star-count and velocity-dispersion profiles, and to the millisecond pulsar accelerations. We address concerns about the large neutron star populations adopted in our previous Fokker-Planck models for M15. We find that good model fits can be obtained with as few as 1600 neutron stars; this corresponds to a retention fraction of 5% of the initial population for our best fit initial mass function. The models contain a substantial population of massive white dwarfs, that range in mass up to . The combined contribution by the massive white dwarfs and neutron stars provides the gravitational potential needed to reproduce HST measurements of the central velocity dispersion profile.
Subject headings:
globular clusters: general - globular clusters: individual (M15) - stars: stellar dynamics, mass function1. Introduction
1.1. Motivation
As recently reviewed by Vesperini et al. (2010), the possibility that globular clusters may contain intermediate-mass black holes (IMBHs) has received considerable attention, particularly in the past decade. An extrapolation of the relation between central black hole mass and velocity dispersion () for galaxies implies that globular clusters may harbor black holes with masses in the range of . There have been a number of suggestions that the prototypical collapsed-core globular cluster M15 may contain a central black hole with mass of near . A central black hole has been invoked in M15 to explain both the central surface-brightness cusp (Newell, Da Costa, & Norris, 1976) and the central rise of the velocity dispersion profile observed both from the ground (Peterson, Seitzer, & Cudworth, 1989) and by HST (Gerssen et al., 2002, 2003). However, Grabhorn et al. (1992), Dull et al. (1997), and Baumgardt (2003) have presented dynamically evolving models for M15 that provide good fits to the surface-brightness and velocity-dispersion profiles without the inclusion of a central black hole. Instead, in these models, centrally concentrated populations of massive white dwarfs and neutron stars dominate the gravitational potential in the central region. After some initial uncertainty caused by plotting errors in Dull et al. (1997), and rectified in Dull et al. (2003), Gerssen et al. (2003) found that the Dull et al. (1997) models do, in fact, fit the HST-STIS velocities reported by van der Marel et al. (2002), without the addition of a black hole. Using proper motions of stars McNamara (2003) also concluded there is little direct evidence for an IMBH in M15. Using equilibrium models Chakrabarty (2006) reached a similar conclusion. Ho et al. (2003) and Bash et al. (2008) failed to detect X-ray or radio emission coincident with the cluster center. This is not necessarily inconsistent with an IMBH, since the accretion rate and/or the accretion efficiency are likely to be low. Nonetheless, M15 does not appear to be a strong candidate to harbor an IMBH.
The population of neutron stars included in the Dull et al. (1997) models follows from the adoption of a reasonable initial mass function (IMF), an inferred total cluster mass of , and the assumption that all of the neutron stars are retained after formation. As we extensively discussed in Dull et al. (1997), this last assumption is the least certain, given the likelihood that a substantial fraction of the neutron stars formed in clusters will be immediately ejected by their large birth kicks. Pfahl et al. (2002) have examined this issue, noting that while consideration of birth kicks suggests that the retention fraction should be in the range , X-ray evidence suggests that it may approach 20% in some clusters, producing populations of up to 1000 neutron stars in rich clusters. Drukier (1996) found similar estimates for retention fractions of neutron stars born in binaries. Gerssen et al. (2003) argued that the neutron star population adopted in the Dull et al. (1997) models is implausibly large and thus that it is reasonable to effectively replace part of the inferred neutron star population with a central IMBH of mass . It is important to note, however, that our Fokker-Planck models only require that there be a population of nonluminous remnants with masses in excess of about 1.2 ; it is not necessary that all of these objects be neutron stars.
The IMF plays a critical role in the dynamical evolution of a cluster. This is particularly the case for a core-collapsed cluster, in which extreme mass segregation causes the massive white dwarfs and neutron stars to dominate the central region. The distribution of these massive remnants gives us a constraint on the upper end of the IMF. Dynamical models for clusters provide a key means of probing the distributions of these extremely faint stars, which presently elude optical detection.
There is a significant increase in the quantity and quality of the data available for detailed modeling of M15 since the Dull et al. (1997) models were developed. Thus, we have developed new Fokker-Planck models for M15, to fit these data, that address the issue of the necessity of a central black hole.
1.2. Background
HST imaging studies have provided a wealth of information on globular cluster structure, stellar content, and kinematics. This is particularly true for the central regions of high density clusters, which were largely inaccessible from the ground before the HST-era, owing to severe crowding of stellar images. This has allowed an examination of cluster mass functions to unprecedented depth Sosin (1997b); Paresce & De Marchi (2000); Pasquali et al. (2004). In all three of these studies, multi-mass King models were fit to the mass-function and kinematic data to constrain cluster structure parameters. In less crowded outer regions of clusters, HST imaging has been used to detect stellar masses near the hydrogen burning limit of the main sequence in NGC 6397 (Piotto, Cool, & King, 1997; King et al., 1998; Richer et al., 2008) and in M4 (Richer et al., 2002). In the central regions of clusters, these improved observations allow us to investigate the details of the core collapse process. A predicted observational signature of core collapse is the presence of a central power-law surface density cusp surrounding a small, possibly unresolved core (Cohn, 1980; Murphy & Cohn, 1988). Ground-based observations of surface-brightness profiles have detected central cusps that are interpreted as being due to core collapse in at least 21 globular clusters (see e.g. Trager, Djorgovski, & King, 1993; Lugger, Cohn, & Grindlay, 1995). HST imaging studies of star count profiles have confirmed the presence of these cusps in a number of clusters, including M15 (Yanny et al., 1994a; Guhathakurta et al., 1996; Sosin & King, 1997), M30 (Yanny et al., 1994b; Sosin, 1997a), and NGC 6397 (Sosin, 1997b). Noyola & Gebhardt (2006) have analyzed HST profiles for 38 clusters, finding that about half of the sample has a central power-law cusp, with a range of slopes.
An important predicted outcome of the dynamical evolution leading to core collapse is that substantial mass segregation will occur within the half-mass radius of a cluster (Murphy & Cohn, 1988; Grabhorn et al., 1992; Dull et al., 1997; Pasquali et al., 2004). More massive stars will lose energy to lower mass stars and sink closer to the cluster center, as the stellar energy distribution tends towards equipartition.
Indications that the stellar populations in the central cusp regions have been modified by close stellar encounters provide other evidence of the occurrence of core collapse in clusters. These include color gradients in the sense of inward bluing (Djorgovski & Piotto, 1993), a central deficit of bright red giants (Stetson, 1994), and centrally concentrated populations of both blue stragglers (Bailyn, 1993) and millisecond pulsars (Anderson, 1992; Phinney, 1993).
M15 (NGC 7078) has long been regarded as the prototypical core-collapsed cluster. In addition to its central surface-density cusp, it has other evidence of a high rate of stellar interactions in its central region including eight millisecond pulsars (Anderson, 1992), a blue straggler population (de Marchi & Parsece, 1994), three low-mass X-ray binaries, AC 211, M15 X-2, and X-3 (Hertz & Grindlay, 1983; White & Angelini, 2001; Heinke et al., 2009), and at least one cataclysmic variable located in the cluster core Shara et al. (2004). Dieball et al. (2008) and Haurberg et al. (2010) have found evidence for centrally concentrated populations of close binary candidates in M15, including cataclysmic variables and helium white dwarfs.
Grabhorn et al. (1992) and Dull et al. (1997) have fitted Fokker-Planck models to the surface-brightness and velocity-dispersion profiles of M15 and found that it was best fit with a global mass function having a power-law index of , where 1.35 is the Salpeter index. These models also containned a sizable population of nonluminous objects with masses in excess of 1 . In Dull et al. (1997), the most massive of these objects were taken to be neutron stars with masses of 1.4.
Sosin & King (1997) and Piotto et al. (1997) found evidence for strong mass segregation in M15, using the HST Faint Object Camera (FOC) and Wide Field Planetary Camera 2 (WFPC2) imaging, respectively. At radii of 5″, 20″, and 4.5′ they found that the mass function had a power-law slope of , 0.2, 2.1, respectively, for stellar masses from 0.78 to 0.60 (where the Salpeter slope is 1.35). Significant mass segregation has also been found in a number of other clusters, including M71 (Richer & Fahlman, 1989), 47 Tuc (Anderson & King, 1966; Howell et al., 2001), NGC 6397 (Sosin, 1997b), and M30 (Sosin, 1997a, b). Sosin & King (1997) fitted a King-Michie model to the observed data set for M15 and found they could explain the observed mass segregation, but that they could not accurately reproduce the mass function in the central cusp nor the gravitational potential of the cluster. Pasquali et al. (2004) have supplemented the Sosin & King (1997) mass-function dataset with HST NICMOS observations at 7′, and fitted this combined dataset together with several kinematic datasets with a King-Michie model. The resulting fit is more succesful than that of Sosin & King (1997), most likely due to the inclusion of a much larger population of massive remnants. King-Michie models, which are non-evolving, may not accurately represent the current dynamical state of a post-collapse cluster such as M15. These models are likely to substantially underestimate the degree of mass segregation that occurs in the core and may thus provide a poor constraint on the remnant population.
M15 provides us with an excellent opportunity to examine the IMF of globular clusters. In all likelihood it has undergone little tidal stripping due to its position and orbit in the Galaxy (Dauphole et al., 1997; Vesperini & Heggie, 1997; Dinescu et al., 1999). The fact that M15 is a post-core collapse cluster also allows us to probe the upper main sequence of the IMF. Because the slope of the surface-brightness cusp is dependent upon the mass of the most massive stellar remnants we can estimate the number of nonluminous remnants present in M15 (Murphy & Cohn, 1988). M15’s low metallicity (Z=0.0001) implies that neutron stars were formed from progenitor stars of 6.4 and above (Hurley et al., 2000). From this we can estimate the slope of the IMF above this mass. The availability of detailed velocity profiles and millisecond pulsar accelerations for M15 also aids in the estimate of the amount of mass in massive nonluminous remnants (Phinney, 1993; Anderson, 1992; Dull et al., 1997).
1.3. Overview
In this paper we present dynamically evolving Fokker-Planck models of M15 that are more detailed than those of previous investigations. We fit these models to HST observations of stellar mass functions at several radii by Sosin & King (1997) and Piotto et al. (1997). In addition we fit our models to the velocity dispersion data of Gebhardt et al. (1994, 1997, 2000), Drukier et al. (1998), Gerssen et al. (2002), and McNamara (2003). In §2 we describe our models. The results and a newly determined best-fitting Fokker-Planck model for M15 are presented in §3. Section 4 summarizes our findings and discusses their implications.
2. Dynamical Models for M15
2.1. Approach
As in our previous modeling of M15 (Grabhorn et al., 1992; Dull et al., 1997), our basic approach is to adopt a global stellar mass function, generate evolving Fokker-Planck models for this mass function, compare these models with the observed surface-density and velocity dispersion profiles at a number of epochs, and adjust the adopted mass function to achieve agreement with the observations. Our previous modeling of M15 adopted a power-law form for most of the range of the stellar mass function (Grabhorn et al., 1992; Dull et al., 1997). The direct observation of local stellar mass functions by HST studies provides an important new constraint in the fitting process, that allows the use of a more complex form for the mass function. Since HST observations are now able to probe the stellar mass function to near the hydrogen burning limit of the main sequence (de Marchi & Parsece, 1994; Cool, Piotto, & King, 1996; King et al., 1998; Richer et al., 2008), modeling these observations requires good resolution of the mass function using 20 or more mass groups; in our previous modeling we had used seven groups (Grabhorn et al., 1992; Dull et al., 1997). Our goal in the present study is to constrain the form of the global mass function by fitting observed local mass functions at several radii.
Our globular cluster models are generated using the multi-mass direct Fokker-Planck method, which is based on a smooth, continuous description of the spatial structure of a cluster (Murphy & Cohn, 1988). In this approach, each stellar mass group is represented by a statistical distribution function in orbital energy. The dynamical evolution of these distribution functions due to the effects of star-star gravitional scattering are followed in a diffusive approximation, in which the cumulative effects of more frequent distant encounters dominate those of less frequent close encounters. The gravitational potential due to the stellar distribution is determined self-consistently, yielding the time evolution of the structure of the model globular cluster. Using this method we were able to follow the evolution of a set of initial models through the first core collapse and the subsequent post-collapse evolutionary phase using heating via dynamically formed binaries (Murphy et al., 1990). As reviewed by Goodman (1993) and Murphy (1993), energy input into the cluster core from interactions involving close binaries is expected to halt core collapse and drive a post-collapse oscillatory phase. Binaries may be present in the cluster from primordial formation and/or may be formed by two-body tidal capture and three-body dynamical processes. M15 likely has few binaries in its core due to its being in deep collapse. Deep collapse of a cluster is an indication that it has “burned” most of the primordial binaries near its center (Gao et al., 1991).
We begin our models with a mass-density distribution represented by a Plummer model ( polytrope). All models start with the mass groups having identical velocity distributions, as expected after violent relaxation (Binney & Tremaine, 1987, §4.7.2). This velocity equipartition is quickly replaced by energy equipartition, causing the most massive stars to sink to the cluster center as the cluster evolves dynamically (Inagaki & Saslaw, 1985; Murphy & Cohn, 1988). Large-scale central density oscillations appear soon after the initial collapse. These oscillations have been observed in conducting gas-sphere models, Fokker-Planck models, and -body simulations (Sugimoto & Bettwieser, 1983; Cohn, Hut, & Wise, 1989; Makino, 1996). As discussed in our previous work, the core radius lies close to its maximally expanded size over most of an oscillation cycle. For a cluster at a distance of , such as M15, this corresponds to an angular scale of , which is similar to observational upper limits on the core radius of M15 from HST imaging (e.g. Sosin & King, 1997). We typically evolve our models through core collapse and into the post-collapse phase, to provide a wide choice of evolutionary phases with which to fit the observations.
Recently Fregeau (2008) has suggested that clusters like M15 may still be in a binary burning state rather one of deep collapse; we note that this results in a similar core radius to that achieved in a post-collapse core bounce.
2.2. The Stellar Mass Function
Our models of M15 approximate the present-day stellar mass function with a set of 20 discrete evolved mass groups. This mass resolution has allowed us to investigate the effects of mass segregation on the local mass function. Rather than explicitly include continuous stellar evolution mass loss, which is most important in the early evolutionary phases, we use a static present-day mass function for all epochs of our models, derived from the IMF by transforming post-main-sequence stars to appropriate remnant masses. This present-day evolved mass function takes into account stellar evolution that has modified the upper IMF over the lifetime of the cluster. For this study we were mainly interested in the final remnant mass of stars so that we could determine the number and mass of the objects in each of our remnant mass bins. To determine the initial main sequence to final remnant masses for these bins we used the stellar evolution models described by Hurley et al. (2000). From their fitting formula we were able to determine the mass of the remnants produced by upper main sequence stars of the IMF. Five of the twenty mass groups represent degenerate stars, two represent post-main sequence stars (horizontal branch and red giant), and 13 mass groups represent the main sequence stars over the mass range 0.8 to 0.1. Using a metallicity of Z=0.0001 in the Hurley et al. (2000) models results in significantly more massive white dwarfs than would solar metallicity. Also neutron stars are produced from progenitor stars as low as 6.43 from this low metallicity.
| Bin | Stellar | Mass | Type | Progenitor |
|---|---|---|---|---|
| Mass () | Fraction | Mass () | ||
| 1 | 1.440 | 0.0051 | neutron star | 6.43 to 22.0 |
| 2 | 1.210 | 0.0684 | white dwarf | 4.00 to 6.43 |
| 3 | 0.950 | 0.1339 | white dwarf | 2.00 to 4.00 |
| 4 | 0.700 | 0.1840 | white dwarf | 1.00 to 2.00 |
| 5 | 0.570 | 0.0638 | white dwarf | 0.82 to 1.00 |
| 6 | 0.816 | 0.0036 | red giant | |
| 7 | 0.796 | 0.0209 | main sequence | |
| 8 | 0.730 | 0.0674 | main sequence | |
| 9 | 0.619 | 0.0963 | main sequence | |
| 10 | 0.516 | 0.0620 | main sequence | |
| 11 | 0.442 | 0.0420 | main sequence | |
| 12 | 0.378 | 0.0326 | main sequence | |
| 13 | 0.323 | 0.0320 | main sequence | |
| 14 | 0.276 | 0.0315 | main sequence | |
| 15 | 0.236 | 0.0310 | main sequence | |
| 16 | 0.202 | 0.0306 | main sequence | |
| 17 | 0.173 | 0.0301 | main sequence | |
| 18 | 0.148 | 0.0281 | main sequence | |
| 19 | 0.126 | 0.0211 | main sequence | |
| 20 | 0.108 | 0.0154 | main sequence |
The IMF of the cluster is given by a series of power-laws of the form,
| (1) |
Here is the number of stars contained in the mass interval ; , , , and are the logarithmic slopes of the mass function over the indicated mass intervals 111The parameter is defined as .; and , , , and are the stellar masses where the initial mass function is allowed to change power-law slope. For progenitor masses above the turnoff mass, we assumed a single power-law slope that was varied from to , where the Salpeter mass function is . To estimate the number of stars in the five degenerate mass groups, we integrated the IMF over the appropriate progenitor mass ranges as indicated in Table 1. As the most massive group of degenerate stars, neutron stars of mass 1.44 will determine the slope of the surface-density profile and the local mass function in the inner parsec of the cluster if they dominate the mass density in the cusp. We assume that neutron stars originate from stars with initial masses from 6.43 to 22 solar masses as prescribed by Hurley et al. (2000). The properties of each stellar group are listed in Table 1.
Changing the upper mass limit for neutron star progenitors has only a small effect on the total number of neutron stars produced. Because neutron stars receive a sizeable velocity kick at birth (Lyne & Lorimer, 1994; Hansen & Phinney, 1997), it is likely that a significant fraction has been ejected from the cluster. We therefore allowed the number of neutron stars to be lower than would otherwise be presumed from the IMF. For a globular cluster similar to M15, the central escape velocity is typically on the order of 50 km s-1. For the pulsar velocity distribution of Lyne & Lorimer (1994), fewer than 10% of the original neutron stars may be present (Pfahl et al., 2002). This quantity might be higher if one assumes that some of the neutron stars originated in binary stars (Drukier, 1996; Davies & Hansen, 1997; Pfahl et al., 2002). An important goal of the present study has been to determine the minimum retention fraction for which we are able to fit the M15 observations. For other degenerate groups we assumed that all stars are retained in the cluster. The stellar mass of each white dwarf bin is given in Table 1, along with the assumed progenitor masses. The mass of the white dwarf bins were selected using a prescription of Girardi et al. (2000); Hurley et al. (2000). Using this method, we determined the number of remnant stars present by integrating the IMF over the various range of masses above the current turnoff mass.
Stellar mass black holes are not included in these models for several reasons. As with neutron stars black holes may receive a birth kick (Dhawan et al., 2007). If this does occur then very few black holes would be retained by the cluster. Even if there were no birth kick most of the black holes produce by a typical mass function would likely be ejected. Given the mass difference compared to the rest of the cluster stars these stellar mass black holes would undergo rapid dynamical evolution, quickly segregate to the cluster core, and decouple from the rest of the cluster (Spitzer, 1969; Watters et al., 2000). This central cluster of black holes would then form binaries that would then cause them to be ejected from the system a relatively short time (Kulkarni et al., 1993; Sigurdsson & Hernquist, 1993).
2.3. Model Fitting
Our models can be described by three different parameters, the present-day total mass of the cluster, the initial half-mass radius of the cluster, and the stellar mass function parameter set. We first considered an IMF similar to that inferred by Dull et al. (1997). The Fokker-Planck model was first run with this mass function, then the results were examined to determine if a fit could be made, at some epoch, to all three local mass functions found by Sosin & King (1997) and Piotto et al. (1997) at 5″, 20″, and 4.5′. From this first model we were able to gauge what adjustments were necessary to the IMF, the half-mass radius, and the cluster mass. We revised the model until it satisfactorily matched the mass-function observations at the three radii at some epoch. The models were fit to four types of data: the mass-function data at the three radii, star-count profiles for three luminosity ranges, the velocity-dispersion profile, and millisecond pulsar acceleration measurements. A model was deemed acceptable if it satisfactorily matched all four of these data sets.
Sosin & King (1997) present radial star-count profiles for several magnitude ranges. For a comparison with their results we converted our stellar mass functions to luminosity functions using the mass to luminosity relation (MLR) of Bergbusch & Vandenberg (1992). We assumed a distance modulus of 15.4, identical to Sosin & King (1997) and Durrell & Harris (1993). These MLRs allow us to make a direct comparison to the star count data of Sosin & King (1997) at radii of 5″ and 20 ″. The MLR is uncertain for low metallicities and low masses (Alexander et al., 1997), so we concentrated on fitting the mass function for stellar masses above 0.4.
3. Models

The best-fitting model has a mass of and a half-mass radius of 3.4 parsecs. This mass is similar to that found by McNamara et al. (2004). The model was found to fit best in the post-core collapse phase. While a fit of the model at the initial collapse gave reasonable results, we found that the post-collapse phase provided a better fit to both the local mass functions and the star-count data. We tried to fit a number of models at several points during a post-collapse phase, including both expansion and recollapse phases. We found that the maximally expanded model could not account for the measured pulsar accelerations. In addition to the finding the best epoch to fit the model we found the slope of the upper IMF is constrained by the number of neutrons and massive white dwarfs needed to flatten the surface-brightness profile of the cluster and produce a large enough pulsar acceleration. The IMF slope could be steepened but then an unrealistic percentage of neutron stars would have to be retained. The break points in the mass function below the turn-off mass are primarly constrained by the slope of the observed mass function at 4.5′. Break points significantly different than those listed in Table 2 led to a poor fit of the observed mass function at all radii. Our best-fitting model, which corresponds to an expanding phase, is shown in Figures 1—7. The mass-function slopes used over the four mass intervals, described in section 2.2, are given in Table 2. Above 0.55 we assume a slope of with a neutron star retention of 5%. The 1.4 objects in the best-fitting model make up 0.5% of the cluster mass. In the range of 0.55 to 0.4 the mass function flattens significantly, to . This trend reverses for the lower main-sequence, below 0.4, where increases once again to 0.9. Finally, below 0.15, the mass function flattens once again to .
| Power-law Slope | Mass Interval |
|---|---|
| () | |
| 0.9 | |
| -1.5 | |
| 0.9 | |
| -1.0 |
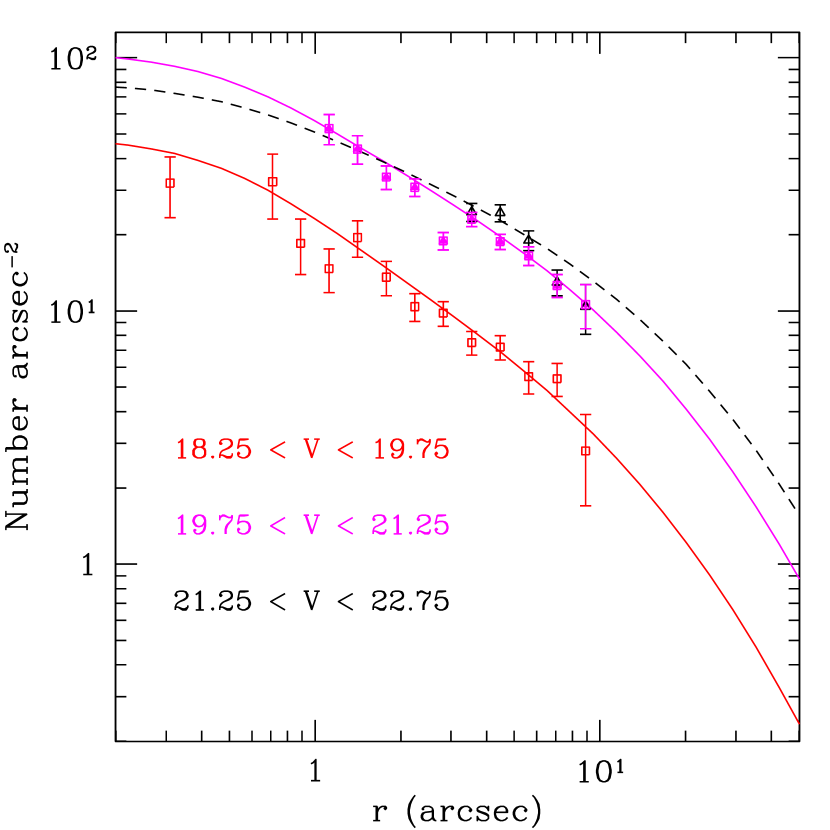
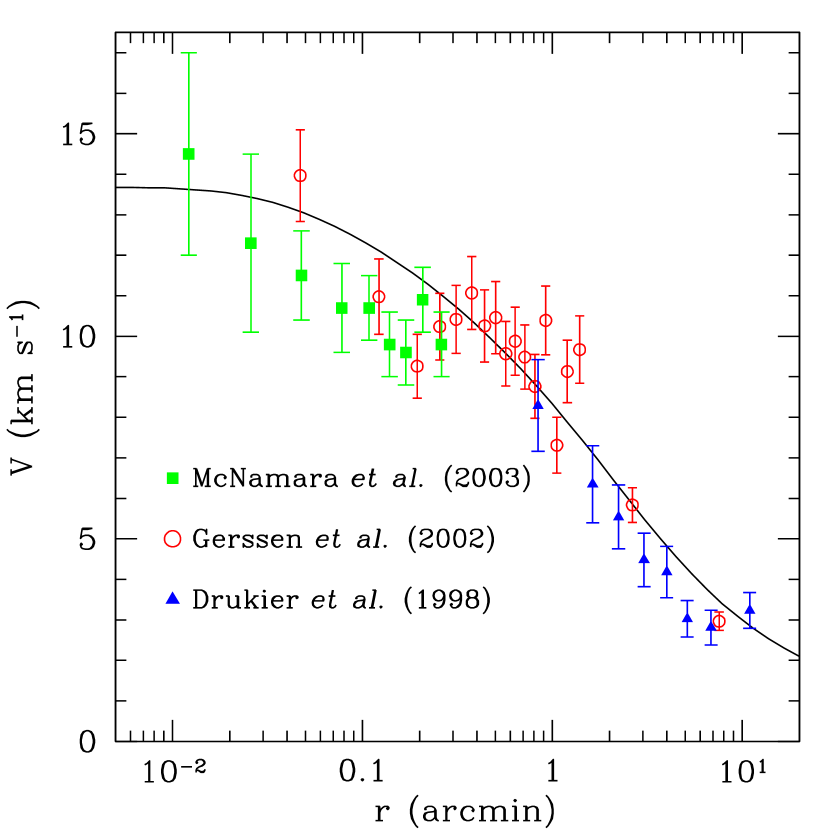
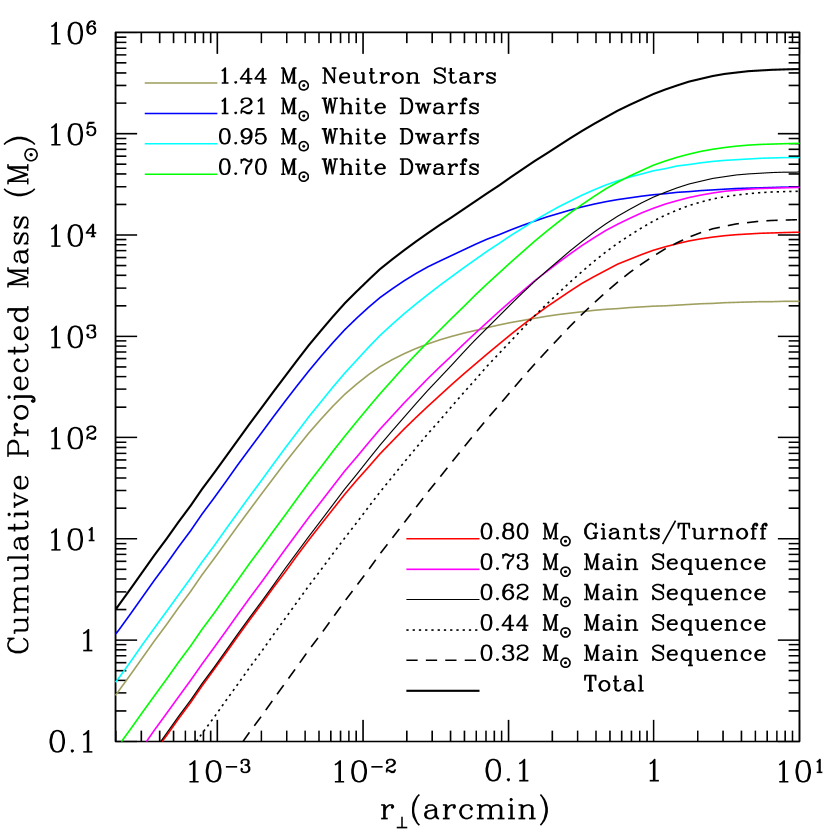
Figure 1 shows the local mass function at radii of 5″, 20″, and 4.5′. Note that the Sosin & King (1997) data only show stellar masses down to 0.6 and 0.5 for radii of 5″, 20″, respectively, due to observational limitations in the cluster cusp described earlier. Our model accurately reproduces the mass function at all three radii. Figure 2 shows star-count profile of the model compared to the FOC observations of Sosin & King (1997) for three magnitude intervals. The three magnitudes intervals correspond to subgiants and stars near the turnoff () and two main-sequence groups ( and ). The model once again accurately reproduces both the slope and normalization of the profile. Figure 3 shows the velocity-dispersion measurements of Drukier et al. (1998), Gerssen et al. (2002), and McNamara (2003) compared to the model. The model passes through most of the error bars of the velocity points. We do not try to fit the outer flattening of the Drukier et al. (1998) dataset, because this is likely to be an effect of being near the tidal radius. The King-Michie model of Sosin & King (1997) matches the surface density well but provides only a fair fit to the mass function, and fails to reproduce the velocity dispersion profile. The King-Michie model of (Pasquali et al., 2004) matches the surface brightness profile and the luminosity functions, while also providing a reasonable fit to the velocity dispersion profile. As discussed below, this appears to be a consequence of retaining all of the neutron stars produced from the IMF. Our model has a much more realistic retention fraction of 5%. This reduced requirement for heavy remnants, to provide the central potential, is a consequence of the higher degree of central concentration that develops in our evolving Fokker-Planck models relative to a King-Michie model. Figure 5 shows the cumulative projected mass as a function of radius for the total mass and several of the mass groups. Using observed kinematic data for M15 Chakrabarty (2006) estimated a mass interior to 0.010 pc of roughly 1000. We find somewhat less mass interior to this radius in our model. However Chakrabarty (2006) had an inferred total cluster mass nearly 3 times that of our best-fitting model and of McNamara et al. (2004). This discrepancy could be a result of mass segregation and our use of evolving models and the presence of heavy remnants.

| Parameter | Value |
|---|---|
| Total Mass | |
| pc | |
| pc | |
| No. of Neutron Stars | |
| Projected Half-Mass Radius of Neutron Stars | pc |
| No. of Massive White Dwarfs () | |
| % Cluster Mass in Remnants | % |
Eight millisecond pulsars have been detected in M15 (Anderson, 1992). Two of these, PSR 2127+11A and PSR 2127+11D, are located 1″ from the cluster center and have measured accelerations. These accelerations allow us to determine a lower limit on the gravitational potential (Phinney, 1993; Grabhorn et al., 1992). Nonluminous remnants dominate at this radius, as seen in Figure 4. These remnants (all white dwarfs plus neutron stars) make up 45% of the total cluster mass globally, and dominate the inner regions due to their greater mean mass than that of the luminous stars. We use the measured pulsar accelarations to determine the minimum mass of nonluminous remnants required in our model. Any dynamical model must fit these accelerations in order to properly map the potential in the cusp. Figure 6 shows the projected gravitational acceleration versus radius for the best-fitting model. A maximally expanded model does not fit the accelerations (Dull et al., 1997). The pulsar accelerations combined with the fit to the velocity-dispersion profile gives us confidence that we were properly estimating the nonluminous remnant population within the half-mass radius. Dull et al. (2003) found that for high-concentration King Michie models, the gravitational acceleration falls short in the innermost regions of the cluster. The model of Sosin & King (1997) (labeled “King” in Fig. 9 of Dull et al., 2003) failed to fit the accelerations (as well as the central the velocity dispersion profile) because they had very few massive remnants in their model, 21% at 0.55 and less than 1% in a 1.55 bin. Because most of their remnants were in a lower mass bin, very few nonluminous remnants segregated into the cusp region of the cluster. Pasquali et al. (2004) did not consider the pulsar accelerations.
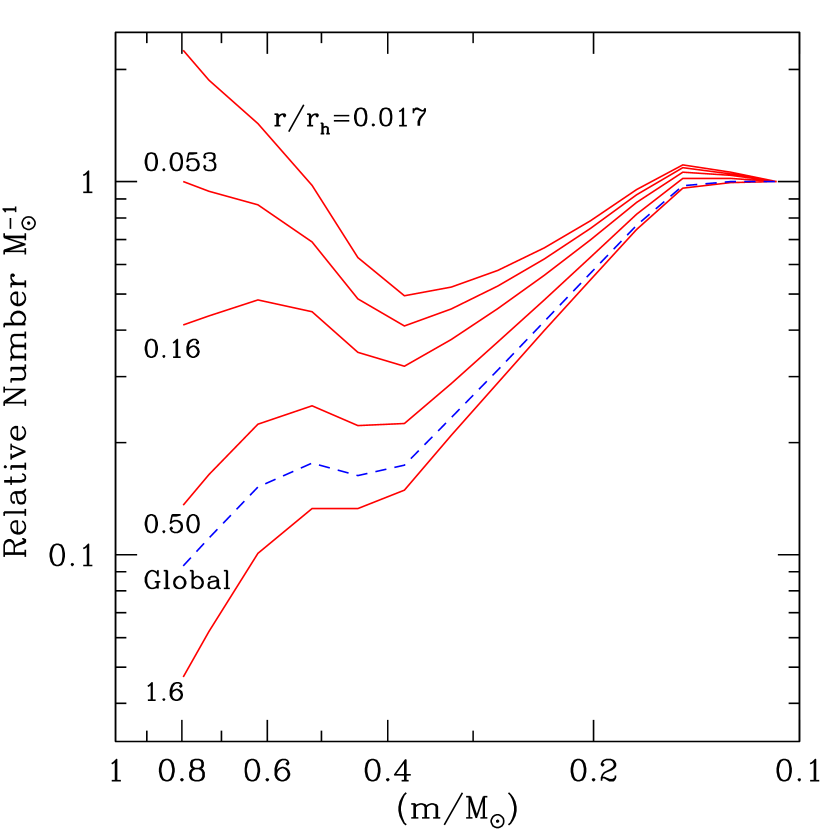
Because mass segregation modifies the observed mass function, one would be curious to see whether there is any region of the cluster where the local mass function is a close approximation to the global mass function. Figure 7 shows the variation in the observed mass function with radius. The observed mass function changes from being much flatter than the global mass function in the inner part of the cluster to being steeper than the global mass function in the outer regions of the cluster, as would be expected. None of the curves exactly replicate the global mass function. However, as noted by Pasquali et al. (2004), the local mass function best matches the global mass function near the half-mass radius.

It should be pointed out that at the outermost radii of our model cluster, i.e., radii greater than 10′, the local mass function and global mass function are identical. This is due to the very long relaxation times at these large radii. We do not show the mass function here because our cluster is assumed to be isolated whereas for a more realistic model some modification would likely have occurred at the outermost radii due to tidal stripping by the Galaxy.
4. Discussion
Our inferred IMF is flatter than a Salpeter IMF over the entire initial mass range, with a slope of for . We were able to fit the star count profiles, local mass functions, kinematic data, and millisecond pulsar accelerations with a neutron retention fraction of 5% for neutron stars created for stars with initial masses above 6.43. Without objects with masses of 1.2 and above, the star-count profiles would have been too steep over the radial range of 0 to 10″. The islope of stellar density profile of the most luminous stars depends on the ratio of masses of the luminous stars and the dominant mass species (Cohn, 1985). This is given by
| (2) |
Where is the logarithmic slope of the projected density profile, is the mass of the luminous stars (0.81), and is the mass of the dominant mass species (1.21). Note that this equation implies that the slope of the cusp giants should be , which is close to the observed slope (Sosin & King, 1997; Noyola & Gebhardt, 2006). This slope applies to the region where massive remnants () dominate the surface density. This corresponds to a radius inside of 5″ for our models, as seen in the surface-density profiles of our best-fitting model shown in Figure 4. Outside of this radius the surface-density slope slowly steepens and does not have a power-law form.
The models presented here require a total population of about 1600 neutron stars, which is a dramatic reducion relative to the neutron stars in the Dull et al. (1997) models. This appears to be much more realistic. Nonetheless, it is possible that some of the 1.2 and 1.4 objects may be represented by nonluminous, tightly bound white-dwarf binaries. In our models 32% of the total mass of the cluster is in white dwarf bins with masses 0.7 and 0.95 . It could be that these objects have undergone exchange reactions with primordial binaries composed originally of lower-mass main-sequence stars, via 3-body or binary-binary interactions (Sigurdsson & Phinney, 1993). This would not lower the number of single white dwarfs in the core significantly, due to their large numbers, but would add to the 1.4 bin. These binaries could not be present in large numbers in the form of main-sequence pairs. Such main-sequence binaries would have an magnitude of roughly 19 and would be apparent in the star count profiles of Sosin & King (1997), for the magnitude range 18.25 to 19.75, in the form of a steeper profile. If main-sequence binaries more massive than the turnoff did represent a sizeable fraction of the stars in this magnitude range, they would cause the profile to be much steeper than is observed.
One last explanation for the central slope of the surface density profile of M15 is the possible presence of a massive central black hole. The slope of the star count profile tends to be near . This is very similar to the expected from a massive black hole (Bahcall & Wolf, 1976). In the multi-mass case the slope of the projected star-count profiles in a Keplerian potential are given by
| (3) |
(Murphy, Cohn, & Durisen, 1991). Note that if objects more massive than the turnoff stars dominate the stellar density, then the turnoff stars will have a slope slightly less than (Bahcall & Wolf, 1977). Also note that the minimum slope possible for any group cannot be less than if a massive black hole is responsible for the cusp. Though the Sosin & King (1997) data do show this trend, it should be pointed out that in order to achieve these slopes out to 10″, the central black hole would have to have a mass in excess of 5000. Other evidence against a massive central black hole comes from the velocity-dispersion measurements of Gerssen et al. (2002) and McNamara (2003), which show a gradual rather than a steep rise in the velocity dispersion. The velocity dispersion in the Keplerian potential of a massive black hole is expected to rise as as opposed to . Thus, there is little need to invoke the presence of an IMBH in M15 on the basis of our model fitting. This is in accord with the conclusion by van den Bosch et al. (2006) that the significant central dark mass concentration in M15 can either be in the form of an IMBH, individual objects, or a combination of these.
One useful aspect of our models is that they can help guide obsevers as to what radii should be observed in order to best retrieve the global mass function. We find that observations near the half-mass radius give the best results for two reasons. First mass segregation has not altered the mass function as much as in the inner regions and second, tidal effects have likely had less effect at this radius than further out. Obtaining data at center of the cluster, 1 parsec from the center, and at the half-mass radius appear to be the best method for retrieving the global IMF. These radii are nearly identical to the data we have fit from Sosin & King (1997). For clusters that are nearer to the Sun it is important that observations be spaced accordingly. Sosin (1997b) shows an example of what may happen when local mass functions are determined at two adjacent radial bins in the cusp of a cluster. For M30 (NGC 7099), Sosin examined local mass functions in bins centered at 3″ and 9″ from the cluster center, which corresponds to 0.1 and 0.3 parsecs, respectively. These radii are similar to our second and third curves in Figure 7. Figure 7 shows that the slope of the mass function above 0.4 remains nearly constant at these small radii, even the though relative numbers of stars have changed. This should not be looked at as a sign of little mass segregation. This same effect would be seen even for a cluster in deep core collapse or bounce. This highlights the importance of radially spacing observations in globular clusters. Sosin (1997b) did obtain a HST FOC field at 20″, but unfortunately the field was not usable due to the presence of a bright giant.
Comparing our results with those of Pasquali et al. (2004), we obtain a similar slope of the IMF above 0.55. Below this mass, there are detailed differences in the mass function, but an overall trend of flattening or turnover. For both sets of models, there is a substantial amount of mass in remnants. For our models, the total mass in remnants is 46% of the cluster mass with 21% of the cluster mass in remnants above the turnoff mass. Given the evolving nature of our models, they are likely to provide a more realistic description of mass segregation and the central gravitational potential of M15.
5. Conclusions
We have fitted dynamically evolving Fokker-Planck models to a wide variety of data for M15, including HST observations of the stellar mass function at several radii, the star-count profiles, the velocity dispersion profile, and radio measurements of millisecond pulsar accelerations. We infer that M15 has a relatively flat IMF slope of or flatter. With a modest retention fraction of 5%, we infer that M15 presently contains 1560 neutron stars. While of order this amount of 1.4 objects is required to fit the data, some of these may be in the form of tightly-bound white dwarf pairs. The central cusp region is dominated by 1.2 white dwarfs, which represent about 7% of the cluster mass. For a low-metallicity cluster like M15, a substantial number of white dwarfs are formed in this mass range Hurley et al. (2000). Because of mass segregation, the global mass function is not replicated at any point in the cluster. However, the local and global mass functions come closest to each other near the half-mass radius of the cluster.
We conclude that there is no need to invoke the presence of an IMBH in M15. The presence of massive white dwarfs and neutron stars provides the necessary central gravitational potential to fit the surface density profile, the velocity dispersion profile, and the millisecond pulsar accelerations.
References
- Anderson (1992) Anderson, S. B. 1992, Ph.D. thesis, Caltech
- Anderson & King (1966) Anderson, J. & King, I. R. 1996, in Formation of the Galactic Halo . . . Inside and Out, eds. H. Morrison & A. Sarajedini, ASP Conf. Ser., 92, 257
- Alexander et al. (1997) Alexander, D. R., Brocato, E., Cassisi, S., Castellani, V., Ciaco, F., & degl’Innocenti, S. 1997, A&A, 317, 90
- Bahcall & Wolf (1976) Bahcall, J. N. & Wolf, R. A. 1977, ApJ, 209, 214
- Bahcall & Wolf (1977) Bahcall, J. N. & Wolf, R. A. 1977, ApJ, 216, 883
- Bailyn (1993) Bailyn, C. D. 1993, in Structure and Dynamics of Globular Clusters, eds. S. G. Djorgovski & G. Meylan, ASP Conf. Ser., 50, 191
- Bash et al. (2008) Bash, F. N., Gebhardt, K., Goss, W. M., & Vanden Bout, P. A. 2008, AJ, 135, 182
- Baumgardt (2003) Baumgardt, H., Hut, P., Makino, J., McMillan, S. L. W., & Portegies Zwart, S. F. 2003, ApJ, 582, L21
- Bergbusch & Vandenberg (1992) Bergbusch, P. A. & Vandenberg, D. A. 1992, ApJS, 81, 163
- Binney & Tremaine (1987) Binney, J. & Tremaine, S. 1987, Galactic Dynamics, (Princeton, NJ: Princeton Univ. Press)
- Chakrabarty (2006) Chakrabarty, D. 2006, AJ, 131, 2561
- Cohn (1980) Cohn, H. 1980, ApJ, 242, 765
- Cohn (1985) Cohn, H., 1985, in Dynamics of Star Clusters, eds. J. Goodman & P. Hut, (Dordrecht: Reidel), 161
- Cohn et al. (1989) Cohn, H., Hut, P., & Wise, M. 1989, ApJ, 342, 814
- Cool et al. (1996) Cool A. M., Piotto, G., & King, I. R. 1996, ApJ, 468, 655
- Dauphole et al. (1997) Dauphole, B., Geffert, M., Colin, J., Ducourant, C., Odenkirchen, M., & Tucholke, H. J., 1997, å, 313, 119
- Davies & Hansen (1997) Davies, M. B. & Hansen, B. M. S. 1998, MNRAS, 301, 15
- de Marchi & Parsece (1994) de Marchi, G. & Paresce, F. 1994, A&A, 281, L13
- Dhawan et al. (2007) Dhawan, V., Mirabel, I. F., Ribó, M., & Rodrigues, I. 2007, ApJ, 668, 430
- Dieball et al. (2008) Dieball, A., Knigge, C., Zurek, D. R., Shara, M. M., Long, K. S., Charles, P. A., & Hannikainen, D. 2008, IAU Symposium, 246, 361
- Dinescu et al. (1999) Dinescu, D. I., Girard, T. M., & van Altena, W. F. 1999, AJ, 117, 1792
- Djorgovski & Piotto (1993) Djorgovski, S. & Piotto, G. 1993, in Structure and Dynamics of Globular Clusters, eds. S. G. Djorgovski & G. Meylan, ASP Conf. Ser., 50, 203
- Drukier (1996) Drukier, G. A. 1996, MNRAS, 280, 498
- Drukier et al. (1998) Drukier, G. A., Slavin, S. D., Cohn, H. N., Lugger, P. M., Berrington, R. C., Murphy, B. W., & Seitzer, P. O. 1998, AJ, 115, 708
- Dull et al. (1997) Dull, J. D., Cohn, H. N., Lugger, P. M., Murphy, B. W., Seitzer, P. O., Callanan, P. J., Rutten, R. G. M., & Charles, P. A. 1997, ApJ, 481, 267
- Dull et al. (2003) Dull, J. D., Cohn, H. N., Lugger, P. M., Murphy, B. W., Seitzer, P. O., Callanan, P. J., Rutten, R. G. M., & Charles, P. A. 2003, ApJ, 585, 598
- Durrell & Harris (1993) Durrell, P. R. & Harris, W. E. 1993. AJ, 105, 1420
- Fregeau (2008) Fregeau, J. M. 2008, ApJ, 673, L25
- Gao et al. (1991) Gao, B., Goodman, J., Cohn, H., & Murphy, B. 1991, ApJ, 370, 567
- Gebhardt et al. (1994) Gebhardt, K., Pryor, C., Williams, T. B., & Hesser, J. E. 1994, AJ, 107, 2067
- Gebhardt et al. (1997) Gebhardt, K., Pryor, C., Williams, T. B., & Hesser, J. E. 1997, AJ, 113, 1026
- Gebhardt et al. (2000) Gebhardt, K., Pryor, C., O’Connell, R. D., Williams, T. B., & Hesser, J. E. 2000, AJ, 119, 1268
- Gerssen et al. (2002) Gerssen, J., van der Marel, R. P., Gebhardt, K., Guhathakurta, P., Peterson, R.C., & Pryor, C. 2002, AJ, 124, 3270
- Gerssen et al. (2003) Gerssen, J., van der Marel, R. P., Gebhardt, K., Guhathakurta, P., Peterson, R.C., & Pryor, C. 2003, AJ, 125, 376
- Girardi et al. (2000) Girardi, L., Bressan, A., Bertelli, G., & Chiosi, C. 2000, A&A, 141, 371
- Goodman (1993) Goodman, J. 1993, in Structure and Dynamics of Globular Clusters, eds. S. G. Djorgovski & G. Meylan, ASP Conf. Ser., 50, 87
- Grabhorn et al. (1992) Grabhorn, R.P., Cohn, H.N., Lugger, P.M., & Murphy, B.W. 1992, ApJ, 392, 86
- Grindlay et al. (2001) Grindlay, J. E., Heinke, C., Edmonds, P. D., & Murray, S. S. 2001a, Science, 292, 2290
- Guhathakurta et al. (1996) Guhathakurta, P., Yanny, B., Xchneider, D. P., & Bahcall, J. N. 1996, AJ, 111, 267
- Hansen & Phinney (1997) Hansen, B. M. S. & Phinney, E. S. 1997, MNRAS, 291, 569
- Haurberg et al. (2010) Haurberg, N., Lubell, G. M. G., Lugger, P. M., Cohn, H. N., Anderson, J., Cool, A., & Serenelli, A. M. 2010, Bulletin of the American Astronomical Society, 41, 338
- Heinke et al. (2009) Heinke, C. O., Cohn, H. N., & Lugger, P. M. 2009, ApJ, 692, 584
- Hertz & Grindlay (1983) Hertz, P. & Grindlay, J. E. 1983, ApJ, 275, 105
- Ho et al. (2003) Ho, L. C., Terashima, Y., & Okajima, T. 2003, ApJ, 587, L35
- Hurley et al. (2000) Hurley, J. R., Pols, O. R., Tout, C. A. 2000, MNRAS, 315, 543
- Howell et al. (2001) Howell et al. 2001, Bulletin of the American Astronomical Society, 196, 41.08
- Inagaki & Saslaw (1985) Inagaki, S. & Saslaw, W. C. 1985, ApJ, 292, 339
- King et al. (1998) King, I. R., Anderson, J., Cool, A. M., & Piotto, G. 1998, ApJ, 492, L37
- Kulkarni et al. (1993) Kulkarni, S. R., Hut, P., & McMillan, S. 1993, Nature, 364, 421
- Lugger et al. (1987) Lugger, P. M., Cohn, H. N., Grindlay, J. E., Bailyn, C. D., & Hertz, P. 1987, ApJ, 320, 482
- Lugger et al. (1995) Lugger, P. M., Cohn, H. N., & Grindlay, J. E. 1995, ApJ, 439, 191
- Lyne & Lorimer (1994) Lyne, A. G. & Lorimer, D. R., 1994, Nature, 369, 127
- Makino (1996) Makino, J. 1996, ApJ, 471, 796
- McNamara (2003) McNamara, B. J., Harrison, T. E., & Anderson, J. 2003, ApJ, 595, 187
- McNamara et al. (2004) McNamara, B. J., Harrison, T. E., & Baumgardt, H. 2004, ApJ, 602, 264
- Murphy (1993) Murphy, B. W. 1993, in Structure and Dynamics of Globular Clusters, eds. S. G. Djorgovski & G. Meylan, ASP Conf. Ser., 50, 101
- Murphy & Cohn (1988) Murphy, B. W. & Cohn, H. N. 1988, MNRAS, 232, 835
- Murphy et al. (1990) Murphy, B. W., Cohn, H. N., & Hut, P. 1990, MNRAS, 245, 335
- Murphy et al. (1991) Murphy, B. W., Cohn, H. N., Durisen, R. H. 1991, ApJ, 370, 60
- Newell, Da Costa, & Norris (1976) Newell, B., Da Costa, G. S., & Norris, J. 1976, ApJ, 208, L55
- Noyola & Gebhardt (2006) Noyola, E. & Gebhardt, K. 2006, AJ, 132, 447
- Paresce & De Marchi (2000) Paresce, F., & De Marchi, G. 2000, ApJ, 534, 8
- Pasquali et al. (2004) Pasquali, A., de Marchi, G., Pulone, L., & Brigas, M. S. 2004, å, 428, 469
- Peterson et al. (1989) Peterson, R. C., Seitzer, P., & Cudworth, K. M. 1989, ApJ, 347, 251
- Pfahl et al. (2002) Pfahl, E., Rappaport, S., & Podsiadlowski, P. 2002, ApJ, 573, 283
- Phinney (1993) Phinney, E. 1993, in Structure and Dynamics of Globular Clusters, eds. S. G. Djorgovski & G. Meylan, ASP Conf. Ser., 50, 141
- Piotto et al. (1997) Piotto, G., Cool, A. M., & King, I.R. 1997, AJ, 113, 1345
- Richer & Fahlman (1989) Richer, H. B. & Fahlman, G. G. 1989, ApJ, 339, 178
- Richer et al. (2002) Richer, H. B., Brewer, J., Fahlman, G. G., Gibson, B. K., Hansen, B. M., Ibata, R., Kalirai, J. S., Limongi, M., Rich, R. M., Saviane, I., Shara, M. M., & Stetson, P. B. 2002, ApJ, 574, L151
- Richer et al. (2008) Richer, H. B., Dotter, A., Hurley, J., Anderson, J., King, I., Davis, S., Fahlman, G. G., Hansen, B. M. S., Kalirai, J., Paust, N., Rich, R. M., & Shara, M. M., 2008, AJ, 135, 2141
- Shara et al. (2004) Shara, M. M., Hinkley, S., Zurek, D. R., Knigge, C., & Bond, H. E. 2004, AJ, 128, 2847
- Sigurdsson & Hernquist (1993) Sigurdsson, S., & Hernquist, L. 1993, Nature, 364, 423
- Sigurdsson & Phinney (1993) Sigurdsson, S. & Phinney, E. S. 1993, ApJ, 415, 631
- Sosin (1997a) Sosin, C. 1997, AJ, 114, 1517
- Sosin (1997b) Sosin, C. 1997, Ph.D. Thesis, University of California, Berkeley
- Sosin & King (1997) Sosin, C. & King, I.R. 1997, AJ, 113, 1328
- Spitzer (1969) Spitzer, L., Jr. 1969, ApJ, 158, L139
- Stetson (1994) Stetson, P.B. 1994, PASP, 106, 250
- Sugimoto & Bettwieser (1983) Sugimoto, D. & Bettwieser, E. 1983, MNRAS, 204, 19P
- Trager et al. (1993) Trager, S. C., Djorgovski, S., and King, I. R. 1993, in Structure and Dynamics of Globular Clusters, eds. S. G. Djorgovski & G. Meylan, ASP Conf. Ser., 50, 347
- van den Bosch et al. (2006) van den Bosch, R., de Zeeuw, T., Gebhardt, K., Noyola, E., van de Ven, G. 2006, ApJ, 641, 852
- van der Marel et al. (2002) van der Marel, R. P., Gerssen, J., Guhathakurta, P., Peterson, R., & Gebhardt, K. 2002, AJ, AJ, 124, 3255
- Vesperini & Heggie (1997) Vesperini, E. & Heggie, D.C. 1997, MNRAS, 289, 898
- Vesperini et al. (2010) Vesperini, E., McMillan, S. L. W., D’Ercole, A., & D’Antona, F. 2010, ApJ, 713, L41
- Watters et al. (2000) Watters, W. A., Joshi, K. J., & Rasio, F. A. 2000, ApJ, 539, 331
- White & Angelini (2001) White, N. E. & Angelini, L. 2001, ApJ, 561, L101
- Yanny et al. (1994a) Yanny, B., Guhathakurta, P., Bahcall, J. N., & Schneider, D. P. 1994, AJ, 107, 1745
- Yanny et al. (1994b) Yanny, B., Guhathakurta, P., Schneider, D. P., & Bahcall, J. N. 1994, ApJ, 435, L59