Dissection of H Emitters : Low-z Analogs of Star-Forming Galaxies
Abstract
Strong H Emitters (HAEs) dominate the Lyman-break galaxy population. We have identified local analogs of these HAEs using the Sloan Digital Sky Survey (SDSS). At , only 0.04 % of galaxies are classified as HAEs with H equivalent widths () comparable to that of HAEs. Local HAEs have lower stellar mass and lower ultraviolet (UV) luminosity than HAEs, yet the H-to-UV luminosity ratio as well as their specific star-formation rate is consistent with that of HAEs indicating that they are scaled down versions of high-z star-forming galaxies. Compared to the previously studied local analogs of Lyman break galaxies selected using rest-frame UV, local HAEs show similar UV luminosity surface density, weaker D breaks, lower metallicity and lower stellar mass. This supports the idea that local HAEs are less evolved galaxies than the traditional Lyman break analogs. We are not able to constrain if the star-formation history in local HAEs is powered by mergers or by cosmological cold flow accretion. However, in the stacked spectrum, local HAEs show a strong HeII emission line suggesting a population of young (10 Myr), hot, massive stars similar to that seen in some Wolf-Rayet galaxies. Low [NII]/[OIII] line flux ratios imply that local HAEs are inconsistent with being systems that host bright AGN. Instead, it is highly likely that local HAEs are galaxies with an elevated ionization parameter, either due to a high electron density or large escape fraction of hydrogen ionizing photons as in the case for Wolf-Rayet galaxies.
1 Introduction
In attempts to understand the cosmic star formation history over cosmic time, most conventional approaches select high-redshift star-forming galaxies based on different unique signatures in their spectral energy distribution. Well-known examples are the Lyman-break in the ultraviolet (UV) continuum, Lyman- emission line, the Balmer-break in evolved stellar populations and more recently, the shape of the observed far-infrared spectral energy distribution which shows a peak between 60 and 100m. The next step is to investigate their physical properties such as star formation rates, stellar mass and stellar populations using yardsticks calibrated in the local universe for which higher signal to noise and higher spatial resolution data are available, compared to the high-redshift galaxies considered. By studying the local counterparts of high-redshift galaxies, it is possible to understand the physical trigger for star-formation and its temporal evolution, and how physical parameters in the interstellar medium affect observables that trace the star formation activity.
One well known study is the investigation of local UV-luminous galaxies as analogs of high-redshift Lyman-break galaxies. Heckman et al.(2005) have studied the properties of FUV-luminous galaxies at using the combination of Galaxy Evolution Explorer (GALEX) and Sloan Digital Sky Survey (SDSS) data. The FUV luminosities of the selected galaxies are greater than , comparable to that of Lyman break galaxies (LBGs). The number density of such UV-luminous galaxies (UVLGs) is 0.85 % of all galaxies at (Hoopes et al. 2007). Hoopes et al.(2007) have shown that the specific star formation rate of UVLGs is correlated with their UV surface brightness, and the subset of compact UVLGs with the highest UV surface brightness (i.e., kpc-2; supercompact UVLGs) are likely to be the local counterparts to high-redshift LBGs in terms of their UV surface brightness, star formation rate, metallicity, and stellar mass.
These supercompact UVLGs, later denoted as Lyman break Analogs (LBAs), have been studied in detail in the radio (Basu-Zych et al. 2007) and infrared (Overzier et al. 2009; Overzier et al. 2011) which helps provide a window into high-redshift star forming environments in the local Universe. For example, high spatial resolution studies of the morphologies of LBAs show clear evidence of merger-induced star formation (Overzier et al. 2008, 2010). In contrast, the signatures of mergers are not visible in the rest-frame UV observation of high-redshift galaxies. Ravindranath et al. (2006) demonstrated that only 30% of galaxies show signatures of mergers. It is plausible that this derived fraction is a lower limit due to surface brightness dimming (Overzier et al. 2010). However, there is a theoretical suggestion that high-redshift star formation is preferentially governed by a supply of cold gas through cold flow accretion rather than merging (Dekel et al. 2009). The mechanism may not be valid in the local universe due to the fact that the halo masses are much larger and the gas gets shock heated before it falls within the virial radius of the halo. Thus, the ‘local counterparts’ of high-redshift star-forming galaxies may not necessarily have a similar source of gas supply as distant galaxies. However, their similarity in observable properties are useful for evaluating if the derived physical quantities for high redshift galaxies, such as star formation rates and dust obscuration are accurate. Thus, the key question is whether the UV-selected LBAs are accurate local analogs for high-redshift star-forming galaxies.
Recently, we have discovered that at least 70 % of spectroscopically confirmed Lyman-break galaxies at show a flux density excess in Spitzer 3.6 m over the stellar continuum, which is due to redshifted H emission (Shim et al. 2011, H Emitters; hereafter HAEs). The result is striking for two reasons; one is that strong nebular emission lines do affect broad-band photometry and photometry-based SED fitting (e.g. Chary et al. 2005, Zackrisson et al. 2008, Capak et al. 2011, Schaerer & de Barros 2009), and two, high-redshift galaxies show strong H emission which implies a star-formation rate that is as high, if not higher than that inferred from their large UV luminosities. The estimated H equivalent widths (EWs) are in the range of , rarely seen in surveys of local galaxies. Despite the selection bias in favor of emission line sources that is associated with spectroscopic confirmation of Lyman-break galaxies, the value of 70 % is unusually high. It suggests that there is a physical reason for this ‘strong H phase’ that was previously not known. The high H-to-UV ratio and large H EW compared to the ages of the stellar population therein suggest that at least 50 % of HAEs prefer an extended star formation timescale rather than a burst-like, short (100 Myr) timescale. Therefore, such extended star formation histories should be included in the selection criteria for local counterparts of high-redshift star-forming galaxies.
Large H EW galaxies can be easily identified among local samples. In this paper, we selected local galaxies () with H EW500 Å from the Sloan Digital Sky Survey (SDSS). We use the measured properties of these local HAEs, to understand the properties of HAEs that dominate the high-redshift star-forming galaxy population. We investigate possible reasons for the origin of strong H emission in star-forming galaxies (presence of active galactic nuclei, low metallicity, extended star formation histories, and dust extinction) by using spectroscopically derived values such as line indices and metallicity, as well as UV-to-IR flux ratios. A comparison between properties of HAEs and LBAs is discussed, and the implications of our improved understanding of local HAEs to high-redshift star formation is presented. Throughout this paper, we use a cosmology with , , and . All magnitudes mentioned are in AB mag, corrected for Galactic extinction using the Schlegel et al.(1998) dust map.
2 The Local Sample of H Emitters
2.1 Local H Emitters
We selected objects with H EW larger than 500 Å from Sloan Digital Sky Survey (SDSS) Data Release 7, using the MPA-JHU value added catalog111http://www.mpa-garching.mpg.de/SDSS/DR7/ (Kauffmann et al. 2003a; Brinchmann et al. 2004). After the H EW cut, we inspected each object individually in the SDSS image and spectrum. Extragalactic HII regions, which reside in the spiral arms of large galaxies, are discarded. Due to the limited fiber size used in SDSS spectroscopy ( diameter), the measured H EW corresponds to the equivalent width in the central regions of an extended galaxy. Thus the galaxy-integrated H EW may be different if the line to continuum ratio changes dramatically in the outer parts of a galaxy. To ensure that gradients in equivalent widths do not significantly affect our results, we excluded objects with half-light radii larger than (using in -band; exponential disk fitting from SDSS pipeline). Finally, we are left with 299 galaxies (%) out of 818333 galaxies spectroscopically observed in SDSS DR7. We refer these galaxies as ‘local HAEs’.
As discussed above, the fiber spectra only sample the central regions for extended objects. Since it is possible that the stellar continuum may be less centrally concentrated compared to the line emission, aperture corrections are required as described in Brinchmann et al. (2004). Brinchmann et al.(2004) estimated the aperture correction of up to a factor of 10 to be applied to the star formation rates and stellar mass values in the MPA-JHU catalogs, based on the likelihood distribution function P(SFR/—color). In order to further ensure that the line flux measurements and equivalent width measurements are robust, we convolved the SDSS spectrum with the bandpasses used for photometry, and compared the magnitudes derived in this way with the observed broadband magnitudes. At redshifts greater than 0.05, the H line falls within the Sloan band filter while at lower redshifts, the line would be in the Sloan band filter. As a result, aperture corrections based on either or -band photometry would take any variation in equivalent width outside the fiber into account. We found the median correction factor for the line flux estimates to be .
Table 1 lists the SDSS photo-object IDs, coordinates, H flux and equivalent width, and other parameters for local HAEs. The H flux and equivalent width are the observed values. The analysis such as the derivation of H luminosity has been performed after applying aperture correction on the numbers presented in the Table 1
2.2 Ancillary Data Used
Most parameters used in this analysis are drawn either from MPA-JHU value added catalog and/or the SDSS pipeline. Stellar mass, metallicity, line fluxes and equivalent widths for significant emission lines, 4000 Å break (4000) in the MPA-JHU value added catalog are obtained through spectral and/or multi-wavelength photometry fitting. Here we briefly describe how each parameter is derived in the MPA-JHU value added catalogs.
Metallicities, i.e., the oxygen abundances, were derived following the method presented in Tremonti et al.(2004). All the most prominent emission lines ([OII], H, [OIII], H, [NII], [SII]) were fit simultaneously to models for integrated galaxy spectra (Charlot & Longhetti 2001) with varying metaliicity, ionization parameter, and dust-to-metal ratio. The median of the likelihood distribution of the metallicity was adopted as the metallicity of each galaxy. The stellar masses were derived based on the multi-wavelength photometry fitting, following the method described in Kauffmann et al.(2003a) and Salim et al.(2007). Template galaxy spectra were generated using Bruzual & Charlot (2003) population synthesis code, with metallicity range spanning and stellar population age spanning 0.1 Gyr to the age of the universe. An exponentially decaying star formation history was assumed with random starbursts superimposed on the continuous star formation. Internal reddening and attenuation due to the IGM are applied to the template galaxy spectra, and the resulting template spectra were convolved with SDSS passbands to produce broad-band photometry in each filter. After calculating of the fit, probability distributions for each parameters, such as star formation rate, stellar masses, and dust attenuation were constructed. Rather than finding single best-fit template, the MPA-JHU value added catalog presents the median of the distribution of each parameter in order to avoid the degeneracies between parameters.
We have now added GALEX far- and near-ultraviolet (FUV/NUV) flux densities of local HAEs from GALEX Data Release 6. GALEX has a spatial resolution of 6. Using a cross-identification radius of 3, 266 HAEs among 299 (%) are observed in at least one GALEX band. After matching, each result was visually examined to make sure that FUV or NUV emission is from the local HAE itself, and not contaminated by nearby objects. The flux density limit differs depending on which GALEX survey the ultraviolet flux has been derived from - however on average, the flux density limits in the FUV (1500 Å) and NUV (2300 Å) are 5 Jy and 4 Jy respectively.
We also obtained mid-infrared (MIR; m) photometry for local HAEs from the Wide-field Infrared Survey Explorer (WISE) preliminary data release (Wright et al. 2010). 95 of the galaxies (95/299, %) have coverage during the WISE preliminary survey period, among which 65 galaxies are detected in either WISE channel 3 (12 m) or channel 4 (22 m) with approximate flux density limits of mJy and mJy at the 5 level. WISE channel 3 and channel 4 band fluxes are converted to total infrared luminosities using bolometric corrections derived from model infrared galaxy templates (Chary & Pope 2010).
3 Comparison with Other Galaxies
3.1 Comparison with HAEs
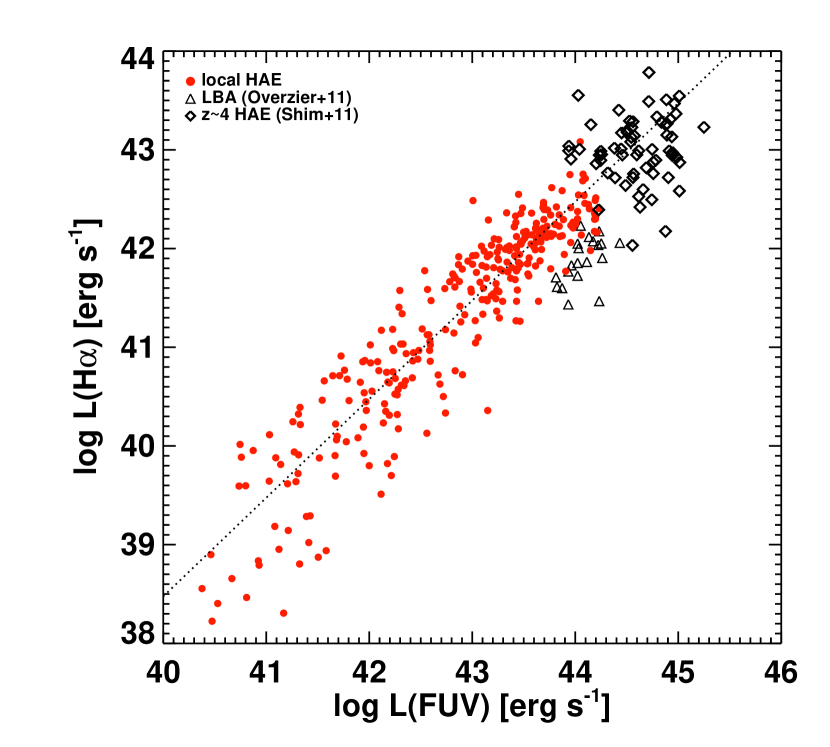
Local HAEs are distributed at , with more than half lying at (Figure 1). Figure 2 shows how local HAEs and their counterparts (Shim et al. 2011) compare with each other in terms of the physical properties of their stellar populations. In Figure 2a, we compare the H and FUV luminosity of local HAEs, HAEs and LBAs from Overzier et al. (2011). The H/FUV luminosity ratio of both local and HAEs are similar () while the local LBAs show a ratio of . The dotted line in Figure 2a is a linear fit to describe the correlation between H luminosity and UV luminosity of local HAEs, with a slope value of 0.99. Since both H and UV are star-formation tracers which are affected by age and dust obscuration in different ways, a slope close to unity indicates that both sets of galaxies display similar physical properties of the stellar population and ISM. However, local HAEs have H luminosities and UV luminosities lower than that of HAEs by nearly an order of magnitude, which means that the actual star formation rates of local HAEs are smaller than their high-redshift counterparts by a factor of (Figure 2b). It is however clear that HAEs are scaled-up versions of local HAEs.
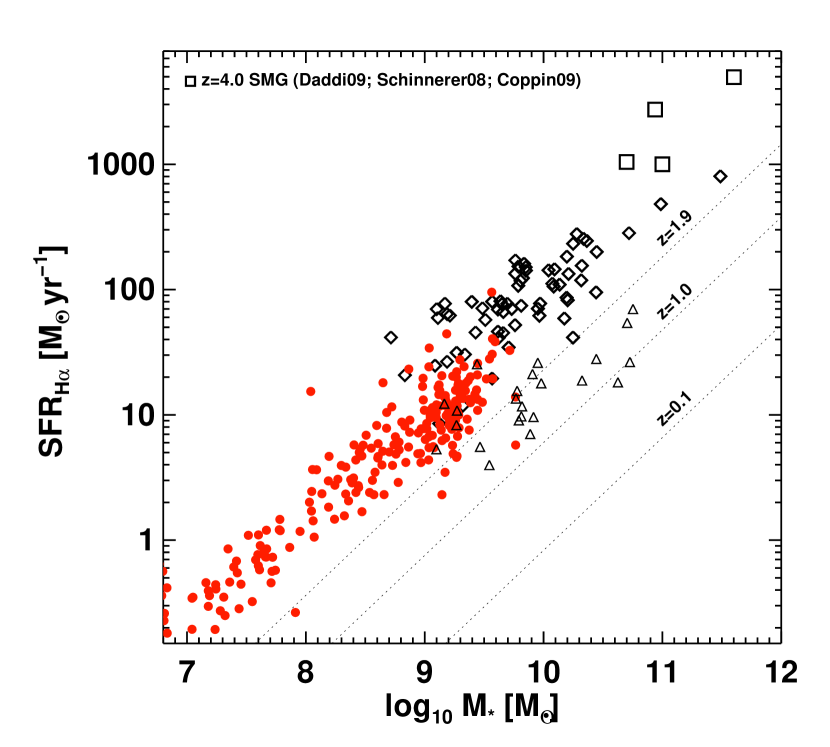
In Figure 2b, we compare the star-formation rates relative to the stellar mass of local HAEs, HAEs and LBAs. The H based star-formation rates are derived assuming a Salpeter IMF and a constant star-formation rate. The ratio of star-formation rate to stellar mass is referred to as the specific star-formation rate. Dotted diagonal lines in the figure show specific star-formation rates at different redshifts of star-forming main sequence galaxies based on the literature (Elbaz et al. 2007; Noeske et al. 2007; Daddi et al. 2007). Local HAEs show H based star-formation rates that are almost a factor of 30 higher than typical star-forming galaxies of the same stellar mass, i.e. they show elevated specific star-formation rates which are comparable to that of HAEs and merger-driven high-redshift submillimeter galaxies. The stellar mass range sampled by local HAEs is on average lower than that of HAEs. Although, there is a significant overlap at ; yet a dominant fraction ( %) of local HAEs appear to be small galaxies with stellar mass smaller than .
It is therefore clear that the H EW selection identifies local galaxies that are similar in their specific star-formation rates to large H EW galaxies at but with scaled down star-formation rates and stellar masses. Note that it is also possible that there could be HAEs with H EW less than 500 Å. However, since our selection for high redshift HAEs is based on the broad-band photometric excess in the Spitzer 3.6 m imaging data in the Great Observatories Origins Deep Survey fields (Shim et al. 2011) we are biased towards selecting the largest equivalent width objects. Such large EW objects are also being found in wide-field spectroscopic imaging surveys (Atek et al. 2011). Nevertheless, % of spectroscopically selected galaxies (most of which are initially classified as Lyman break galaxies) are observed to show a photometric excess, reflecting strong H emission with H EW.
3.2 Comparison with Local UV-selected Star-forming Galaxies
We next compare local HAEs with local analogs of z star-forming galaxies: UV luminous galaxies (UVLG) and Lyman break analogs (LBAs) which are a subset of UVLGs.
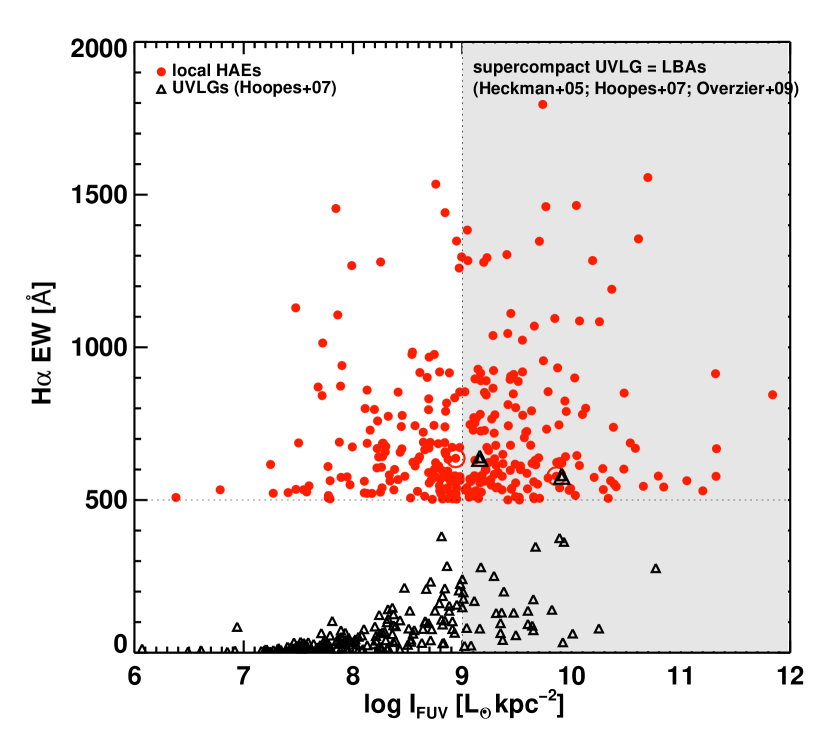
Contrary to the consistency between local HAEs and HAEs, the local analogs of Lyman break galaxies (Heckman et al. 2005; Hoopes et al. 2007; Overzier et al. 2009) show significant differences with HAEs in terms of H EW. Lyman break analogs (LBAs) share a similar stellar mass range with HAEs, but most of the LBAs have H EW lower than 500 Å (Figure 3). While LBAs have been shown to have UV luminosity surface density consistent with that of Lyman break galaxies, their H emission is significantly weaker than that of the Lyman break galaxies. This implies that either the star formation history and/or the physical parameters related to star formation are likely different between LBAs and high-redshift Lyman break galaxies. Furthermore, the LBAs are thought to be more analogous to the galaxy population where the H EWs are correspondingly lower (Reddy et al. 2010, Erb et al. 2006).
In Figure 2a, LBAs lie consistently below the dotted line describing the H-to-UV luminosity ratio for HAEs. On average, the H luminosity of LBAs is times lower than HAEs with the same UV luminosity. Since H EW is closely tied to the age of the stellar population and the metallicity, it appears that the LBAs might have older, higher metallicity stellar populations than both local and HAEs, a scenario we will investigate in greater detail in Section 5. Based on these observed differences, it appears that the LBAs are unlikely to be representative of typical star-forming galaxies at .
Figure 3 illustrates the distribution of H EW and UV surface brightness of local HAEs and UVLGs (). The UV surface brightness is estimated at 1530 Å, i.e., the central wavelength of GALEX FUV-band. The surface brightness is calculated by dividing one-half the rest-frame 1530 Å luminosity by the area of the galaxy encompassed within the half-light radius in the -band (; Hoopes et al. 2007). For the half-light radius in -band, we used the radius from the seeing-corrected exponential model fit calculated by the SDSS pipeline which is consistent with the analysis of Hoopes et al.(2007). For galaxies larger than which would be resolved even in seeing limited images, the observed half-light radius was used instead of the seeing-corrected radius. There are only two overlapping objects between the samples of local HAEs and UVLGs. The SDSS object ids (photometric id) of these two are 587724199349387411 () and 588013384341913605 (; Table 1). The two objects are marked as red points enclosed with large red circles with values calculated using the technique outlined above. The triangles enclosed with larger triangles show the values for these two objects in Hoopes et al. (2007), which are in excellent agreement with our values. Discrepancies in the derived FUV surface brightness originate from adopting different FUV magnitudes; GALEX Data Release 2 (used in Hoopes et al. 2007) magnitudes are superceded by GALEX Data Release 6 (used in our analysis).
The median H EW of UVLGs is only , which is far less than the value used in the selection criteria of local HAEs (). The LBAs, since they have higher UV surface brightnesses, should thereby show higher specific SFR (Hoopes et al. 2007), and thus larger H EW. The median H EW of compact ( kpc-2) UVLGs are indeed slightly larger than that of large ( kpc-2) UVLGs (Figure 3), yet the correlation between UV surface brightness and H EW of LBAs (compact UVLGs) is not significant. No such correlation can be seen in local HAEs. Remarkably, % of local HAEs have UV surface brightness higher than kpc-2, comparable with that of LBAs. This high UV surface brightness is mostly due to the small half-light radius of local HAEs rather than the UV luminosity itself. While UVLGs (thus LBAs) are defined as galaxies with larger than , the distribution of local HAEs ranges between .
Many local HAEs show compact morphologies despite their redshift distribution skewed towards lower redshift compared to UVLGs. The redshift distribution of UVLGs ranges between , while the redshift distribution of HAEs ranges between . As a result, the half-light radius of local HAEs is in general smaller than kpc, while the half-light radius () ranges between kpc for UVLGs. Because of this difference in , the median UV surface brightness () of local HAEs ( kpc-2) is higher than that of UVLGs ( kpc-2). This shows that there exists a significant number of local starbursts with specific star-formation rates similar to that of high-redshift star-forming galaxies but which are missed in samples that use the total UV luminosity as the primary selection criterion.
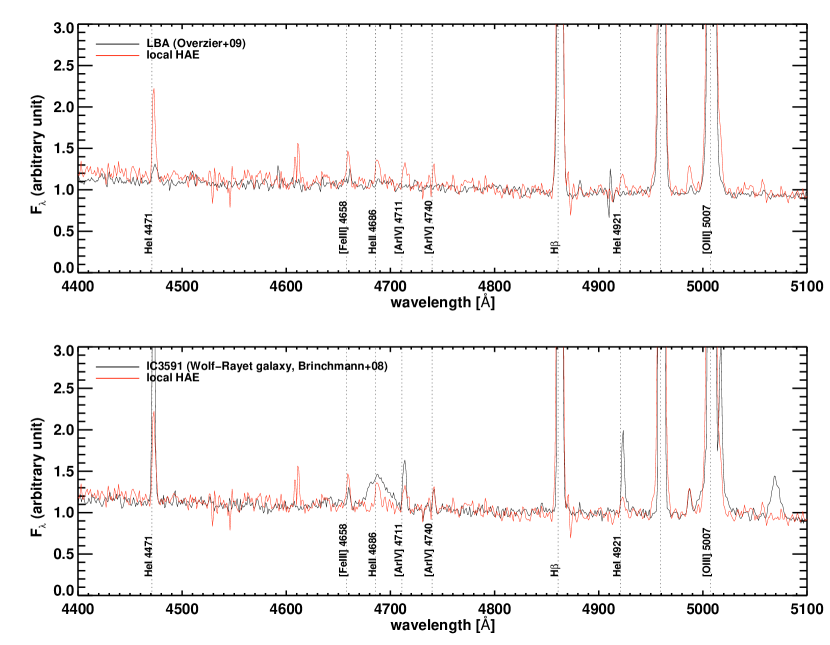
Despite the similarity in UV surface brightness, the spectral features appearing in the composite spectrum of LBAs and local HAEs are significantly different. Figure 4 shows a comparison between the composite spectrum of LBAs and local HAEs (top), as well as the comparison between the composite spectrum of local HAEs and a single Wolf-Rayet galaxy, IC3591 (bottom). The composite spectrum of local HAEs is an average stack of the 197 local HAEs which do not show any signs of Wolf-Rayet signatures such as the blue bump around HeII 4686 Å and/or HeII 4686 Å emission line with greater than 3. Before stacking, each spectrum was normalized using the continuum flux at 4800 Å. The composite spectrum of LBAs is an average stacking of the 27 LBAs (Overzier et al. 2009) using the same method. The composite spectrum of local HAEs shows slightly bluer stellar continuum at . When the optical stellar continuum is approximated using , the slope for local HAEs is 3.9 while that for LBAs is 1.8, two times lower.222The slope is determined for arbitrary unit, thus the numbers should be used for relative comparison only. The composite spectrum of local HAEs also shows clear HeII 4686 Å emission, HeI 4471 Å and 4921 Å lines, and other forbidden lines such as [FeIII] 4658 Å, [ArIV] 4711 Å and 4740 Å lines. The [NII] emission at either 6548 Å or 6584 Å is relatively weak compared to H, and [OIII] doublet at 5007 Å is strong compared to H in the local HAEs. The physical properties of the galaxies will be further discussed through the location of local HAEs in the emission line diagnostics diagram (Baldwin et al. 1981) in Section 4.
3.3 Comparison with Wolf-Rayet Galaxies
We matched the same of 299 local HAEs with the catalog of previously studied Wolf-Rayet galaxies (Zhang et al. 2007; Brinchmann et al. 2008b). In total, 43 local HAEs (%) are identified as Wolf-Rayet galaxies. Wolf-Rayet galaxies are specifically marked in Table 1. Besides these 43, we found that another 59 local HAEs show HeII emission line at line in their spectra, despite they are not matched with Wolf-Rayet galaxy catalogs. For the remaining HAEs, we were able to construct a composite spectrum as described above. At the bottom panel of Figure 4, we compare the composite spectrum of local HAEs (197 objects without Wolf-Rayet signature in individual spectrum; same as Figure 4a) with the spectrum of a Wolf-Rayet galaxy IC 3591 (Brinchmann et al. 2008b). The composite spectrum does not show the existence of a broad blue bump typical of Wolf-Rayet galaxies. However, the fact that some of the local HAEs are Wolf-Rayet galaxies and the existence of the HeII 4686 Å emission line in the composite spectrum suggests that the star formation environment in some local HAEs may be similar to that of Wolf-Rayet galaxies.
The origin of the HeII 4686 Å line is however unclear and has been discussed extensively in Thuan & Izotov (2005) and Shirazi & Brinchmann (2012). The former argue for radiative shocks while the latter present a range of scenarios including a population of hot, early type stars due to stellar rotation. The strength of HeII 4686 Å is known to be dependent on H EW (Brinchmann et al. 2008b; Shirazi & Brinchmann 2012). IC3591, compared here, has an H EW of 263 Å (H EW = 1556 Å) thus it is one of the galaxies with the largest H EWs among Wolf-Rayet galaxies. We do not find any significant evidence for the strength of H emission in the local HAEs being a preferential identifier of Wolf-Rayet galaxies. However, it appears that local HAEs are intermediate in their properties between Wolf-Rayet galaxies and LBAs in terms of their emission line strengths as well as the strength of the intrinsic ionizing photon field which is responsible for exciting the aforementioned lines. We discuss this in quantitative detail in the next section.
4 HeII Emission Line
The HeII 1640 Å emission line has long been suggested as a direct probe for hot Population III stars at high redshifts due to its high ionization potential of 54.4 eV (e.g. Schaerer 2003). Previous observations of high-redshift galaxies have only provided upper limits on HeII 1640 Å (e.g. Dawson et al. 2007). As illustrated in Figure 4, the composite spectrum of local HAEs shows clear HeII 4686 Å. Moreover, some of the local HAEs (59 out of 305) show HeII 4686 Å emission line over in their individual spectrum even though they are not classified as Wolf-Rayet galaxies by previous studies (e.g., Brinchmann et al. 2008b). We measured the HeII 4686 Å emission line flux for local HAEs, and estimated the HeII 1640 Å line flux using the intensity ratio between different transitions ( to for HeII 4686, and to for HeII 1640) for case B recombination (e.g. Osterbrock & Ferland 2006). We estimated the emission line flux by subtracting the stellar continuum through a simple linear fit and fitting a single Gaussian to the residual emission. Except for the case of the stacked spectrum of the 197 local HAEs which were stacked, we used line flux measurements from SDSS MPA-JHU value-added catalog for H since the measurements take into account the effect of stellar absorption.
Figure 5 shows the ratio between H flux and HeII flux for the individual and stacked HAEs. We divided the 197 local HAEs into two bins of metallicity, based on the bimodal metallicity distribution illustrated in Figure 6. The size of each subsample is roughly the same (). The color-coded filled circles represent the ratio from the stacked spectrum for two subsamples, one at and the other at . Different colors represent different ratios for the conversion from HeII 4686 to HeII . A ratio of HeII 1640/HeII 4686 of 7.42 (, cm-3) is shown in red, 6.79 (, cm-3) in green, 6.56 (, cm-3) in cyan, and 5.90 (, cm-3) in blue (Osterbrock & Ferland 2006). Overplotted are the expected H/HeII ratio from the Starburst99 population synthesis model for a range of stellar initial mass functions and metallicity (Leitherer et al. 1999, Schaerer 2003).
As the different color-coded circles suggest, the observed H/HeII ratios are not highly susceptible to variations in the physical parameters for HII regions such as temperature and/or electron density. A change in temperatures and/or electron density produces only a 50 % change in the H/HeII ratio. The effect of the initial mass function, including the mass range and the faint-end slope, is also limited to a factor of . The observed H/HeII ratio for local HAEs is consistent with the expectation based on the Salpeter IMF with mass range of although the scatter in the points is large enough that a range of IMFs would be consistent with the data as shown by the gray filled region in Figure 5.
The two most dominant factors that result in a wide range of H/HeII ratios are metallicity and star-formation history. As has been discussed in Schaerer (2003), metallicity strongly affects the ratio of Hydrogen to Helium ionizing photons output due to the increase in the effective stellar temperatures with decreasing metallicity. Thus, as metallicity decreases, the stellar population synthesis models result in a higher rate of Hydrogen ionizing photons produced relative to the number of Helium ionizing photons, which translates to an increasing H/HeII ratio. However, due to the short lifetimes of very massive, or hot Wolf-Rayet type stars that are responsible for the Helium ionizing photons, after 5 Myrs from the onset of star-formation, the HeII intensity drops while H still remains elevated due to the existence of late B and A stars. This implies that H/HeII ratio increases at ages longer than 5 Myr relative to ages below 5 Myr.
Local HAEs span a range of metallicities as well as a range of HeII line strengths. The direct detection of HeII in the majority of local HAEs as well as the stacked detection of HeII in the HAEs which do not show HeII in their individual spectra implies that the HAEs harbor a very young stellar population. It is challenging to constrain the age of the stellar population very precisely due to the absence of obvious age indicators such as the 4000 Å break (See Section 5.2). For population synthesis models with continuous star-formation, the H/HeII ratio would be 12. Since 90 % of local HAEs are above that ratio, the implied age of the stellar population in these galaxies must be less than 10 Myr strongly suggestive of local HAEs being powered by short bursts. The morphologies of these galaxies are however ambiguous in seeing-limited ground-based Sloan data. Space based data is required to assess if obvious signs of mergers are present in these objects.
Since we have demonstrated that local HAEs are analogs of HAEs, we can estimate the HeII emission line flux from the H line flux of HAEs, and assess the feasibility of detecting the HeII emission line in the spectra of high-redshift sources. Using the H/HeII ratio of (values measured in the stacked spectrum of low-metallicity local HAEs) and the median H luminosity of erg s-1 (Shim et al. 2011), the HeII line flux of HAEs is expected to be erg s-1 cm-2. This is comparable but slightly lower than the HeII upper limits of Ly emitters at (2 erg s-1 cm-2; Dawson et al. 2007). However, it should be noted that the relationship between Ly emitters and H emitters is currently ambiguous. The H emitters in Shim et al. (2011) are typical spectroscopically confirmed LBGs while the LAEs are preferentially lower mass systems. Therefore to detect the HeII emission line in HAEs, future observations should aim to achieve line flux limits down to erg s-1 cm-2.
5 Properties of Local HAEs: Origins of Strong H Emission
In Shim et al. (2011), we presented several possible reasons for the origin of unusually strong H emission in the HAEs, especially compared to other star-formation tracers such as the UV continuum. The possible factors that drive strong H emission in high-z HAEs are: (1) extinction properties which are different with that of local starbursts (i.e., extinction curve steeper in UV), (2) young stellar population ages and star formation history, (3) low metallicity, and (4) a stellar initial mass function with an overabundance of massive stars. AGN were ruled out as a plausible explanation based on the non-detection of the HAEs in the deep Chandra X-ray data. In the previous section, we had investigated the effect of stellar initial mass function. In this section, we investigate each of these possible scenarios for the origin of strong H emission in local HAEs using the diagnostic properties of SDSS spectroscopy and UV-to-MIR photometry.
5.1 Low Metallicity
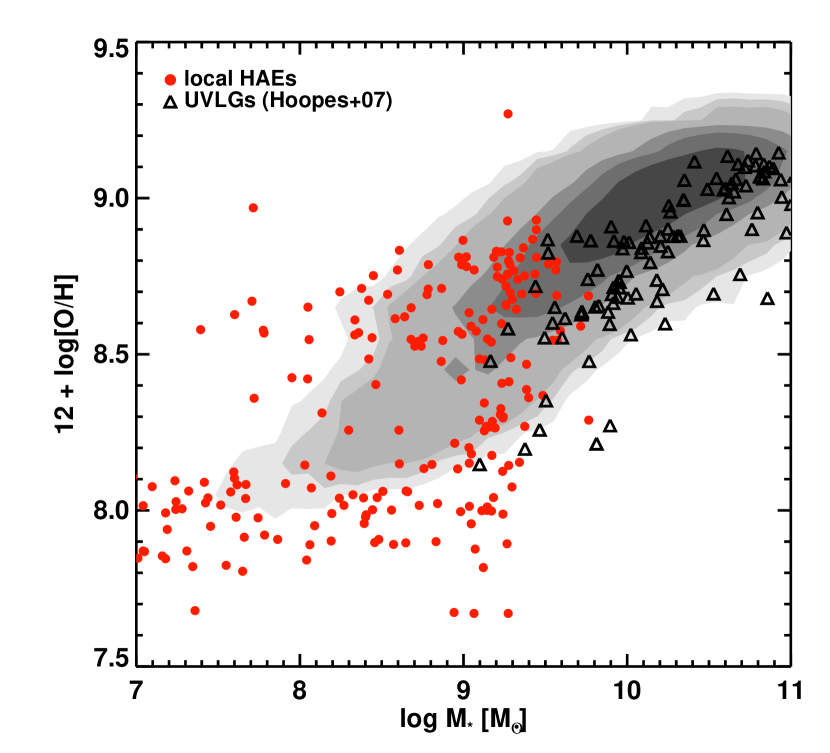
Figure 6 shows gas-phase metallicities () and stellar masses of local HAEs from the MPA-JHU value added catalog for SDSS DR7. The metallicity distribution of local HAEs is clearly bimodal, one peak at and another peak at . Half of the local HAEs are located at the low end of the stellar mass distribution () and the low end of the metallicity distribution (). This is different than the case for UVLGs (Hoopes et al. 2007). Almost all UVLGs are more massive than and have metallicity . The most metal-rich UVLGs are almost super-solar metallicity. The higher metallicity of UVLGs, the higher masses compared to local HAEs and the absence of HeII in the spectra of UVLGs suggests that UVLGs are likely to be at a later stage of their star-formation history compared to HAEs.
The [OIII]/H ratios of local HAEs do not appear to correlate with H equivalent widths with a median line flux ratio of [OIII]/H. Thus it is difficult to assess the connection between the gas-phase metallicity and the H equivalent width. However, there is a clear trend where the lower metallicity systems appear to show a factor of 2 weaker [OIII] line flux corresponding to their H line flux than the highest metallicity systems in the sample.
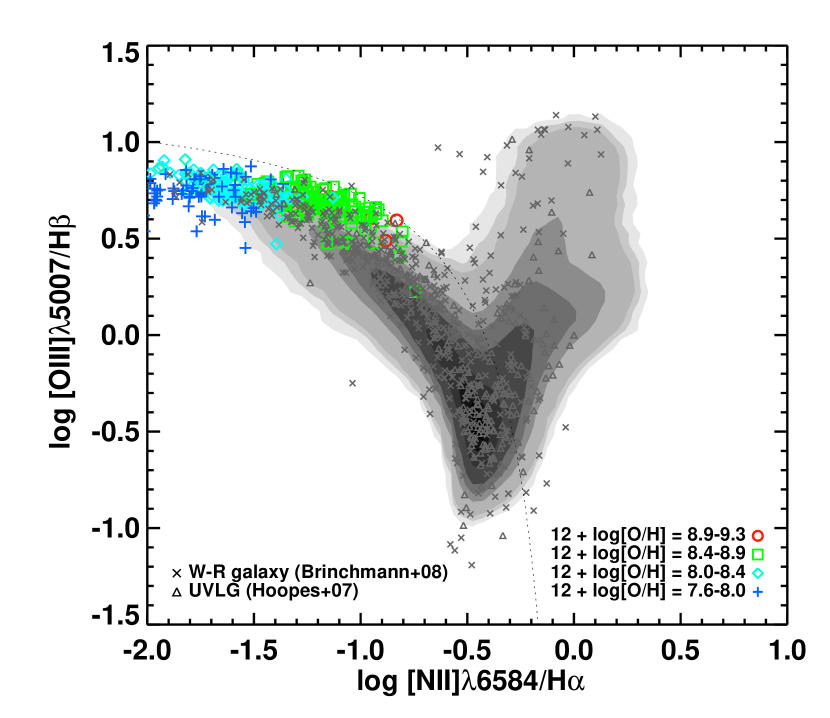
The low metallicity of local HAEs is also reflected in their [NII]6584/H ratios, i.e., local HAEs show weak [NII] emission compared to H. The median value of the observed [NII]6584/H is , far less than the conventional [NII]6584/H for local star-forming galaxies (Gallego 1997). This places local HAEs well to the left of the line that divides starbursts and active galactic nuclei in the BPT diagram (Baldwin et al. 1981; Kauffmann et al. 2003b; Kewley et al. 2001), eliminating the possibility of the strong H emission arising due to the presence of AGN. Figure 7 shows the location of local HAEs in the [OIII]5007/H vs. [NII]6584/H diagram. he location of the local HAE population in the BPT diagram partly depends on the gas-phase metallicity (), i.e., galaxies with lower metallicity show even less [NII]/H ratio than galaxies with higher metallicity (the different symbols of different colors trace the metallicity). Also shown for comparison are the location of Wolf-Rayet galaxies (Brinchmann et al. 2008b) and UVLGs (Hoopes et al. 2007) in the BPT diagram. Significant numbers of either Wolf-Rayet galaxies or UVLGs are classified as AGN-dominated systems, while most of Wolf-Rayet galaxies and/or UVLGs show higher [NII]/H compared to local HAEs. Again as in Figure 6, the BPT diagram suggests that UVLGs, as well as Wolf-Rayet galaxies in general, are on average more evolved than local HAEs.
Another interesting point in Figure 7 is that local HAEs lie at the highest boundary of the entire local galaxy population showing the highest [OIII]/H ratios. It means that there exists a non-negligible offset between the median ridge line of [OIII]/H ratio for local galaxies and that of local HAEs (1.6 in [OIII]/H line flux; Kewley & Dopita 2002). This offset is also reported for star-forming galaxies at (Erb et al. 2006). Brinchmann et al.(2008a) suggest that this offset from the BPT ridge line is closely related to the amount of star formation, it being roughly proportional to the H EW. High-redshift galaxies lying well above the ridge line are producing unusually large amounts of stars compared to their stellar mass, i.e., showing larger specific SFR, and this displacement can be achieved by increasing the ionization parameter (the ratio of the volume densities of ionizing photons and particles). Again, the increase of the ionization parameter depends on the ratio of ionizing photons, electron densities, and the geometry of HII regions which determines whether the HII regions are density-bound or ionization-bound: Brinchmann et al.(2008a) suggest higher electron densities and larger escape fraction of hydrogen ionizing photons as two major reasons for this offset in the BPT diagram. These can be also applicable to local HAEs, considering that local HAEs show a clear displacement in the BPT diagram comparable to other star-forming galaxies. Thus, local HAEs appear to be excellent laboratories for the study of high-z star-forming environments and a measure of the ionizing photon flux from these objects would validate the origin of the unusual [OIII]/H ratios.
5.2 Star Formation History
In Shim et al.(2011), we demonstrated that the most dominant factor that drives the ‘strong H phase’ is the star formation history of high-z star-forming galaxies. The ubiquity of strong H emission and the evolved stellar population ages indicate that star-forming galaxies appear to display continuous star formation histories rather than burst-like star formation. At , the interpretation corroborates a star formation mechanism that is powered by a continuous gas supply such as cold gas accretion from the filaments into massive halos. Short timescale events such as mergers would be stochastic and would suggest a strong H emitting phase for only 10% of the galaxies.
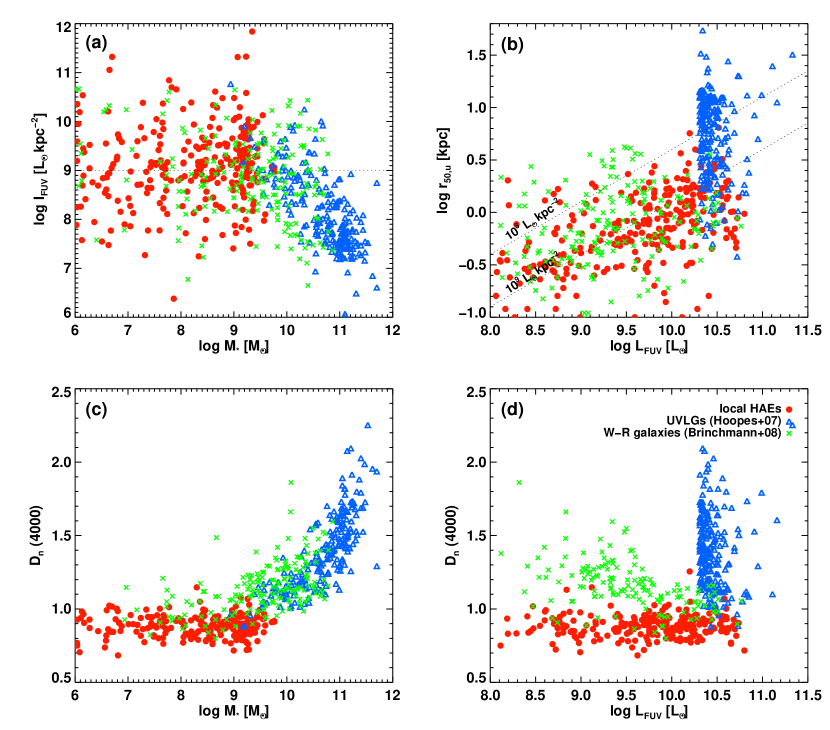
In order to study the ages of the stellar population in local HAEs we compare the strength of the 4000 Å break, , of these galaxies and UVLGs in Figure 8. Local HAEs sample a broad range of stellar masses covering , a broad range of FUV luminosity covering , yet in terms of , local HAEs are a relatively homogeneous population with . There is no correlation between and stellar mass or FUV luminosity. On the other hand, there is a positive correlation between and the stellar mass of UVLGs: older UVLGs appear to be more massive. UVLGs also appear to be in the middle of the range in the -M∗ properties compared to Wolf-Rayet galaxies and HAEs.
Wolf-Rayet galaxies appear to show properties between those of HAEs and UVLGs. The of Wolf-Rayet galaxies is not as homogeneously small as HAEs. Furthermore, Wolf-Rayet galaxies are more massive than HAEs but less massive than UVLGs. Wolf-Rayet galaxies therefore appear to be older than HAEs of the same UV luminosity based on the strength of their 4000Åbreak but are younger than the majority of UVLGs. The composite spectrum of HAEs do show emission lines observed in Wolf-Rayet galaxies, such as Helium recombination lines which suggests some similarity in their ionizing photon field. The consistent FUV luminosity (Figure 8a), galaxy size (Figure 8b), and thus FUV surface brightness between the two also suggests the hypothesis that Wolf-Rayet galaxies and HAEs share similar interstellar medium condition, that enables high ionization parameter – higher electron densities, higher temperature, and a large escape fraction for hydrogen ionizing photons. Since the features arises due to absorption lines from ionized metals, the difference in between two populations suggests the possibility that HAEs are at an earlier lower metallicity stage of evolution than Wolf-Rayet galaxies.
5.3 Dust Obscuration in Local HAEs
In this subsection, we present and compare several different extinction indicators of local HAEs, constrain their extinction properties and thereby their true star-formation rate. We also assess the possible implications for the shape of the differential extinction as a function of wavelength.
5.3.1 Extinction Indicators
The first observable extinction indicator is the UV spectral slope . is derived based on the assumption that the spectrum of star-forming galaxies in the UV wavelength range are well described by a power-law (). We assumed that this power-law approximation is applicable to the rest-frame wavelength range of , covered by the GALEX FUV and NUV bands. Then we converted the color to a spectral slope using the following relation.
| (1) |
and indicate the GALEX magnitudes in the FUV- and NUV-band corrected for Galactic extinction. The low of the local HAEs in the GALEX FUV and NUV bands propagates into the derived . The derived is highly uncertain in most cases; 40 % of all objects have uncertainty higher than in .
The above assumption is accurate for objects with . However, for objects at , the Ly emission line may contaminate the observed flux density in the GALEX FUV band which makes the broadband colors bluer and induces some uncertainty in . For standard Case B recombination, the Ly to H line ratio is a factor of 10. We estimate that in the most extreme case, this would bias the FUV flux blueward by 20% and thereby affect the UV slope by 0.4. We have not applied this correction because we do not know the true strength of the Ly line in these sources and due to the fact that the effect of GALEX photometric uncertainty itself on values is typically larger. Furthermore, the comparison with UVLGs and LBAs is more straightforward since those studies chose not to apply the correction as well.
The next extinction indicator is the flux ratio between Hydrogen recombination lines that traces the different extinction at the wavelengths corresponding to the lines. Here, we present the Balmer line ratio as the extinction indicator. Following Calzetti et al. (2000), the color excess of the nebular gas, , is calculated by comparing the observed Balmer line ratios with the intrinsic (i.e., unobscured) Balmer line ratios.
| (2) |
Here, is the intrinsic line ratio, is the observed line ratio, and is an extinction value at the corresponding wavelength described by the applied extinction curve. Based on the case-B recombination at K (Osterbrock & Ferland 2006), the intrinsic Balmer line ratio is .
Finally, the ratio between IR luminosity and UV luminosity can be used as a third extinction indicator, assuming that the IR luminosity represents the entire unobscured stellar radiation. We derived IR luminosities of local HAEs using the WISE photometry in channel 3 and 4 (12m and 22m respectively). By matching the coordinates of local HAEs to the WISE preliminary data release catalog (Wright et al. 2010), we found 65 objects with robust counterparts at a flux density level higher than 0.28 mJy at 12 m and 1.9 mJy at 22 m. These objects do not have nearby neighbors within that could possibly contaminate the MIR flux density. We used IR spectral energy distribution templates of IR galaxies with different IR luminosities (Chary & Pope 2010): each IR luminosity template was redshifted to the corresponding redshift of the object and the template that best explains the observed 12 m and 22 m flux density was determined, while the IR luminosity of the object was derived to be the IR luminosity associated with the best-fit template. IR luminosity of local HAEs ranges between and . We compared with , i.e., at 1530 Å as defined in the previous section, and used as an extinction indicator.
The results for dust extinction using these three techniques is described in the next section.
5.3.2 Extinction Curve Difference in UV-wavelengths
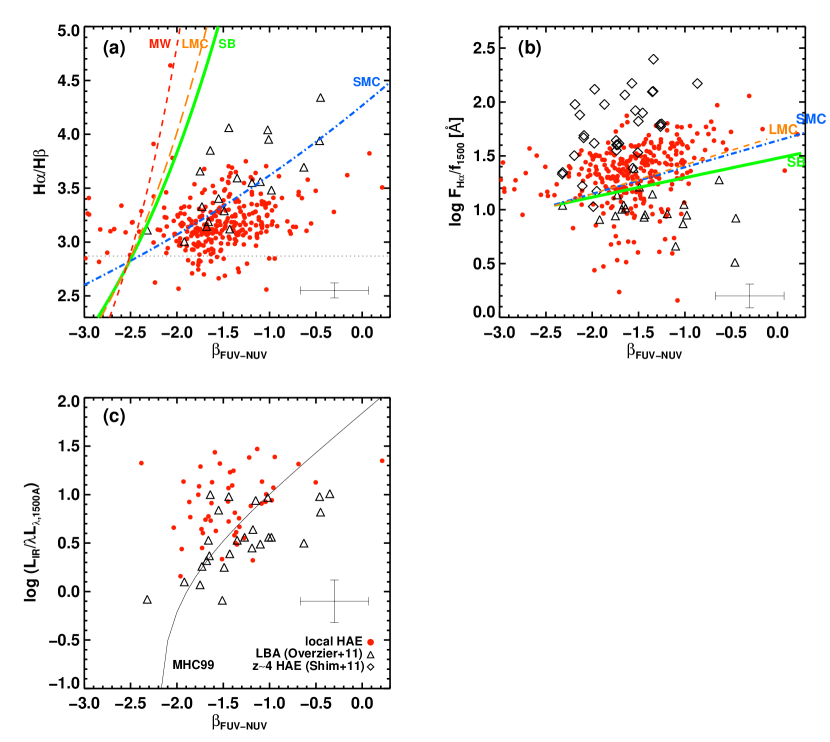
Figure 9 illustrates the comparison between the three extinction indicators for local HAEs and LBAs. Figure 9a shows that there exists a positive correlation between UV slope and , which is naturally expected from the fact that both quantities are providing independent measures of obscuration. However, the relationship between UV slope and for local HAEs and LBAs are different, i.e., for the same , the flux ratio is higher for LBAs than the case of HAEs. One possibility is that the ISM temperature in LBAs and HAEs is different, with the latter having higher gas temperatures which affects the recombination rate by a factor of 1.3. This would be consistent with the higher ultraviolet surface density seen in the HAEs compared to LBAs.
The alternate interpretation is this is a result of dust extinction. For a fixed , LBAs show larger dust extinction than HAEs, which implies that the UV dust extinction curve is steeper in HAEs than in LBAs. This is more consistent with the extinction curve seen in the Small Magellanic Cloud (SMC) which due to its low metallicity is thought to have an overabundance of large grains relative to small grains (Weingartner & Draine 2001).
This possible difference in the shape of the dust extinction curve especially in the UV wavelength range has already been suggested in the study of HAEs (Shim et al. 2011). Figure 9b shows the relationship between H line-to-UV continuum ratio and UV slope for local HAEs, in comparison with their high-redshift counterparts ( HAEs) and LBAs. For comparison, the figure also shows three lines indicating the starburst extinction law (Calzetti 2000), LMC extinction law (Fitzpatrick 1986), and SMC extinction law (Prevot 1984). The extinction laws that have a steeper curve at UV wavelengths (LMC, SMC) show higher H-to-UV ratio compared to less steep extinction law (SB). The -intercepts in these model lines depend on the assumed star formation history and the stellar population age of the galaxy while only the slope of the lines depend on the extinction law (See Shim et al. 2011). Higher-redshift HAEs have higher H-to-UV ratio than local counterparts, implying that these are closer to continuously star-forming galaxies. Despite the -intercept difference, HAEs at different redshifts show slopes in the H-UV ratio vs. relation which are consistent despite the large scatter. On the other hand, LBAs appear to have a slope that is completely different in the H-UV ratio vs. plane indicating that not only do they have distinct extinction properties to HAEs but also different star-formation histories.
Finally in Figures 9c, we present the IR-to-UV luminosity ratio for local HAEs. Since HAEs appear to be young galaxies while LBAs are relatively evolved galaxies, the IR-to-UV ratio of LBAs are expected to be smaller than that of HAEs since the fraction of stellar radiation that is absorbed by dust and re-radiated in the IR decreases as the galaxy evolves. The observed relation between the IR-to-UV ratio and UV spectral slope for local HAEs lie above the expected line for local star-forming galaxies (Meurer et al. 1999) or that of LBAs, confirming the idea that young HAEs have stronger intrinsic UV radiation fields and thereby emit more strongly in the IR. Still, the uncertainties related to the derivation of and is large. The addition of far-infrared continuum flux is needed to reduce the uncertainties in . To constrain the extinction curve shape in UV wavelengths in more detail, the accuracy in should also be improved with higher precision UV spectrophotometry which disentangles the contribution of the Ly- line to the broadband photometry.
6 Summary
In this paper, we have studied the extremely rare, local analogs of star-forming galaxies from SDSS DR7. It has recently been demonstrated in Shim et al. (2011) that 70 % of galaxies have strong H equivalent widths and are H emitters (HAEs). Therefore, unlike previous studies which selected local analogs based solely on their UV properties, we used the criterion H EW to select among the local galaxy population. At , the number fraction of such strong HAEs is only 0.04 %. Local HAEs are less luminous by an order of magnitude in both H and UV luminosities compared to HAEs. However, the H-to-UV luminosity ratio as well as the specific star-formation rates of local HAEs are very similar to those of high redshift HAEs. This supports the argument that local HAEs are scaled down versions of star-forming galaxies.
In contrast, previously studied UV-selected local analogs of high-redshift Lyman-break galaxies, the Lyman-break analogs, are distinct in their physical properties from HAEs at any redshift. The UV-selected analogs show a factor of 5 lower H EW, higher metallicity and higher stellar mass than the HAEs. At least 50 % of local HAEs show comparably high FUV surface brightness as that of Lyman break galaxies and Lyman break analogs. However, the FUV surface brightness does not appear to depend on H EW. Unlike the Lyman break analogs, the composite spectrum of local HAEs shows strong, but narrow Helium lines that are observed in Wolf-Rayet galaxies, raising the possibility that the properties of the star forming environment in local HAEs overlap with those of Wolf-Rayet galaxies.
As in the case of HAEs, the strong H emission in local HAEs can be attributed to a young stellar population with a large number of massive stars. 50% of local HAEs show low metallicity of , close to which is less than that of the UV-selected Lyman break analogs. This is consistent with the fact that HAEs are less massive by at least an order of magnitude than the Lyman break analogs. The low metallicities are also reflected in their low observed [NII]/H ratio. The low [NII]/H ratio, as well as high [OIII]/H ratio, indicate that local HAEs are not contaminated by AGN-dominated systems. Moreover, the strong [OIII] emission that displaces local HAEs from the ridge line of BPT diagram can be explained by a high ionization parameter, which requires either higher electron densities and/or large escape fraction of hydrogen ionizing photons. If the large escape fraction is demonstrated through observational data, HAEs could be the clue to understanding the reionization of the intergalactic medium at high redshift.
Most HAEs are unusually young with . This is one of the largest differences between the properties of HAEs and Wolf-Rayet galaxies; the latter predominantly showing suggesting a more evolved stellar population. Due to their small , it is therefore difficult to constrain whether local HAEs follow a continuous star formation history or burst-like star formation history. The extinction indicator H/H of local HAEs suggests that HAEs display an extinction curve steeper than normal star-forming galaxies and more similar to that of the Small Magellanic Cloud. The origin of this difference in extinction curve is not clear with the most likely reason being the lower metallicities in these galaxies.
References
- Allen (1976) Allen, D. A. 1976, MNRAS, 174, 29
- Atek et al. (2011) Atek, H. et al. ApJ, 743, 121
- Baldwin et al. (1981) Baldwin, J. A., Phillips, M. M., & Terlevich, R. 1981, PASP, 93, 5
- Basu-Zych et al. (2007) Basu-Zych, A. R. et al. 2007, ApJS, 173, 457
- Brinchmann et al. (2004) Brinchmann, J. et al. 2004, MNRAS, 351, 1151
- Brinchmann et al. (2008) Brinchmann, J., Pettini, M., & Charlot, S. 2008, MNRAS, 385, 769
- Bruzual & Charlot (2003) Bruzual, G. & Charlot, S. 2003, MNRAS, 344, 1000
- Calzetti (2000) Calzetti, D., Armus, L., Bohlin, R. C., Kinney, A. L., Koornneef, J., Storchi-Bergmann, T. 2000, ApJ, 533, 682
- Capak et al. (2011) Capak, P. et al. 2011, ApJ, 730, 68
- Charlot & Longhetti (2001) Charlot, S. & Loghetti, M. 2001, MNRAS, 323, 887
- Chary et al. (2005) Chary, R.-R. 2005, Stern, D., Eisenhardt, P. 2005, ApJL, 635, 5
- Chary & Pope (2010) Chary, R.-R., & Pope, A. 2010 (arXiv:1003.1731)
- Coppin et al. (2009) Coppin, K. E. K., 2009, MNRAS, 395, 1905
- Daddi et al. (2007) Daddi, E. et al. 2007, ApJ, 670, 156
- Daddi et al. (2009) Daddi, E. et al. 2009, ApJ, 694, 1517
- Dawson et al. (2007) Dawson, S., et al., 2007, 671, 1227
- Dekel et al. (2009) Dekel, A. et al. 2009, Nature, 457, 451
- Elbaz et al. (2007) Elbaz, D. et al. 2007, A&A, 468, 33
- Erb et al. (2006) Erb, D. K., Steidel, C. C., Shapley, A. E., Pettini, M., Reddy, N. A., & Adelberger, K. L. 2006, ApJ, 647, 128
- Fitzpatrick (1986) Fitzpatrick, E. L. 1986, AJ, 92, 1068
- Gallego et al. (1997) Gallego, J., Zamorano, J., Rego, M., & Vitores, A. G. 1997, ApJ, 475, 502
- Heckman et al. (2005) Heckman, T. M. et al. 2005, ApJL, 619, 35
- Hoopes et al. (2007) Hoopes, C. G. et al. 2007, ApJS, 173, 441
- Kauffmann et al. (2003) Kauffmann, G. et al. 2003, MNRAS, 341, 33
- Kauffmann et al. (2003) Kauffmann, G. et al. 2003, MNRAS, 346, 1055
- Kennicutt (1998) Kennicutt, R. C. 1998, ARA&A, 36, 189
- Kewley et al. (2001) Kewley, L. J., Heisler, C. A., & Dopita, M. A. 2001, ApJS, 132
- Kewley & Dopita (2002) Kewley, L. J. & Dopita, M. A., 2002, ApJS, 142, 35
- Leitherer et al. (1999) Leitherer, C., et al., 1999, ApJS, 123, 3
- Meurer, Heckman, & Calzetti (1999) Meurer, G. R., Heckman, T. M., & Calzetti, D. 1999, ApJ, 521, 64
- Noeske et al. (2007) Noeske, K. G. et al. 2007, ApJL, 660, 47
- Osterbrock & Ferland (2006) Osterbrock, D. & Ferland, G. 2006, Astrophysics of Gaseous Nebulae and Active Galactic Nuclei , 2nd. e.d., University Science Books
- Overzier et al. (2008) Overzier, R. A. et al. 2008, ApJ, 677, 37
- Overzier et al. (2009) Overzier, R. A. et al. 2009, ApJ, 706, 203
- Overzier et al. (2010) Overzier, R. A. et al. 2010, ApJ, 710, 979
- Overzier et al. (2011) Overzier, R. A. et al. 2011, ApJL, 726, 7
- Prévot et al. (1984) Prévot, M. L., Lequeux, J., Prévot, L., Maurice, E., & Rocca-Volmerange, B. 1984, A&A, 132, 389
- Ravindranath et al. (2006) Ravindranath, S. et al. 2006, ApJ, 652, 963
- Reddy et al. (2010) Reddy, N. A., Erb, D. K., Pettini, M., Steidel, C. C., & Shapley, A. E. 2010, ApJ, 712, 1070
- Salim et al. (2007) Salim, S. et al. 2007, ApJS, 173, 267
- Schlegel et al. (1998) Schlegel, D. J., Finkbeiner, D. P., & Davis, M. 1998, ApJ, 500, 525
- Schaerer et al (2003) Schaerer, D. 2003, A&A, 397, 527
- Schaerer & de Barros (2009) Schaerer, D. & de Barros, S. 2009, A&A, 502, 423
- Schinnerer et al. (2008) Schinnerer, E. et al. 2008, ApJL, 689, 5
- Shim et al. (2011) Shim, H. et al. 2011, ApJ, 738, 69
- Shirazi & Brinchmann (2012) Shirazi, M. & Brinchmann, J. 2012, MNRAS, 421, 1043
- Tremonti et al. (2004) Tremonti, C. A. et al. 2004, ApJ, 613, 898
- Thaun & Izotov (2005) Thuan, T. X., & Izotov, Y. I. 2005, ApJS, 161, 240
- Weingartner & Draine (2001) Weingartner, J. C. & Draine, B. T. 2001, ApJ, 548, 296
- Wright et al. (2010) Wright, E. L. 2010, AJ, 140, 1868
- Zackrisson et al. (2008) Zackrisson, E., Bergvall, N., & Leitet, E. 2008, ApJL, 676, 9
- Zhang et al. (2007) Zhang, W., Kong, X., Li, C., Zhou, H.-Y., Cheng, F.-Z. 2007, ApJ, 655, 851
| SDSS ID | R.A. | Decl. | redshift | H EW | log | log SFR | log | 12log[O/H] | |||
|---|---|---|---|---|---|---|---|---|---|---|---|
| 587727179525783616 | 5.915092 | -9.813522 | 0.053035 | 667.5 | 4001.6 | 8.447 | 0.481 | 8.608 | 8.149 | 0.8980 | |
| 588015507661455435 | 6.104308 | -1.066375 | 0.039368 | 611.7 | 1085.2 | 8.784 | -0.610 | 8.007 | 0.9120 | ||
| 588015507661979813 | 7.409042 | -1.204444 | 0.164415 | 752.8 | 865.7 | 9.116 | 0.675 | 8.155 | 0.8390 | ||
| 588015508199506053 | 8.835831 | -0.746512 | 0.249825 | 503.4 | 773.8 | 8.819 | 0.920 | 8.255 | 0.9190 | ||
| 587740588411519244 | 9.582756 | 25.219419 | 0.311599 | 657.4 | 597.0 | 8.841 | 1.073 | 9.278 | 8.412 | 0.9694 | |
| 587724199349387411 | 10.226349 | 15.569384 | 0.283232 | 636.7 | 478.4 | 8.939 | 0.873 | 9.240 | 0.8826 | ||
| 587724234248552589 | 10.653869 | 16.034079 | 0.247397 | 844.6 | 995.4 | 11.839 | 1.668 | 9.346 | 8.809 | 0.8554 | |
| 587731186746196208 | 12.307815 | 0.400554 | 0.159282 | 896.6 | 580.6 | 9.116 | 0.256 | 8.942 | 7.673 | 0.7662 | |
| 587731514215366775 | 16.450899 | 1.080542 | 0.329321 | 574.2 | 273.3 | 7.890 | 0.851 | 8.751 | 1.2555 | ||
| 587727180069142712 | 21.047823 | -9.002034 | 0.229820 | 913.6 | 489.1 | 11.317 | 0.942 | 9.071 | 7.876 | 0.9508 | |
| 587724232106508428 | 23.469007 | 13.702609 | 0.008670 | 1330.2 | 3342.0 | -1.394 | 6.598 | 7.672 | 0.0000 | WR | |
| 588015507669188698 | 23.856556 | -1.230119 | 0.177349 | 564.5 | 1235.2 | 8.980 | 1.068 | 9.289 | 8.489 | 1.0286 | |
| 588015508206190774 | 24.127474 | -0.632222 | 0.059468 | 505.1 | 972.5 | 8.868 | -0.407 | 8.127 | 0.9764 | ||
| 587724232644820997 | 26.779322 | 13.941470 | 0.056623 | 684.3 | 3158.3 | 8.780 | 0.548 | 8.420 | 8.673 | 0.8630 | |
| 587731512610127975 | 28.668512 | -0.112153 | 0.018708 | 664.7 | 823.0 | 8.657 | -1.221 | 8.775 | 0.0000 | ||
| 587731512610455795 | 29.539122 | -0.110334 | 0.012072 | 817.4 | 2152.9 | 8.856 | -1.412 | 7.933 | 0.0000 | ||
| 587727779743596668 | 34.720455 | -9.205221 | 0.012708 | 686.3 | 2136.4 | 8.276 | -0.962 | 7.042 | 8.015 | 0.0000 | |
| 587727178464624784 | 35.156929 | -9.485357 | 0.113164 | 597.2 | 1955.8 | 9.439 | 0.525 | 9.272 | 9.270 | 0.8954 | |
| 587731514224279696 | 36.810349 | 1.093360 | 0.348540 | 1293.5 | 856.1 | 9.226 | 1.667 | 8.836 | 1.0014 | ||
| 587727177929588906 | 39.490982 | -9.525620 | 0.280223 | 667.9 | 509.4 | 11.326 | 0.906 | 9.230 | 0.7763 | ||
| 587727179003723785 | 40.217499 | -8.474285 | 0.082176 | 1795.5 | 4386.1 | 9.736 | 0.816 | 8.457 | 7.897 | 0.6837 | |
| 588015509824208968 | 40.995934 | 0.556302 | 0.059319 | 708.7 | 1001.1 | -0.432 | 8.038 | 0.8369 | |||
| 587731514226442382 | 41.761272 | 1.258160 | 0.128720 | 844.0 | 1875.2 | 9.219 | 1.063 | 9.034 | 8.633 | 0.8386 | |
| 587727180078907412 | 43.444599 | -7.395548 | 0.004494 | 789.9 | 3784.6 | 9.951 | -2.010 | 6.062 | 7.953 | 0.0000 | |
| 587731511543726169 | 45.454273 | -0.882610 | 0.007318 | 758.9 | 1641.3 | 8.225 | -1.998 | 7.677 | 0.0000 | ||
| 587727179006148758 | 45.839211 | -7.989777 | 0.164813 | 589.8 | 1817.3 | 9.327 | 0.838 | 9.121 | 7.817 | 0.8422 | |
| 587731514228474146 | 46.413918 | 1.189721 | 0.167591 | 859.9 | 453.8 | 8.129 | 0.281 | 8.045 | 0.9596 | ||
| 588015509290483920 | 48.250191 | 0.103361 | 0.029164 | 577.7 | 1161.1 | 9.365 | -1.023 | 7.895 | 0.8494 | ||
| 587744294975242477 | 48.357658 | 5.751317 | 0.195068 | 1259.5 | 993.4 | 8.972 | 1.493 | 9.035 | 8.151 | 0.9959 | |
| 587731512082170019 | 49.026310 | -0.438349 | 0.022894 | 563.0 | 1971.2 | 11.054 | -1.208 | 6.650 | 8.048 | 0.8465 | |
| 588015509290877040 | 49.099861 | 0.153407 | 0.202564 | 854.8 | 1144.3 | 9.785 | 0.882 | 9.236 | 0.7714 | ||
| 587724241767825591 | 51.556793 | -6.586821 | 0.162033 | 638.1 | 1742.2 | 9.699 | 1.417 | 9.206 | 8.749 | 0.8595 | |
| 588015510365929716 | 52.101753 | 0.909903 | 0.276351 | 831.5 | 816.3 | 8.693 | 1.467 | 8.692 | 0.9247 | ||
| 587731513157746887 | 53.330040 | 0.292035 | 0.193820 | 623.2 | 1025.7 | 9.241 | 0.937 | 8.364 | 0.9329 | ||
| 587731514232275127 | 55.082912 | 1.058530 | 0.321582 | 530.0 | 314.4 | 11.201 | 0.889 | 8.710 | 1.1827 | ||
| 587731511549427842 | 58.572277 | -0.913758 | 0.025706 | 602.7 | 2305.9 | 9.212 | -0.580 | 7.895 | 1.1308 | ||
| 587727179550294225 | 62.406769 | -5.301616 | 0.074775 | 599.3 | 1696.9 | 9.217 | 0.212 | 8.472 | 8.041 | 0.8772 | |
| 758882136838308201 | 88.771126 | 83.197517 | 0.057179 | 514.5 | 1076.3 | -0.446 | 7.393 | 8.579 | 0.9396 | ||
| 587725774528643229 | 113.236320 | 37.080456 | 0.139556 | 524.9 | 2160.2 | 9.060 | 1.242 | 9.764 | 8.687 | 0.9179 | |
| 587732054308094381 | 115.144371 | 24.693533 | 0.192887 | 564.0 | 1626.4 | 1.122 | 9.385 | 8.387 | 0.9499 | ||
| 587732152555864324 | 116.991676 | 23.609142 | 0.155223 | 548.9 | 894.7 | 0.480 | 9.239 | 8.125 | 0.8992 | ||
| 588016841241395565 | 117.026268 | 19.529713 | 0.062913 | 765.3 | 3074.9 | 9.269 | 0.469 | 8.640 | 8.620 | 0.9471 | |
| 587731887343141089 | 117.146057 | 31.510386 | 0.027381 | 642.6 | 4367.5 | 8.270 | -0.047 | 8.030 | 8.145 | 0.9204 | |
| 587731681185038501 | 118.126228 | 30.268797 | 0.104871 | 528.0 | 1131.6 | 9.115 | 0.471 | 9.145 | 8.011 | 0.9481 | |
| 588297865245360528 | 119.660004 | 25.432913 | 0.161057 | 533.9 | 2565.8 | 1.370 | 9.519 | 8.789 | 1.0312 | ||
| 588007005769892050 | 120.446251 | 43.883945 | 0.084337 | 530.2 | 1589.3 | 9.124 | 0.337 | 8.968 | 8.573 | 0.9658 | |
| 587731885734625538 | 121.991661 | 34.244244 | 0.022444 | 1279.5 | 1851.5 | 8.252 | -0.946 | 6.787 | 7.905 | 0.7507 | |
| 587738947196944678 | 123.966682 | 21.939903 | 0.140995 | 852.4 | 1124.3 | 9.202 | 0.611 | 9.047 | 7.957 | 0.7882 | |
| 587732577221083492 | 125.895187 | 3.221021 | 0.009771 | 1355.1 | 16856.7 | 10.612 | -0.518 | 6.810 | 8.128 | 0.0000 | |
| 587735241709322314 | 125.979027 | 28.106043 | 0.047222 | 505.5 | 12206.2 | 10.336 | 1.474 | 8.608 | 8.833 | 0.9276 | WR |
| 587725980151513279 | 126.377838 | 50.801239 | 0.096858 | 556.0 | 2543.5 | 9.488 | 0.623 | 8.864 | 8.477 | 0.8790 | WR |
| 587741421636092149 | 126.418541 | 18.771444 | 0.037959 | 1283.9 | 2072.9 | 9.051 | -0.218 | 7.345 | 7.820 | 0.8439 | |
| 587731679041290347 | 126.481354 | 35.542213 | 0.002496 | 1441.0 | 6282.5 | 8.842 | -1.995 | 6.040 | 7.670 | 0.0000 | |
| 587739114701652062 | 127.664062 | 22.250998 | 0.016886 | 538.6 | 5476.6 | 8.798 | -0.304 | 7.951 | 8.425 | 0.9368 | |
| 588010137337200805 | 128.666870 | 48.094685 | 0.342574 | 890.6 | 929.5 | 9.218 | 2.055 | 8.782 | 0.8600 | ||
| 587731680116867174 | 129.681839 | 38.897362 | 0.147461 | 620.0 | 4561.8 | 9.638 | 1.353 | 9.573 | 8.545 | 0.9363 | WR |
| 587741489819025453 | 130.001556 | 18.091948 | 0.072188 | 824.2 | 2345.0 | 9.939 | 0.777 | 8.244 | 8.700 | 0.8078 | |
| 587742010046808228 | 130.142105 | 13.747596 | 0.226933 | 769.8 | 948.2 | 9.105 | 1.551 | 9.275 | 8.799 | 0.8952 | |
| 587745403070710009 | 130.652435 | 10.553878 | 0.010318 | 605.1 | 2504.7 | 8.219 | -1.191 | 7.010 | 7.847 | 0.0000 | |
| 588010358527951007 | 131.059311 | 2.439195 | 0.091093 | 560.0 | 4591.0 | 1.594 | 9.201 | 8.830 | 0.9673 | WR | |
| 587725471207260238 | 131.365067 | 53.148048 | 0.031071 | 631.5 | 5260.2 | 8.594 | 0.001 | 8.135 | 8.312 | 0.8630 | WR |
| 587745539973382205 | 132.484436 | 10.719072 | 0.014143 | 506.8 | 7399.6 | 8.527 | -0.461 | 7.668 | 8.038 | 0.0000 | |
| 587737809037558040 | 132.815216 | 58.681950 | 0.091864 | 1384.0 | 3337.6 | 9.046 | 0.817 | 8.647 | 7.896 | 0.7205 | |
| 587745243620638850 | 133.090485 | 12.281044 | 0.075924 | 812.3 | 9556.6 | 9.418 | 0.983 | 8.986 | 8.418 | 0.8125 | |
| 587741532770074773 | 133.350372 | 19.506294 | 0.236503 | 564.4 | 629.5 | 0.819 | 9.173 | 8.176 | 0.8873 | ||
| 587726031692103963 | 135.277344 | 0.905037 | 0.110702 | 507.4 | 1617.7 | 9.512 | 0.625 | 9.176 | 8.285 | 0.9508 | WR |
| 587741421103611996 | 136.278595 | 22.642759 | 0.125548 | 500.3 | 1916.9 | 9.417 | 0.700 | 9.097 | 8.289 | 0.8951 | |
| 587731681193754681 | 136.367004 | 44.182873 | 0.065364 | 568.5 | 3355.1 | 9.069 | 0.546 | 8.702 | 8.526 | 0.8958 | |
| 588010359604052117 | 136.379486 | 3.591771 | 0.039088 | 591.5 | 2267.1 | 8.865 | -0.064 | 8.061 | 7.890 | 0.8622 | WR |
| 587732048406249534 | 136.618698 | 44.981819 | 0.074672 | 566.1 | 2915.6 | 8.884 | 0.888 | 8.777 | 8.691 | 0.9416 | |
| 587734622171889671 | 138.037277 | 36.373997 | 0.165166 | 559.4 | 1500.0 | 9.169 | 1.119 | 9.231 | 8.828 | 0.8944 | |
| 587732049481039908 | 138.645645 | 47.035343 | 0.027269 | 569.9 | 8656.9 | 9.150 | 0.157 | 8.269 | 8.016 | 0.8824 | |
| 587741817314738195 | 139.170761 | 18.468864 | 0.021771 | 534.0 | 2973.1 | 9.026 | -0.595 | 7.438 | 8.040 | 0.8853 | |
| 587745243087372534 | 141.384872 | 14.053627 | 0.301211 | 533.1 | 659.8 | 9.364 | 1.192 | 9.164 | 8.267 | 0.8964 | |
| 588013384341913605 | 141.501694 | 44.460049 | 0.180667 | 578.0 | 1770.6 | 9.861 | 1.063 | 9.129 | 8.482 | 0.8847 | |
| 587742014876745993 | 141.869492 | 17.671837 | 0.288328 | 509.3 | 578.0 | 9.063 | 1.032 | 9.225 | 8.307 | 0.9100 | |
| 587734622173462551 | 142.026337 | 38.132477 | 0.060717 | 739.6 | 5650.9 | 8.841 | 0.723 | 8.723 | 8.541 | 0.8537 | WR |
| 587725075530317872 | 142.326645 | 0.470347 | 0.093874 | 888.4 | 1866.7 | 9.511 | 0.444 | 8.560 | 8.001 | 0.7983 | |
| 587725817478840384 | 142.526810 | 60.448166 | 0.013659 | 587.4 | 8243.8 | 9.591 | -0.750 | 7.320 | 8.062 | 0.0000 | WR |
| 587739114708402325 | 142.907227 | 29.333946 | 0.330326 | 641.7 | 720.0 | 9.944 | 1.885 | 8.848 | 1.0686 | ||
| 588010136268505157 | 143.509933 | 55.239777 | 0.002565 | 894.8 | 5601.8 | 9.437 | -1.149 | 6.041 | 7.670 | 0.0000 | |
| 587734621637247125 | 143.911865 | 38.631794 | 0.137483 | 650.1 | 1823.5 | 8.848 | 1.082 | 9.260 | 8.656 | 0.8719 | WR |
| 587735343188934969 | 144.097046 | 9.000285 | 0.223567 | 672.6 | 923.0 | 8.907 | 1.590 | 9.237 | 8.741 | 0.8825 | |
| 587741392646504460 | 144.213989 | 26.717690 | 0.294546 | 510.1 | 933.1 | 9.652 | 1.246 | 9.385 | 8.468 | 0.9041 | |
| 588017979952922757 | 145.726135 | 34.069969 | 0.022487 | 795.7 | 1233.7 | 8.691 | -1.102 | 6.833 | 7.836 | 0.8487 | |
| 587725073921278043 | 146.007797 | -0.642272 | 0.004810 | 1534.4 | 21890.4 | 8.757 | -1.049 | 6.690 | 7.867 | 0.0000 | |
| 587734623786238071 | 146.826477 | 41.637905 | 0.004658 | 870.0 | 3060.5 | 7.680 | -1.791 | 6.435 | 7.909 | 0.0000 | |
| 588848900972216400 | 147.597183 | 0.708133 | 0.097702 | 552.3 | 3004.3 | 10.388 | 1.087 | 8.785 | 8.787 | 0.8468 | |
| 587728930273493055 | 147.882355 | 52.993347 | 0.046263 | 951.8 | 5236.0 | 0.288 | 8.195 | 7.990 | 0.8205 | ||
| 587727944033108132 | 148.112335 | 2.299958 | 0.119123 | 511.9 | 3007.5 | 1.274 | 9.307 | 8.768 | 0.9354 | WR | |
| 587732152033345685 | 149.076309 | 43.124393 | 0.275709 | 538.1 | 982.0 | 13.432 | 1.674 | 9.280 | 8.826 | 0.9439 | |
| 587742062133117119 | 151.835388 | 19.563786 | 0.031410 | 579.3 | 1430.3 | 8.933 | -0.657 | 7.454 | 7.949 | 0.8696 | |
| 587728309631975445 | 151.943817 | 2.874571 | 0.023492 | 580.8 | 4678.0 | 9.180 | -0.347 | 7.596 | 8.123 | 0.9071 | WR |
| 587741817320505351 | 152.636688 | 22.011009 | 0.004226 | 1038.6 | 9742.0 | 9.281 | -1.563 | 6.525 | 7.928 | 0.0000 | WR |
| 587735348561444896 | 152.677261 | 12.921337 | 0.061313 | 574.1 | 7544.8 | 0.733 | 8.679 | 8.548 | 0.8578 | WR | |
| 587745541055971461 | 152.747086 | 15.706535 | 0.055632 | 802.3 | 5601.7 | 9.488 | 0.479 | 8.393 | 7.958 | 0.8323 | |
| 587738410863493299 | 152.987869 | 13.139479 | 0.143776 | 1395.2 | 2139.5 | 0.808 | 9.241 | 7.988 | 0.6890 | ||
| 587738409789751347 | 153.112595 | 12.343749 | 0.009565 | 807.2 | 8293.9 | -0.814 | 7.236 | 8.095 | 0.0000 | WR | |
| 587742061597032613 | 153.744339 | 19.538765 | 0.012629 | 615.4 | 1542.3 | -1.409 | 6.536 | 7.852 | 0.0000 | ||
| 587739376706387983 | 153.859955 | 30.914406 | 0.091751 | 537.9 | 2986.5 | 9.991 | 1.065 | 9.017 | 8.812 | 0.9525 | |
| 587735661550698508 | 154.102158 | 37.912769 | 0.003879 | 597.0 | 10978.4 | 9.210 | -1.462 | 6.582 | 7.675 | 0.0000 | WR |
| 587734861609566213 | 154.124542 | 7.568038 | 0.182909 | 575.6 | 1859.0 | 9.148 | 1.554 | 9.443 | 8.695 | 0.9242 | |
| 588017605211390138 | 154.513519 | 41.105858 | 0.237018 | 679.0 | 721.2 | 9.306 | 1.142 | 9.173 | 8.644 | 0.7943 | |
| 587733081878888643 | 154.731064 | 51.924393 | 0.129398 | 520.0 | 2320.1 | 8.893 | 1.003 | 9.342 | 8.154 | 0.9644 | |
| 587728881414897699 | 156.121887 | 5.414172 | 0.033191 | 525.6 | 6362.6 | 9.174 | 0.046 | 8.191 | 7.902 | 0.8815 | |
| 587732578845786234 | 157.912231 | 7.265705 | 0.252536 | 568.7 | 446.5 | 0.675 | 8.946 | 8.215 | 0.9299 | ||
| 587741490367889543 | 158.112335 | 27.298689 | 0.192490 | 626.1 | 1302.3 | 9.891 | 1.233 | 9.286 | 8.697 | 0.9132 | |
| 587732134842531847 | 160.176544 | 49.206581 | 0.005011 | 1454.6 | 7045.5 | 7.843 | -1.505 | 6.329 | 8.030 | 0.0000 | WR |
| 587742014884544559 | 160.289993 | 21.361889 | 0.003976 | 599.2 | 13890.7 | 9.532 | -1.273 | 6.766 | 7.962 | 0.0000 | |
| 588017979421622307 | 160.668793 | 37.917389 | 0.166793 | 612.9 | 2133.4 | 1.521 | 9.373 | 8.751 | 0.9133 | ||
| 587728879269642285 | 161.240799 | 3.886987 | 0.012873 | 1464.5 | 10315.3 | 10.044 | -0.846 | 6.796 | 7.870 | 0.0000 | |
| 587734863223324735 | 161.335083 | 9.396972 | 0.054873 | 600.2 | 6184.5 | 8.380 | 0.897 | 8.873 | 8.544 | 0.9856 | WR |
| 588848901515182119 | 161.478241 | 1.068288 | 0.026199 | 890.7 | 11053.6 | 9.170 | 0.119 | 8.056 | 8.547 | 0.7903 | WR |
| 587738410330357781 | 161.724945 | 13.779382 | 0.010610 | 916.4 | 4409.3 | 8.882 | -1.153 | 6.806 | 8.042 | 0.0000 | |
| 587742863668412459 | 162.635483 | 15.635085 | 0.084427 | 1045.3 | 5962.5 | 9.416 | 0.894 | 8.649 | 8.062 | 0.8002 | |
| 587739096444698642 | 162.670166 | 34.496483 | 0.052196 | 560.4 | 3332.6 | 9.077 | 0.245 | 8.324 | 8.050 | 0.9103 | |
| 588017705070886933 | 163.321625 | 12.777442 | 0.021807 | 523.3 | 4132.4 | 8.103 | -0.219 | 8.070 | 8.072 | 0.8879 | WR |
| 587742062138621980 | 164.967575 | 21.708441 | 0.115118 | 607.4 | 4306.8 | 8.260 | 1.183 | 9.716 | 8.590 | 0.9387 | |
| 588848900980015266 | 165.318329 | 0.804029 | 0.212857 | 1190.1 | 1025.2 | 10.368 | 1.059 | 9.144 | 8.000 | 0.8033 | |
| 587741600950845470 | 165.891815 | 25.404541 | 0.155750 | 600.4 | 3250.1 | 8.744 | 1.463 | 9.592 | 8.575 | 0.9247 | |
| 587741490907971706 | 166.243927 | 29.137699 | 0.002139 | 686.8 | 11346.6 | 10.537 | -2.520 | 6.109 | 7.994 | 0.0000 | |
| 587742015424233589 | 167.160431 | 22.636049 | 0.023815 | 630.1 | 4309.1 | 9.115 | -0.461 | 7.416 | 8.090 | 0.8827 | |
| 588017606290178168 | 169.363617 | 45.012020 | 0.184647 | 1267.6 | 859.8 | 7.988 | 0.821 | 9.276 | 8.144 | 0.7805 | |
| 587742775628005405 | 169.442932 | 17.740192 | 0.004916 | 538.2 | 6140.8 | 9.452 | -1.437 | 6.621 | 8.019 | 0.0000 | |
| 587726033317789755 | 169.686325 | 2.908351 | 0.020327 | 1284.1 | 4852.2 | 10.192 | -0.636 | 7.577 | 8.059 | 0.7053 | |
| 587739607548362788 | 170.779007 | 30.478922 | 0.005361 | 602.8 | 10808.8 | 10.285 | -1.248 | 6.154 | 8.689 | 0.0000 | WR |
| 588009370688553009 | 172.130554 | 61.215439 | 0.084348 | 928.3 | 2451.9 | 9.144 | 0.849 | 8.680 | 8.649 | 0.8768 | |
| 587735696440885344 | 172.818207 | 57.066330 | 0.005561 | 609.6 | 1984.4 | 7.771 | -1.694 | 6.507 | 7.897 | 0.0000 | |
| 587732484357161015 | 173.690506 | 50.100925 | 0.026005 | 623.1 | 10756.5 | 9.864 | 0.013 | 8.047 | 8.421 | 0.8640 | WR |
| 588017111292969009 | 174.099274 | 47.158077 | 0.010177 | 911.2 | 5198.8 | 9.470 | -1.221 | 6.675 | 7.934 | 0.0000 | |
| 587739408388980778 | 174.342255 | 35.407413 | 0.194313 | 562.8 | 2162.4 | 10.357 | 1.611 | 9.331 | 8.740 | 0.9274 | |
| 587742981247795242 | 175.087631 | 60.327374 | 0.146754 | 539.9 | 2470.4 | 9.891 | 0.873 | 8.653 | 0.8458 | ||
| 587739647821807686 | 175.281204 | 32.427006 | 0.006015 | 601.2 | 9006.3 | 10.478 | -1.797 | 6.041 | 7.922 | 0.0000 | |
| 587739609697878126 | 175.951233 | 32.716095 | 0.073985 | 915.4 | 3054.6 | 9.168 | 0.147 | 8.550 | 0.8608 | ||
| 588010879831113781 | 175.998093 | 5.365164 | 0.099142 | 596.1 | 1768.2 | 8.817 | 0.792 | 8.784 | 8.709 | 0.8537 | |
| 587748930312994906 | 176.705582 | 0.896104 | 0.056519 | 540.0 | 849.5 | 8.865 | -0.407 | 7.744 | 7.976 | 0.8131 | |
| 587742191512715306 | 177.113907 | 25.769936 | 0.045117 | 854.5 | 9305.0 | 9.024 | 0.550 | 8.507 | 8.061 | 0.8363 | |
| 587742775094345789 | 177.170303 | 17.942505 | 0.079110 | 919.6 | 4043.8 | 9.551 | 0.719 | 8.605 | 8.257 | 0.7842 | |
| 587739304214265947 | 177.268524 | 35.039696 | 0.021131 | 520.5 | 5706.4 | 8.944 | 0.064 | 7.707 | 8.670 | 1.0226 | |
| 587735348571996236 | 177.511383 | 15.023189 | 0.002448 | 834.3 | 22601.2 | -1.536 | 6.583 | 8.069 | 0.0000 | WR | |
| 587748928166101081 | 178.197968 | -0.668794 | 0.004619 | 590.0 | 3819.9 | 8.692 | -1.784 | 6.363 | 7.966 | 0.0000 | |
| 587739096987271268 | 178.512695 | 36.850090 | 0.268020 | 743.3 | 670.5 | 8.568 | 0.707 | 9.055 | 0.7893 | ||
| 587731891114803229 | 178.868073 | 57.664436 | 0.017262 | 1023.5 | 15064.6 | 9.550 | -0.176 | 7.660 | 7.914 | 0.7802 | WR |
| 587735346962497616 | 180.139252 | 13.718885 | 0.066750 | 1110.9 | 6000.8 | 9.444 | 0.066 | 8.471 | 0.8387 | WR | |
| 587726033859248332 | 180.231827 | 3.401094 | 0.084712 | 777.2 | 2024.7 | 0.417 | 8.482 | 7.907 | 0.8343 | ||
| 587726032248701055 | 180.342972 | 2.185653 | 0.003251 | 1014.1 | 3213.4 | 7.723 | -1.996 | 6.086 | 7.670 | 0.0000 | |
| 587741709958840329 | 180.457916 | 28.102964 | 0.055879 | 672.2 | 2718.8 | 9.224 | 0.169 | 8.241 | 8.039 | 0.8384 | |
| 587739408391471112 | 181.289520 | 35.830231 | 0.119502 | 746.0 | 2759.7 | 9.884 | 1.394 | 9.065 | 8.770 | 0.8169 | |
| 587741531715797096 | 181.343231 | 28.946814 | 0.107620 | 1303.6 | 1982.1 | 9.408 | 0.714 | 8.832 | 7.900 | 0.7614 | |
| 588011122502336742 | 181.772125 | 61.586613 | 0.262101 | 2270.8 | 448.2 | 12.980 | 0.723 | 9.048 | 8.181 | 0.8391 | |
| 587741491451002960 | 182.393707 | 30.890612 | 0.219277 | 574.2 | 1534.2 | 10.206 | 1.501 | 9.259 | 8.718 | 0.8622 | |
| 588017626154598555 | 182.534775 | 44.651821 | 0.022742 | 675.4 | 1456.2 | 8.300 | -0.899 | 7.243 | 8.028 | 0.9342 | |
| 588017567099388030 | 182.658813 | 13.023331 | 0.008039 | 873.0 | 2874.4 | 7.886 | -1.351 | 6.625 | 7.999 | 0.0000 | |
| 587742061609156755 | 183.351196 | 22.542812 | 0.162278 | 623.6 | 440.0 | 8.549 | 0.246 | 8.658 | 8.060 | 0.8466 | |
| 587733079202070556 | 183.510345 | 53.754841 | 0.003055 | 853.4 | 4177.1 | 8.413 | -1.939 | 6.025 | 7.707 | 0.0000 | |
| 587735696443506837 | 184.006226 | 57.577858 | 0.286866 | 1084.4 | 1180.1 | 1.242 | 9.038 | 0.8784 | |||
| 587735349111947338 | 184.766602 | 15.435700 | 0.195579 | 1094.5 | 1714.8 | 9.846 | 1.129 | 9.266 | 7.893 | 0.7630 | |
| 587742012747022361 | 184.884247 | 21.556944 | 0.140986 | 645.4 | 3180.9 | 10.048 | 1.615 | 9.185 | 8.811 | 0.8737 | |
| 588298662500171878 | 185.610733 | 47.066746 | 0.186958 | 611.5 | 2524.3 | 9.532 | 1.762 | 9.568 | 8.796 | 0.9345 | |
| 587742954397630497 | 185.818893 | 4.836145 | 0.017845 | 520.5 | 5224.2 | 8.804 | -0.811 | 8.062 | 0.8640 | ||
| 587739097526829082 | 186.152985 | 37.410152 | 0.040380 | 548.8 | 3170.1 | 9.265 | -0.095 | 7.864 | 7.907 | 0.8974 | |
| 588010878225088680 | 186.549576 | 4.260018 | 0.094233 | 984.5 | 2221.1 | 8.544 | 0.579 | 8.262 | 0.7379 | ||
| 588017729763016856 | 187.033600 | 7.912061 | 0.068031 | 582.2 | 2076.4 | 8.842 | 0.062 | 8.250 | 0.9121 | ||
| 588017702933758072 | 187.702515 | 12.045229 | 0.004185 | 577.7 | 5388.9 | 8.474 | -1.689 | 6.563 | 7.861 | 0.0000 | |
| 588848899379822768 | 189.216797 | -0.589419 | 0.008531 | 905.2 | 1317.8 | 9.443 | -1.916 | 6.129 | 8.045 | 0.0000 | |
| 588017728690257952 | 189.259445 | 6.925279 | 0.005381 | 1556.0 | 20058.4 | 10.698 | -0.819 | 8.707 | 0.0000 | WR | |
| 587735696981688461 | 189.505127 | 58.020718 | 0.083989 | 917.5 | 1786.0 | 8.612 | 0.443 | 8.464 | 8.403 | 0.8195 | |
| 588017109686943854 | 189.515656 | 46.305592 | 0.098789 | 740.7 | 2442.8 | 8.442 | 1.142 | 9.046 | 8.590 | 0.9575 | |
| 587732771595419747 | 189.528702 | 10.165563 | 0.003795 | 1106.1 | 6387.0 | 7.860 | -1.715 | 6.467 | 7.974 | 0.0000 | |
| 587725039022768267 | 190.497253 | -3.667338 | 0.009240 | 611.5 | 2370.1 | 8.569 | -1.425 | 6.590 | 7.896 | 0.0000 | |
| 588017977284427855 | 190.820267 | 38.769154 | 0.023091 | 531.9 | 2965.5 | 8.827 | -0.497 | 7.670 | 8.083 | 0.9677 | |
| 587726032253419628 | 191.097427 | 2.261253 | 0.239378 | 777.5 | 2103.5 | 9.553 | 1.631 | 9.570 | 8.688 | 0.8409 | |
| 588017979968847957 | 191.170593 | 40.708172 | 0.017520 | 967.9 | 2442.9 | 8.697 | -0.817 | 7.097 | 8.076 | 0.8386 | |
| 588017992294662200 | 191.287720 | 10.727820 | 0.165673 | 719.0 | 3626.7 | 9.292 | 1.616 | 9.564 | 8.770 | 0.8740 | |
| 587738570853974145 | 192.061798 | 15.974835 | 0.278174 | 622.2 | 768.9 | 8.756 | 1.311 | 9.323 | 8.644 | 0.9903 | |
| 588017570848768137 | 192.144318 | 12.567482 | 0.263408 | 669.4 | 881.5 | 10.583 | 1.002 | 9.127 | 8.255 | 0.9013 | |
| 587732483288989834 | 193.416092 | 49.516125 | 0.231133 | 513.5 | 426.3 | 9.095 | 0.589 | 8.964 | 8.133 | 0.9404 | |
| 587724649799942319 | 193.858643 | -2.226135 | 0.051885 | 1278.5 | 1582.4 | 9.196 | -0.327 | 7.667 | 0.7685 | ||
| 587726014538383550 | 194.380783 | 1.933281 | 0.252218 | 577.6 | 560.5 | 11.321 | 1.238 | 9.232 | 8.598 | 1.0160 | |
| 587738950417448968 | 195.763855 | 35.857948 | 0.060287 | 571.7 | 4688.5 | 0.573 | 8.741 | 8.526 | 0.9056 | ||
| 587739098067107878 | 195.976852 | 37.233856 | 0.035953 | 518.6 | 5864.9 | 9.103 | 0.186 | 8.335 | 8.562 | 0.8792 | WR |
| 587739304758083615 | 196.600800 | 35.228622 | 0.016196 | 650.3 | 5764.7 | -0.438 | 7.516 | 8.017 | 0.8456 | ||
| 587742062151467120 | 196.734818 | 22.694004 | 0.274104 | 521.6 | 451.1 | 8.173 | 0.887 | 9.228 | 8.326 | 0.9161 | |
| 587733080816091172 | 196.869583 | 54.447128 | 0.032524 | 544.9 | 8271.5 | 10.657 | 0.005 | 7.781 | 8.568 | 0.9184 | WR |
| 588848899383623800 | 197.812668 | -0.466085 | 0.230964 | 575.0 | 801.3 | 8.759 | 1.420 | 9.357 | 8.693 | 0.9482 | |
| 587741724973924354 | 199.480362 | 23.261173 | 0.024026 | 582.0 | 2775.0 | 8.332 | -0.357 | 7.912 | 8.086 | 0.9145 | |
| 587724648191885354 | 199.604355 | -3.418798 | 0.128790 | 617.3 | 2723.1 | 9.483 | 1.544 | 9.445 | 8.930 | 0.9964 | |
| 587733080280203402 | 200.460190 | 53.691071 | 0.032849 | 620.9 | 1215.2 | -0.483 | 7.600 | 8.103 | 0.8455 | ||
| 587729775021981805 | 200.947754 | -1.547763 | 0.022464 | 1460.7 | 4136.0 | 9.764 | -0.727 | 7.042 | 7.870 | 0.7238 | |
| 587742062153236558 | 201.152542 | 22.183628 | 0.075391 | 747.1 | 2376.6 | 9.070 | 0.446 | 8.421 | 8.485 | 0.8791 | |
| 587729385546186821 | 201.229340 | 57.752960 | 0.116320 | 528.5 | 1764.5 | 8.590 | 0.928 | 9.268 | 8.754 | 0.9172 | |
| 587735429081530430 | 201.332870 | 48.040596 | 0.016369 | 669.9 | 3471.1 | 8.694 | -0.717 | 7.423 | 8.024 | 0.8676 | |
| 587739406251327528 | 201.455933 | 33.065105 | 0.014620 | 534.3 | 9028.6 | 9.043 | -0.458 | 7.720 | 8.359 | 0.9279 | |
| 587726031184330774 | 201.727585 | 1.229622 | 0.179626 | 679.3 | 2060.7 | 9.441 | 1.060 | 9.296 | 8.075 | 0.9287 | |
| 588017947210154051 | 201.847031 | 40.367821 | 0.010498 | 688.7 | 1261.1 | 8.706 | -1.700 | 6.273 | 7.802 | 0.0000 | |
| 588017605226594329 | 202.183563 | 43.930698 | 0.027969 | 559.8 | 14970.0 | 9.654 | 0.333 | 8.336 | 8.610 | 0.8825 | WR |
| 587742773494218867 | 202.220657 | 15.992878 | 0.022747 | 866.1 | 3471.1 | 9.281 | -0.680 | 7.179 | 7.845 | 0.8386 | |
| 587742903405379689 | 202.318985 | 17.005835 | 0.094252 | 738.3 | 4768.0 | 10.383 | 1.328 | 8.970 | 8.811 | 0.8630 | |
| 587742774031220880 | 202.470200 | 16.342064 | 0.180808 | 778.9 | 1996.8 | 9.298 | 1.118 | 9.398 | 8.361 | 0.8456 | |
| 588017948284092523 | 202.536865 | 41.123695 | 0.027297 | 539.9 | 971.7 | 8.266 | -0.675 | 7.280 | 8.005 | 0.9497 | |
| 588017949357834271 | 202.862137 | 41.863415 | 0.011701 | 744.3 | 5782.7 | 8.741 | -0.885 | 7.159 | 7.854 | 0.0000 | |
| 587733411516842159 | 203.692856 | 53.824303 | 0.167942 | 502.2 | 888.1 | 8.726 | 1.007 | 9.018 | 8.781 | 0.9338 | |
| 587742550137241839 | 203.757736 | 18.527227 | 0.314059 | 679.4 | 465.2 | 9.626 | 0.940 | 9.044 | 0.9516 | ||
| 588017726556143757 | 203.906677 | 8.030304 | 0.123465 | 847.5 | 1983.8 | 9.466 | 0.755 | 8.982 | 7.996 | 0.8346 | |
| 587738953104556058 | 203.950333 | 37.029358 | 0.056500 | 586.5 | 2891.1 | 0.482 | 8.441 | 8.553 | 0.9542 | ||
| 587738570859413642 | 204.867935 | 15.278371 | 0.192017 | 932.6 | 1808.1 | 9.872 | 1.609 | 9.298 | 8.676 | 0.7877 | |
| 587739608635146287 | 205.485336 | 30.519339 | 0.003196 | 533.2 | 10491.2 | 8.374 | -1.504 | 6.979 | 8.107 | 0.0000 | WR |
| 587735666377883763 | 206.114014 | 56.024929 | 0.070633 | 687.8 | 6400.2 | 8.839 | 1.033 | 9.146 | 8.549 | 0.9120 | WR |
| 587739609709346918 | 206.848175 | 31.215101 | 0.119167 | 569.9 | 1492.4 | 8.979 | 0.552 | 9.374 | 8.269 | 0.9133 | |
| 587739811557867563 | 207.029114 | 26.405453 | 0.057039 | 555.6 | 4357.2 | 8.697 | 0.576 | 8.807 | 8.147 | 0.9111 | |
| 587742062693187673 | 208.642700 | 21.831629 | 0.110722 | 615.3 | 1465.5 | 0.663 | 9.765 | 8.289 | 0.9298 | ||
| 588848901536481289 | 210.078918 | 1.081637 | 0.121090 | 865.0 | 2392.8 | 0.921 | 8.991 | 8.564 | 0.8628 | ||
| 587735695913386093 | 211.119293 | 54.397999 | 0.000970 | 1126.5 | 17817.4 | -1.935 | 6.036 | 8.742 | 0.0000 | ||
| 587726102556377282 | 211.855453 | 5.477178 | 0.084972 | 579.5 | 1425.3 | 9.111 | 0.166 | 8.444 | 8.002 | 0.8908 | |
| 587735696987389965 | 212.486496 | 54.946915 | 0.077313 | 721.9 | 6030.7 | 9.581 | 1.364 | 8.988 | 8.787 | 0.8831 | WR |
| 588298661971820653 | 212.746735 | 43.046371 | 0.065605 | 613.0 | 4279.9 | 10.072 | 1.277 | 8.449 | 8.752 | 0.9095 | |
| 587742551751721066 | 213.140366 | 18.500360 | 0.007383 | 568.7 | 3461.5 | -1.410 | 6.882 | 7.994 | 0.0000 | ||
| 587735696987717870 | 213.630035 | 54.515598 | 0.227058 | 508.9 | 393.8 | 9.521 | 0.515 | 9.033 | 8.201 | 0.8706 | |
| 587739380986216524 | 214.643311 | 31.211664 | 0.163290 | 531.8 | 433.5 | 9.977 | 0.310 | 8.572 | 7.891 | 0.9107 | |
| 587739843771695144 | 214.713028 | 21.044373 | 0.008547 | 1156.2 | 6710.1 | -1.161 | 6.632 | 7.674 | 0.0000 | ||
| 587722982292521071 | 215.559616 | -0.655451 | 0.105870 | 572.2 | 1330.7 | 9.785 | 0.268 | 8.729 | 8.016 | 0.8116 | |
| 587739826591563799 | 215.928650 | 22.957996 | 0.032848 | 743.2 | 4621.7 | 9.421 | -0.189 | 7.650 | 7.805 | 0.8238 | |
| 588017114517536797 | 216.023865 | 42.279533 | 0.184816 | 1083.9 | 2550.9 | 10.255 | 1.675 | 9.284 | 8.787 | 0.7707 | |
| 587728920058200166 | 216.579788 | 62.463882 | 0.111854 | 584.1 | 1431.6 | 9.294 | 0.403 | 9.078 | 8.574 | 0.8677 | WR |
| 588017948825813029 | 216.617355 | 38.382965 | 0.022302 | 535.4 | 2074.6 | 9.449 | -0.805 | 7.189 | 7.939 | 0.8890 | |
| 588017979977826415 | 217.022964 | 36.452888 | 0.086236 | 530.5 | 3105.9 | 8.794 | 0.574 | 8.841 | 8.022 | 0.8709 | |
| 587736525374357550 | 217.445862 | 6.726379 | 0.173502 | 850.2 | 4236.5 | 10.481 | 1.985 | 9.445 | 8.810 | 0.8173 | |
| 587726031728345220 | 218.042328 | 1.431060 | 0.136353 | 619.1 | 1768.1 | 9.372 | 1.142 | 9.005 | 8.808 | 0.9050 | |
| 587742577530372265 | 219.488220 | 17.322380 | 0.201980 | 1069.5 | 950.0 | 9.659 | 0.766 | 9.215 | 0.7740 | ||
| 587726014549328120 | 219.517548 | 1.559333 | 0.312374 | 534.2 | 747.9 | 10.290 | 1.790 | 9.366 | 8.841 | 0.9448 | |
| 587736545772044617 | 220.114777 | 5.531906 | 0.005195 | 976.7 | 2689.7 | 8.539 | -1.817 | 6.170 | 7.789 | 0.0000 | |
| 587729777446945029 | 220.630737 | -2.164453 | 0.293644 | 899.7 | 830.3 | 10.028 | 1.118 | 9.112 | 7.999 | 0.7170 | |
| 587726101486764162 | 221.172363 | 4.161592 | 0.038811 | 841.9 | 1110.9 | 7.717 | -0.702 | 7.359 | 7.679 | 0.8334 | |
| 588011218602623163 | 221.949203 | 57.083385 | 0.285271 | 641.3 | 499.2 | 8.609 | 1.074 | 8.997 | 8.865 | 0.8904 | |
| 587729778521342037 | 222.022400 | -1.182697 | 0.027412 | 792.0 | 14736.6 | 9.634 | 0.475 | 8.090 | 7.951 | 0.8693 | |
| 587733398637314061 | 222.735794 | 48.623966 | 0.091899 | 536.6 | 4395.6 | 9.596 | 0.973 | 9.170 | 8.539 | 0.8913 | |
| 588018055652769997 | 223.648239 | 45.482330 | 0.268552 | 505.7 | 786.5 | 9.707 | 1.692 | 9.269 | 8.927 | 1.0017 | |
| 588023721783328799 | 223.690521 | 20.527960 | 0.015779 | 508.9 | 2959.8 | -0.984 | 7.179 | 7.992 | 0.0000 | ||
| 588017626705166406 | 223.775284 | 38.137966 | 0.027702 | 703.9 | 5563.8 | 9.567 | 0.060 | 7.601 | 8.627 | 0.8179 | |
| 587739828742389914 | 224.396408 | 22.533831 | 0.148653 | 923.9 | 2325.5 | 9.286 | 1.009 | 9.241 | 8.296 | 0.7807 | |
| 587736976343171214 | 224.484177 | 30.862373 | 0.076537 | 539.6 | 1927.9 | 8.947 | 0.704 | 8.536 | 8.692 | 0.9438 | |
| 588011103712706632 | 226.616592 | 56.450748 | 0.278579 | 502.9 | 742.5 | 8.949 | 1.691 | 9.445 | 8.899 | 1.0494 | |
| 587729227147968579 | 226.869537 | 59.986984 | 0.182027 | 542.6 | 1727.1 | 9.325 | 1.533 | 9.436 | 8.757 | 0.9745 | WR |
| 587733397565341781 | 227.287689 | 45.719120 | 0.048121 | 558.7 | 4671.8 | 8.916 | 0.349 | 8.359 | 8.569 | 0.9481 | WR |
| 588017627780153375 | 227.392395 | 37.529476 | 0.032549 | 1348.0 | 6715.9 | 8.947 | 0.329 | 7.784 | 7.921 | 0.7920 | |
| 587733399712628848 | 228.053574 | 47.275188 | 0.053158 | 564.5 | 9973.9 | 8.715 | 1.012 | 9.119 | 8.611 | 0.9387 | WR |
| 587739629560332485 | 228.229614 | 24.219585 | 0.073510 | 539.8 | 1591.2 | 9.309 | 0.114 | 8.389 | 8.040 | 0.8804 | |
| 587733412061577276 | 229.483307 | 46.418430 | 0.019327 | 594.6 | 2838.0 | 8.866 | -0.767 | 7.241 | 8.003 | 0.8990 | |
| 588011218605179021 | 230.190155 | 53.635342 | 0.207637 | 725.7 | 629.5 | 9.168 | 0.683 | 9.234 | 8.407 | 0.9447 | |
| 587739845925732735 | 230.661835 | 18.914272 | 0.182822 | 875.9 | 509.3 | 0.619 | 9.171 | 7.998 | 0.8893 | ||
| 588017977836240925 | 230.884140 | 29.520021 | 0.068164 | 780.7 | 3333.1 | 9.164 | 0.344 | 8.405 | 7.986 | 0.8220 | |
| 587736976882663541 | 230.962494 | 28.616953 | 0.085434 | 620.5 | 1934.2 | 9.911 | 0.473 | 8.582 | 8.614 | 0.8938 | |
| 587732484375314456 | 232.071594 | 39.947338 | 0.064470 | 633.4 | 2909.7 | 8.869 | 0.449 | 8.753 | 8.552 | 0.8312 | WR |
| 588848900472373334 | 232.128006 | 0.294496 | 0.113605 | 505.2 | 2186.0 | 9.149 | 0.448 | 9.273 | 7.670 | 0.9574 | |
| 587736618784587856 | 232.671951 | 31.018482 | 0.087004 | 516.8 | 4146.2 | 0.934 | 9.243 | 8.300 | 0.9380 | ||
| 587742577536205016 | 232.982117 | 14.321038 | 0.031074 | 728.8 | 1892.1 | 8.156 | -0.424 | 7.549 | 7.824 | 0.8503 | |
| 587742061093322861 | 233.639023 | 14.913211 | 0.073269 | 600.4 | 4016.0 | 9.533 | 0.597 | 8.758 | 8.134 | 0.9021 | |
| 587729229297090692 | 234.405319 | 58.794586 | 0.214291 | 722.0 | 668.8 | 8.643 | 0.830 | 9.097 | 8.485 | 0.9031 | |
| 587735666387058818 | 235.333435 | 45.605324 | 0.202897 | 800.5 | 1571.6 | 10.129 | 1.627 | 9.269 | 8.757 | 0.9311 | |
| 587736915148996802 | 236.431473 | 8.967041 | 0.037724 | 1086.2 | 13056.6 | 10.073 | 0.492 | 8.041 | 7.841 | 0.7845 | |
| 587726101493579972 | 236.727264 | 3.150609 | 0.208937 | 613.6 | 2060.5 | 9.310 | 1.313 | 9.545 | 8.545 | 0.9161 | |
| 587736542027710819 | 236.755005 | 5.807413 | 0.230501 | 635.0 | 719.2 | 9.296 | 1.350 | 9.206 | 8.779 | 0.8723 | |
| 587726102030451047 | 236.787933 | 3.603900 | 0.231209 | 777.0 | 710.0 | 8.450 | 1.242 | 9.259 | 8.659 | 0.9510 | |
| 587739720845230356 | 237.615784 | 19.349661 | 0.212293 | 551.9 | 1531.4 | 9.688 | 1.874 | 9.422 | 8.868 | 0.8484 | |
| 587739652107600089 | 238.041687 | 21.053413 | 0.233148 | 555.8 | 628.5 | 9.161 | 0.923 | 9.193 | 8.264 | 0.8091 | |
| 587742061095551365 | 238.709274 | 13.435967 | 0.148752 | 901.5 | 1005.4 | 8.679 | 0.800 | 9.127 | 8.344 | 0.8277 | |
| 587736975276048497 | 239.384613 | 23.347342 | 0.032834 | 732.1 | 13564.8 | 9.772 | 0.531 | 8.049 | 8.651 | 0.9593 | WR |
| 587733399717413034 | 239.935684 | 40.556999 | 0.226811 | 500.1 | 682.6 | 9.522 | 0.828 | 9.139 | 8.269 | 0.8699 | |
| 587736915687964980 | 241.152771 | 8.333086 | 0.312282 | 662.1 | 552.5 | 9.240 | 0.942 | 9.183 | 8.041 | 0.9067 | |
| 587729409147666501 | 241.417877 | 50.754395 | 0.012880 | 600.7 | 2121.6 | 9.534 | -1.437 | 6.275 | 8.084 | 0.0000 | |
| 587739844320166055 | 241.614731 | 13.929967 | 0.107036 | 780.1 | 3672.8 | 10.099 | 1.296 | 8.866 | 8.711 | 0.8247 | |
| 588018253759054025 | 242.043182 | 35.469250 | 0.032705 | 1296.1 | 1960.0 | 8.993 | -0.382 | 7.309 | 7.870 | 0.7605 | |
| 587739385278890314 | 243.373352 | 20.090286 | 0.051053 | 546.5 | 726.2 | 8.791 | -0.481 | 7.610 | 7.978 | 0.9221 | |
| 587736976351822098 | 244.027786 | 21.638210 | 0.288249 | 529.5 | 629.6 | 9.044 | 0.623 | 9.099 | 0.8935 | ||
| 587742628534354235 | 244.070374 | 9.354526 | 0.048400 | 562.3 | 2155.5 | 8.338 | 0.077 | 8.189 | 8.110 | 0.9804 | |
| 587739706886062320 | 245.469055 | 15.315551 | 0.034341 | 672.1 | 7771.3 | 8.976 | 0.711 | 8.377 | 8.711 | 1.1473 | |
| 587745968930029927 | 245.681107 | 16.605579 | 0.149523 | 542.6 | 1911.6 | 10.843 | 1.595 | 8.794 | 1.0122 | ||
| 587722982842761249 | 246.042145 | -0.367383 | 0.031327 | 649.5 | 14186.6 | 9.371 | 0.483 | 8.298 | 8.257 | 0.8995 | |
| 587739810501361893 | 246.963211 | 13.587149 | 0.016464 | 540.5 | 5675.7 | 9.042 | -0.347 | 7.776 | 8.577 | 0.9545 | WR |
| 587739720849555951 | 247.051987 | 15.199133 | 0.316043 | 576.9 | 416.7 | 8.978 | 0.900 | 9.181 | 0.9590 | ||
| 588018253224935626 | 247.114746 | 30.914915 | 0.114333 | 567.3 | 1605.6 | 9.261 | 0.074 | 9.064 | 7.670 | 0.9250 | |
| 587729408620495044 | 258.152618 | 32.275951 | 0.011950 | 797.3 | 3946.4 | -1.065 | 7.050 | 7.868 | 0.0000 | ||
| 587725503949177426 | 260.040924 | 54.359188 | 0.293770 | 790.4 | 321.1 | 8.847 | 0.622 | 8.875 | 0.8666 | ||
| 587725576962244831 | 261.776398 | 59.817295 | 0.347100 | 502.7 | 522.0 | 1.663 | 0.9932 | ||||
| 587725576426618961 | 262.277313 | 56.888676 | 0.015791 | 503.9 | 5343.1 | 8.911 | -0.310 | 7.715 | 8.969 | 1.0180 | WR |
| 587725577500360837 | 263.755188 | 57.052376 | 0.047232 | 1347.3 | 17026.0 | 9.705 | 1.155 | 8.596 | 8.770 | 0.7995 | WR |
| 587727214417871520 | 315.309967 | -5.919530 | 0.196179 | 561.8 | 1578.1 | 9.207 | 1.010 | 9.485 | 8.368 | 0.9205 | |
| 587731174918062687 | 316.967316 | 1.214631 | 0.175984 | 689.2 | 660.8 | 8.644 | 0.467 | 9.036 | 8.013 | 0.8687 | |
| 587726877265559558 | 318.862823 | -7.997601 | 0.028449 | 629.7 | 4729.1 | 9.666 | -0.199 | 7.616 | 8.082 | 0.9073 | |
| 587730774410068219 | 323.657532 | 11.419499 | 0.022039 | 578.3 | 5204.3 | 10.794 | -0.998 | 6.831 | 8.429 | 0.9261 | WR |
| 587731187802767922 | 333.112244 | 1.143138 | 0.210114 | 561.5 | 465.3 | 8.104 | 0.617 | 0.9567 | |||
| 587734304877707550 | 333.179413 | 0.113483 | 0.177042 | 615.3 | 696.9 | 9.671 | 0.612 | 8.572 | 0.9595 | ||
| 587734304878035106 | 333.846069 | 0.046320 | 0.077447 | 769.5 | 2854.2 | 9.130 | 1.015 | 8.711 | 0.8438 | ||
| 587731186193530964 | 336.292206 | -0.198011 | 0.066681 | 724.3 | 4011.3 | 9.590 | 0.437 | 8.401 | 7.979 | 0.8254 | |
| 587727222478667784 | 339.629669 | 14.008272 | 0.020607 | 955.9 | 3569.8 | 9.742 | -0.769 | 6.721 | 7.713 | 0.8022 | |
| 587731187271336095 | 345.541687 | 0.827455 | 0.033118 | 853.6 | 2106.8 | 8.976 | -0.558 | 7.727 | 0.8257 | ||
| 587731187810042042 | 349.763550 | 1.148190 | 0.030129 | 575.0 | 1857.7 | 8.859 | -0.469 | 7.953 | 0.9916 | ||
| 587731186201460957 | 354.466370 | -0.166820 | 0.071730 | 727.8 | 1832.8 | 9.203 | 0.296 | 8.019 | 0.8440 | ||
| 588015510341943481 | 357.280731 | 0.932718 | 0.185753 | 511.3 | 441.1 | 9.487 | 0.215 | 8.152 | 0.9902 |
Note. — Col.(1): SDSS object ID. Col.(2): Right Ascension (J2000). Col.(3): Declination (J2000). Col.(4): Redshift. Col.(5) H equivalent width in units of Å, from MPA-JHU value added catalog for SDSS DR7. Col.(6): H line flux in units of erg s-1 cm-2, from MPA-JHU value added catalog for SDSS DR7. Col.(7): FUV luminosity surface density in units of kpc-2. FUV luminosity is derived using GALEX FUV magnitude, and is divided with , while is half-light radius in SDSS -band. Col.(8): log of the star formation rate in units of yr-1, from MPA-JHU value added catalog for SDSS DR7. Col.(9): log stellar mass in units of from MPA-JHU value added catalog for SDSS DR7. Col.(10): 12log[O/H] from MPA-JHU value added catalog for SDSS DR7. Col.(11): from MPA-JHU value added catalog for SDSS DR7. Col.(12): Comment for each object. We marked objects that are matched with Wolf-Rayet galaxies (Brinchmann et al. 2008) as ‘WR’.