Quantifying the role of bars in the build-up of central mass concentrations in disk galaxies
Abstract
We analyze the role of bars in the build-up of central mass concentrations in massive, disk galaxies. Our parent sample consists of 3757 face-on disk galaxies with redshifts between 0.01 and 0.05, selected from the seventh Data Release of the Sloan Digital Sky Survey. 1555 galaxies with bars are identified using position angle and ellipticity profiles of the -band light. We compare the ratio of the specific star formation rate measured in the 1-3 kpc central region of the galaxy to that measured for the whole galaxy. Galaxies with strong bars have centrally enhanced star formation; the degree of enhancement depends primarily on the ellipticity of the bar, and not on the size of the bar or on the mass or structure of the host galaxy. The fraction of galaxies with strong bars is highest at stellar masses greater than , stellar surface densities less than and concentration indices less than 2.5. In this region of parameter space, galaxies with strong bars either have enhanced central star formation rates, or star formation that is suppressed compared to the mean. This suggests that bars may play a role in the eventual quenching of star formation in galaxies. Only 50% of galaxies with strongly concentrated star formation have strong bars, indicating that other processes such as galaxy interactions also induce central star-bursts. We also find that the ratio of the size of the bar to that of the disk depends mainly on the colour of the galaxy, suggesting that the growth and destruction of bars are regulated by gas accretion, as suggested by simulations.
keywords:
galaxies: evolution–galaxy structure: galaxies–bulge: galaxies1 introduction
It has long been conjectured that spiral galaxies evolve along the Hubble sequence from “late-type” disk-dominated systems to “early-type” galaxies with very massive bulges . This scenario is supported by the fact that the co-moving number density of massive bulge-dominated galaxies increases from high redshifts to the present day, while the number density of lower mass star-forming disk galaxies evolves comparatively little with redshift (Couch et al., 1998; Fasano et al., 2000; Kovač et al., 2010). It is believed that major merger events build classical bulges with light profiles that follow a law (Barnes & Hernquist, 1992; Toomre, 1977), while pseudo-bulges with light profiles that are close to exponential are formed from the disk itself (see reviews by Kormendy & Kennicutt, 2004; Wyse et al., 1997). Pseudo-bulges are common in disk-dominated galaxies at low redshift (Balcells et al., 2003; Laurikainen et al., 2007; Weinzirl et al., 2009).
There are many mechanisms that may cause disks to become unstable and gas to flow towards the center of the galaxy, eventually forming a bulge. Tidal forces exerted by an interacting companion cause gas to lose angular momentum and to flow into the central region of the galaxy where it forms stars at an elevated rate (a so-called “starburst”)(Mihos & Hernquist, 1996; di Matteo et al., 2007; Cox et al., 2008). More than half of the galaxies with the highest central specific star formation rates (SSFR) in the local universe are interacting with a close companion (Li et al., 2008). Alternatively, asymmetric structures in the disk, including bars and spiral arms exert torques that drive gas inwards (see the review by Kormendy & Kennicutt, 2004).
The mechanisms by which bars influence the flow of gas in galaxies have been studied in considerable detail using simulations. Bars induce gravitational torques that drive the gas towards the leading end of the bar where it is compressed and shocked, and where it loses energy by radiative processes, causing it to flow to the center of the galaxy (Athanassoula, 1992; Knapen et al., 2002; Piner et al., 1995; Regan & Teuben, 2004; Zurita & Pérez, 2008; Sheth et al., 2002). Galaxies with thick bars tend to form nuclear rings (Regan & Teuben, 2003; Piner et al., 1995; Schinnerer et al., 2003). Some of the gas will reach the center and produce a disc-like bulge (Athanassoula, 1992, 2005). Bars are robust if the galaxy remains undisturbed (Athanassoula, 2005b).
Observational evidence that this basic picture is correct have come from highly resolved maps of the ionized, atomic and molecular gas in individual barred galaxies (e.g. Quillen et al., 1995; Schinnerer et al., 2002; Sheth et al., 2000), which allow one to track the motion of the gas in detail. In addition, there have been studies of samples of barred and unbarred galaxies that have revealed higher gas concentrations (Jogee et al., 2005; Sakamoto et al., 1999; Sheth et al., 2005), higher central star formation rates and flatter chemical abundance gradients (de Jong et al., 1984; Devereux, 1987; Ho & Filippenko, 1997; Hawarden et al., 1986; Martin & Jean-René, 1994; Puxley et al., 1988; Zaritsky et al., 1994) in the former. On average, these differences are most pronounced in galaxies with the strongest bars (Ho & Filippenko, 1997; Martin, 1995; Martin & Jean-René, 1994). Recent observations suggest that most disk galaxies at high redshift are extremely gas-rich and hence dynamically unstable, and will likely form bulges on a short timescale (Genzel et al. 2006, 2008).
It would be valuable to quantify the role that bars have played in the formation of the present-day bulge and pseudo-bulge population. It has been controversy about whether bars are found more frequently in early-type or in late-type disk galaxies (Barazza et al., 2008; Marinova et al., 2009; Sheth et al., 2008). Enhanced central star formation rates are more likely to be found in early-type galaxies with bars than in late-type galaxies with bars (Devereux, 1987; Ho & Filippenko, 1997). These results are somewhat difficult to interpret because Hubble type is a complex function of both bulge-to-disk ratio and star formation rate.
In semi-analytic models of galaxy formation, disks form when gas cools and settles at the center of a dark matter halo, while conserving angular momentum. In recent years, simple prescriptions for bulge growth through disk instabilities have been included in these models (Benson et al., 2010; De Lucia et al., 2011; Parry et al., 2009), but these have only been tested against observations in a rudimentary way. Ideally, these models should be able to account for the fraction of disk galaxies with pseudo-bulges as a function of both halo mass and stellar mass and the size of the disk.
In this paper, we study the effect of bars in building the central mass concentrations in galaxies as a function of parameters such as stellar mass, stellar surface mass density and concentration. We make use of imaging data from the Sloan Digital Sky Survey (SDSS, York et al., 2000). The SDSS images have a pixel scale of and a mean PSF (point spread function) of (FWHM). In this study, we identify bars from the images of 4000 disk galaxies with redshifts in the range 0.01 to 0.05 drawn from the seventh data release (DR7) of the SDSS. We first investigate the bar strength needed to cause enhancement in the central star formation rate of the galaxy. We then divide our galaxies into a 4-dimensional parameter space of stellar mass, concentration, stellar mass surface density and colour and quantify the fraction of galaxies that are undergoing bar-driven central mass growth at the present day.
In Section 2, we describe our sample and the methods used to identify bars and to quantify their strength. In Section 3.1, we examine how strongly star formation is concentrated towards the centers of barred galaxies compared to control samples of non-barred galaxies matched in stellar mass, stellar mass surface density and colour. In this analysis, we parameterize bar strength using the ellipticity of the bar, . In Section 3.2 we examine the colours of bars, showing that the strongest bars have the bluest colours. In Section 3.3, we show how the fraction of barred galaxies varies according to the location of the galaxy in the 4-dimensional parameter space of stellar mass, stellar mass surface density, concentration and colour. In Section 3.4, we investigate which galaxy properties correlate most strongly with bar strength and size. Finally, in section 4, we summarize and discuss our results.
2 Data
2.1 The Sample
We select galaxies with M in the redshift range 0.010.05 from the MPAJHU spectroscopic catalogue (http://www.mpa-garching.mpg.de/SDSS/DR7/), which is drawn from the seventh data release (DR7) of the SDSS (Abazajian et al., 2009). This yields a sample of 16573 galaxies. Our aim is to assess the role of bars in building bulges in present-day disk-dominated systems, so we also select systems with , where R90 and R50 are the radii of the circular apertures enclosing 90 percent and 50 percent of the total -band light from the galaxy. We further limit the sample to galaxies with ellipticiy (or an inclination of less than 41.4 degrees), where and are the major and minor axes of an ellipsoidal fit in the band to each galaxy. We employ this criterion to select relatively face-on galaxies, because it is difficult to identify bars in more inclined galaxies (Laurikainen & Salo, 2002). These cuts yield a sample of 3890 galaxies, which we will use to characterize bars.
In this paper, we deribe global star formation rates by fitting the observed , , , , , and band fluxes of the galaxy with a library of model SEDs (Saintonge et al., 2011; Wang et al., 2011). The model SED library is generated using stellar population synthesis models (Bruzual & Charlot, 2003) and includes model “galaxies” spanning a range in metallicity, age, star formation history and dust attenuation strength. The probability that the observed SED can be described by each model SED is calculated, and the SFR of the galaxy is then given as the probability-weighted SFR averaged over the whole model library. We also use the derived using this method to correct the global colours of galaxies for internal reddening.
We also make use of star formation rates estimated directly from the SDSS spectra, which are obtained through 3 arcsecond diamteter fibres. These star formation rates, which are taken directly from the MPA/JHU catalogue, are obtained by fitting the measured emission line fluxes to a set of photo-ionization+stellar population synthesis models (Brinchmann et al., 2004).
Finally, we derive morphological parameters, such as asymmetry index for all the galaxies (see Wang et al., 2011, for more details).
2.2 Bar Identification
We use position angle and ellipticity profiles to identify bars in galaxies. Similar methods have been employed in many past papers (e.g. Barazza et al., 2008; Jogee et al., 2004; Knapen et al., 2002; Laine et al., 2002; Menéndez-Delmestre et al., 2007; Sheth et al., 2003; Whyte et al., 2002; Wozniak et al., 1995).
We first use SExtractor to estimate galaxy sizes (Petrosian radius, R50 and R90), ellipticities and disk position angles. We mask neighboring sources in the vicinity of the main galaxy. We then run the task twice on the SDSS band images over a range of radii extending from twice the Petrosian radius down to a radius of 0.8 arcsec from the centre of the galaxy.
The sampling radius in the fit increases exponentially with a step of 1.1, and the center of each ellipse is allowed to vary. During the first run of the task, we set R90 as the starting radius. During the second run, we set the starting radius to max(R50, 1.5”). During both runs, the initial values of ellipticity and position angle are set equal to the values measured by SExtractor for the whole galaxy. The two profiles are then merged and bad points are discarded. Bad points are defined as points where the task failed to find a solution, the error on the ellipticity measurement is larger than 0.05, or the error on the position angle is larger than 5.
The fit is said to have been successful if the merged profile covers the radius ranging from 1.4 arcsec to R90, and if it covers more than 60 of the original range in radii that served as input for the task. We also visually examined all the fits and found that our procedure was successful in almost all cases. Failures occurred for 133 galaxies (less than of the sample), mainly because the galaxies were strongly disturbed or had extended low surface brightness disks. We note that Barazza et al. (2008) and Jogee et al. (2004) obtained a similar failure rate in their own analysis of bars in galaxies in the Sloan Digital Sky Survey. The remaining 3757 galaxies are well fitted with ellipses throughout the entire disk, and our analysis of bars will be confined to these systems from now on. We do not deproject the images or the profiles before classifying a galaxy as barred or un-barred. Such de-projections are subject to considerable uncertainty, particularly for more bulge-dominated galaxies. Errors introduced by projection effects will be discussed later.
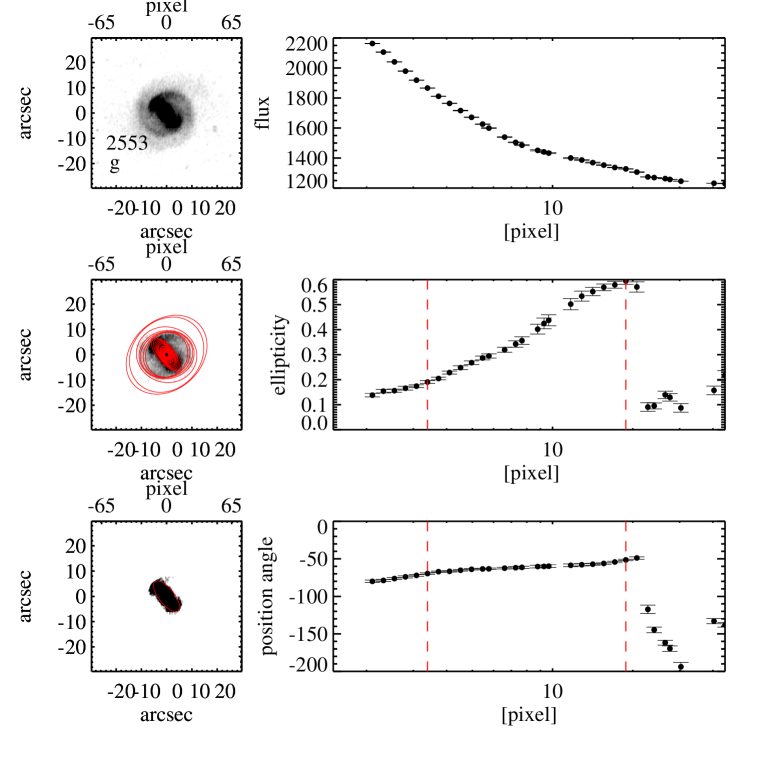
The criteria we use to classify a galaxy as “barred” are similar to those adopted by Jogee et al. (2004), hereafter J04, with a few changes that are detailed below. J04 required that (1) within the bar, the ellipticity should rise to a maximum value greater than 0.25, and that the position angle within the bar should remain constant to within 20 degrees; (2) at the end of the bar, the ellipticity should drop by more than 0.1 and the position angle should change by more than 10 degrees. Figure 1 illustrates the ellipticity and position angle profiles of a galaxy that is classified as barred according to these criteria.
We imposed the following additional requirements after visually inspecting all the fits : (1) the inner radius of the bar should be less than 0.5 times the outer radius of the bar, and ellipticity should increase monotonically as a function of radius from 0.33 to the end of the bar. This requirement improves the ability of the algorithm to identify bars in galaxies with prominent bulges Martin (1995) showed that the size of the bulge is on average about half the size of the bar). It also prevents complicated spiral structures and inner rings from being mistakenly identified as bars. (2) The outer radius of the bar should be less than 0.8 times the semi-major axis of the outermost fitted ellipse. This requirement ensures that edge-on, disk-dominated galaxies, where the inclination has been incorrectly measured, do not enter our sample of barred galaxies. (3) if criterion 1 adopted by J04 is satisfied, and the ellipticity drops by more than 0.25 at the end of the bar, but the position angle does not change by more than 10 degrees, we still classify the galaxy as barred.
The final requirement ensures that we do not exclude galaxies which have a long bar surrounded by an aligned ring Examples of such systems are given in Gadotti & de Souza (2003). We also note that Menéndez-Delmestre et al. (2007) estimated that the J04 position angle criterion could introduce incompleteness at the 10% level. Criterion 3 resolves this problem for bars which have high ellipticity (0.5), which are the focus of our study.
As well as classifying galaxies into barred and non-barred systems, we compute two quantitative parameters: 1) the bar ellipticity , defined as the value of the ellipticity at the end of the bar, and 2) the relative bar size , where is the diameter of the bar and is is the diameter of the 25 mag isophote measured in the -band. The median value of is 0.47 and the median value of is 0.3 for the galaxies in this study.
The most distant galaxies in our sample are at , where 2.5 times the FWHM of the SDSS PSF ( arcsec) corresponds to a physical scale of 3.8 kpc. Note that a 3.8 kpc bar aligned along the minor axis of an inclined galaxy with 0.25 has a de-projected physical size of 5 kpc, so our sample is complete for bars larger than 5 kpc.
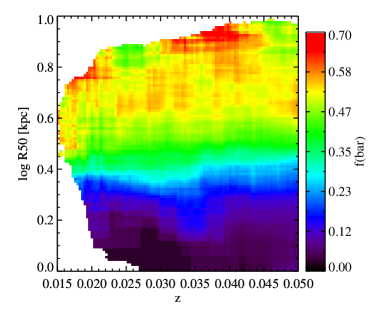
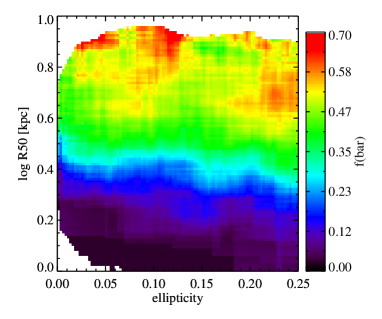
To demonstrate that our 5 kpc cut produces an unbiased sample of barred galaxies, we plot the fraction of barred systems as a function of redshift and galaxy size in the left panel of Figure 2. If the barred galaxy sample suffers from incompleteness because we miss bars with smaller angular sizes, we might expect the bar fraction to drop at higher redshifts, particularly in small galaxies. We see, however, that bar fractions do not vary with redshift at fixed physical size. The right panel of Figure 2 shows the fraction of barred galaxies as a function of galaxy size and ellipticity. As can be seen, the bar fraction does not vary with ellipticity, so there is no clear inclination-dependent bias in our estimates of bar fraction, at least for values of less than 0.25. We will refer to the sample of galaxies with bars larger than 5 kpc as Bar Sample A.
One might worry, however, that by adopting a fixed cut in the physical diameter of the bar, one would be able to identify a larger proportion of the bars present in large galaxies compared to smaller ones. Another possibility is to adopt a fixed cut on . We have examined the distribution of the diameters of the galaxies in our sample. We find a lower limit of of around 16 kpc, corresponding to the diameter of the most compact galaxies with stellar masses of . We have therefore constructed a second sample of barred galaxies with , which we will refer to as Bar Sample B.
In total, we identify 1555 barred galaxies with kpc ( of the original sample of 3757 galaxies), of which 827 () have . We note that a similar fraction was found by Marinova & Jogee (2007) and Jogee et al. (2004) when a similar cut in bar size and bar ellipticity was applied. Bar Sample B contains 506 galaxies, and 363 of them have . In general, Bar Sample B is most robust for investigating how the fraction of bars depends on galaxy structural parameters, such as stellar surface mass density or concentration. Bar Sample A is most useful for investigating the fraction of central starbursts that were triggered by bar-induced inflows.
Another issue that may potentially bias our results is that if the galaxy has a bulge, it may be more difficult to measure the shape of the bar by means of the ellipse-fitting technique. The bulge will make the surface brightness contours of the galaxy rounder, causing to be under-estimated. As a result, some barred galaxies will then be missing from our sample. One way we can quantify this effect is through simulations, which are described in detail in Appendix A. The main conclusion of this study is that the identification of “strong bars” with is reasonably robust to the presence of a bulge. The interested reader is referred to the Appendix for more details. In the rest of the paper, our conclusions will be based on the analysis of bars with .
2.3 Control samples
There have been many papers that have found that barred spiral galaxies have higher central star formation rates than un-barred spirals (de Jong et al., 1984; Devereux, 1987; Hawarden et al., 1986; Ho & Filippenko, 1997; Martin & Jean-René, 1994; Puxley et al., 1988; Zaritsky et al., 1994). The enhancement is more pronounced for strongly barred galaxies than for weakly barred galaxies (Ho & Filippenko, 1997; Martin, 1995; Martin & Jean-René, 1994).
It should be noted that the star formation rates in both barred and un-barred galaxies vary strongly as a function of their structural parameters, such as concentration and stellar mass surface density. If we wish to quantify the enhancement in central star formation rate accurately, we need to create control samples that are closely matched with the barred galaxy sample in these parameters.
For each barred galaxy from Sample A, we search the parent sample for a matching galaxy (selected without regard to whether or not it has a bar) with stellar mass difference less than 0.15, stellar surface mass density difference less than 0.1, and colour difference less than 0.1.
2.4 Photometry of bars and pseudo-rings
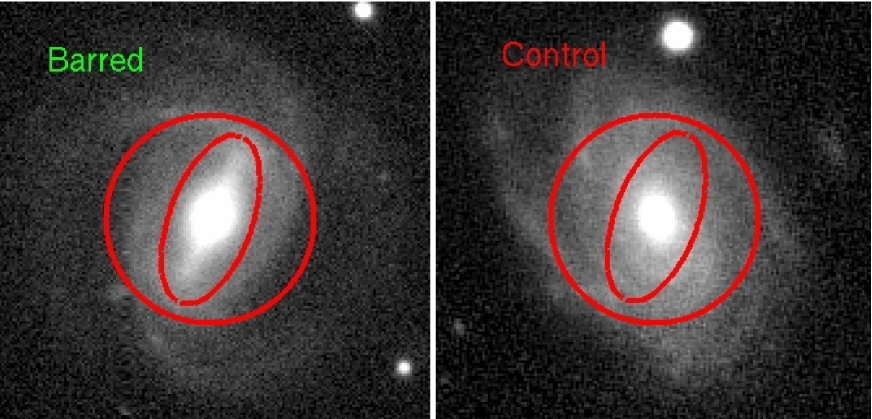
As described in Section 2.2, the outer end of a bar is defined as the point where the ellipticity profile reaches its maximum. From now on, we will refer to the region within the ellipse enclosing the end of the bar as the “barred region” of the galaxy. According to the simulations of Athanassoula (1992), gas will flow from the end of the bar towards the center of the galaxy, following a curved path which is determined by the strength of the bar and the central mass density of the galaxy. The region of the galaxy that we define to be barred will cover the path of the inflowing gas until it condenses into a ring at the inner Lindblad resonance (see Figure 3).
We also define an outer ellipse with ellipticity equal to that of the disk measured at its 25 isophote in the -band and with major axis equal to . The “pseudo-ring” region of the galaxy is the defined as the region between the ellipse enclosing the barred region of the galaxy, and this outer ellipse. The motivation for defining such a ring is that an ultra-harmonic resonance ring in disk galaxies is often found at the end of the bar (Athanassoula et al., 2009, 2009b, 2010; Regan et al., 2002; Regan & Teuben, 2003). Gas will tend to accumulate in this ring and if the density reaches high enough values, stars will form. These outer resonance rings are usually aligned parallel to the bar and may extend out to the corotation radius of the disk (Buta et al., 2010; Schwarz, 1981). The “pseudo ring” region defined in this study is thus designed to cover the location of potential resonance rings in our galaxies.
For each barred galaxy in our sample, we measure the SDSS colour within the barred region and within the ”pseudo ring” region. We also measure colours within the same regions in the corresponding control galaxy, even though these systems often do not have bars see the right panel of figure 3). (Note that when we define the corresponding barred and pseudo-ring regions of the control galaxy, we scale the major and minor axes of both regions by the ratio (control galaxy)(barred galaxy), so that the outer radii of the two systems match exactly)111We test two ways of measuring colour from a “barred region” (defined by the barred galaxy) in the control galaxy. In the first way, we do not change the orientation of a “barred region” and in the second way, we orientate the “barred region” so that its major axis points to the same direction as the major axis of the disk. These two types of colour measurements yield very similar results. In what follows, we present results using the first set of colour measurements.. We will compare the colours between the barred galaxies and control galaxies in Section 3.2.
All the colours in the barred and ‘pseudo ring” regions are corrected for dust attenuation using the average of the central attenuation and the global attenuation. The central attenuation is derived from the Balmer decrement measured from the SDSS fibre spectrum. We have assumed a Calzetti et al. (2000) extinction curve and the line-to-continnum attenuation ratio from Wild et al. (2011). We apply a dust correction when both the H and H fluxes have . If the emission lines are too weak to measure the Balmer decrement, we adopt from the measurements of the attenuation of the stellar continuum of the galaxy provided in the MPAJHU catalog (tauv_cont). This parameter is obtained by fitting Bruzual & Charlot (2003) population synthesis models to the stellar continuum; the reddening may then be estimated by determining the extra “tilt” that must be applied to the models in order to fit the shape of the observed spectrum. The global attenuation is derived using SED-fitting techniques.
3 Results
3.1 Establishing a link between strong bars and enhanced central star formation in galaxies
As discussed in Section 2.3, we have constructed a control sample with the same stellar masses, structural properties and global colours as the barred galaxies. By examining whether the central star formation rates are enhanced in the barred galaxy sample when compared to the controls, we can test whether there is a causal link between bars and central starbursts. By binning the barred galaxy sample and the control sample according to stellar mass, stellar surface density and morphological type, we ascertain to what extent the degree of central star formation enhancement is influenced by global galaxy properties.
In this paper, we use the quantity sSFRsSFRtot, which we will denote C(SF), as a measure of how concentrated the star formation is in a galaxy: sSFRfib is the specific SFR measured within the 3 arcsec SDSS fiber, and sSFRtot is the global specific star formation rate of the galaxy.
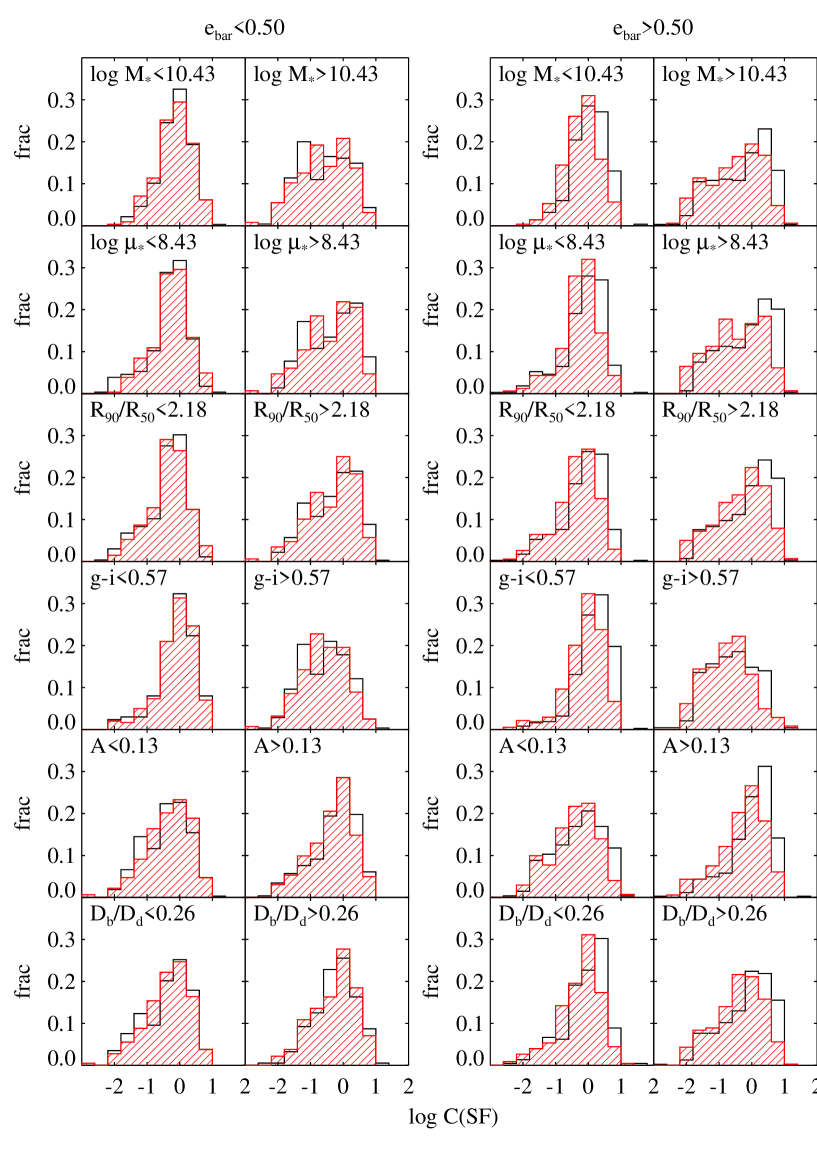
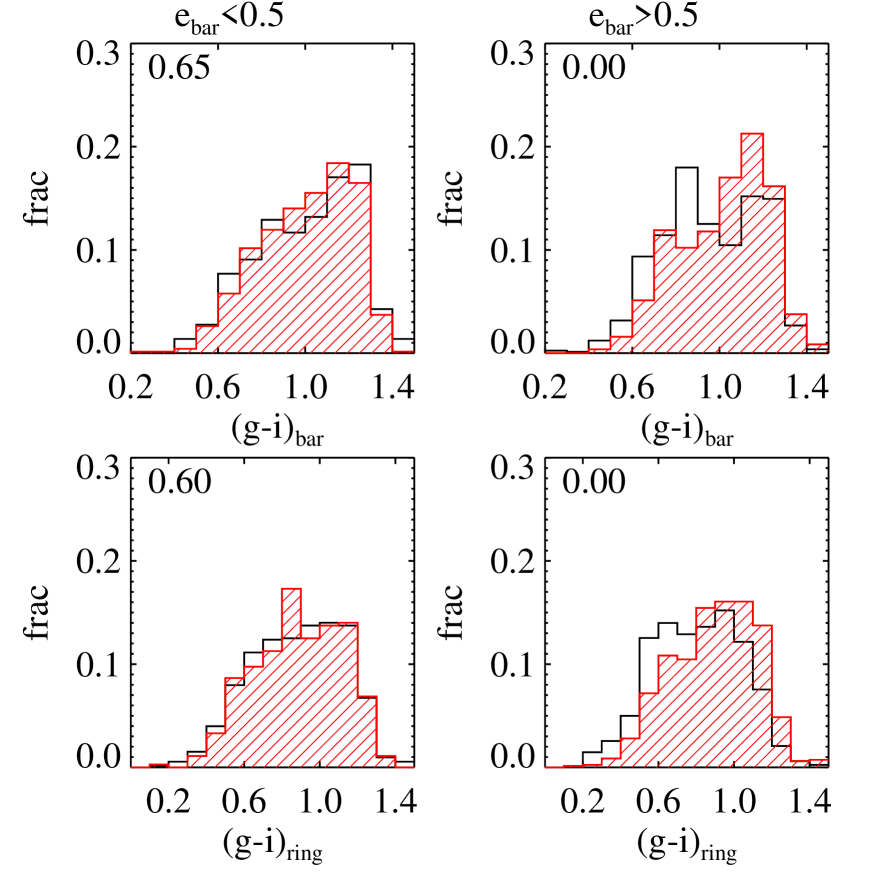
In Figure 4, we compare the distribution of C(SF) for our barred galaxies (shown as black histograms on the plot) and control galaxies (red dashed histograms). The two columns on the left show results for galaxies with weak bars (), while the columns on the right are for strong bars (). Each row in the figure shows results for galaxies split according to a set of global galaxy properties that include stellar mass, stellar surface mass density, concentration parameter, colour, galaxy asymmetry index , and ratio of the diameter of the bar to that of the disk (). In each case, the split is made at the median value of the parameter under investigation. The difference in the average C(SF) and Kolmogorov-Smirnov probability for the barred and control galaxies for each sub-sample in each plot are sumarized in Table 1.
Our conclusion is very simple. For each of the parameters shown in the two left-hand panels (), there is no significant difference between the black and red histograms, i.e., there are no significant differences between the barred and the control samples. For each of the parameters shown in the two right-hand panels (), the differences ara very significant. This shows that only strong bars are capable of inducing enhanced central star formation in galaxies. In the right two panels, the offset between the black and red histograms is roughly the same for each parameter. This shows that the global galaxy properties considered here do not play a significant role in determining the degree of central star formation enhancement caused by bar-driven inflows.
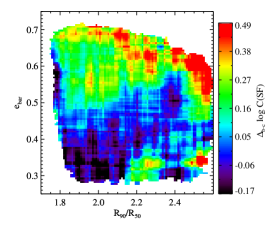
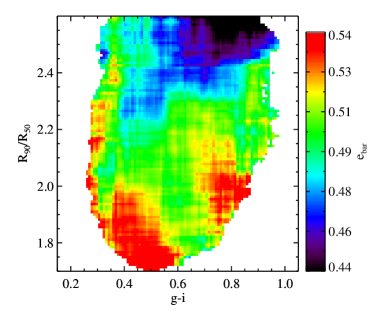
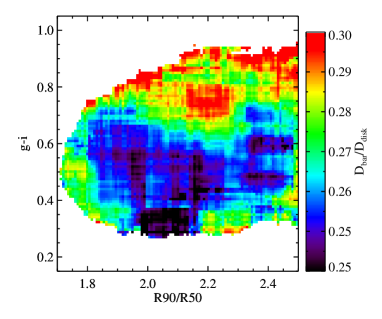
In the left panel of Figure 5, we show how the degree of central star formation enhancement depends on both and on the concentration index of the galaxy (note that the concentration index is a simple measure of bulge-to-disk ratio). We plot contours of C(SF) in the plane of versus R90/R50, where C(SF) is the difference in [sSFRsSFRtot] for the barred galaxies and the controls. We see that when , C(SF) is positive, indicating that star formation is more concentrated in the barred galaxies. When , star formation in barred galaxies and control galaxies are similarly concentrated.
We note that there is an apparent deficit of galaxies with large concentrations and with high values of in Figure 5. As discussed in Appendix A, one possible reason for this is because will be systematically underestimated in galaxies with larger bulge-to-disk-ratios. In Figure A2, we see that is underestimated by about 0.1-0.15 when , which agrees well with the observed deficit. After taking this bias into account, we conclude that there is no clear evidence that strong bars are less efficient at channeling gas to the central regions of galaxies if a bulge component is already present. On the other hand, Figure 5 show that the degree of central star formation enhancement appears to be smaller in strongly barred galaxies with low central mass concentration (), in agreement with simulation results from (Athanassoula, 1992) and Sheth et al. (2000).
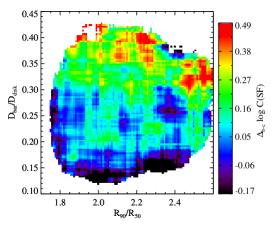
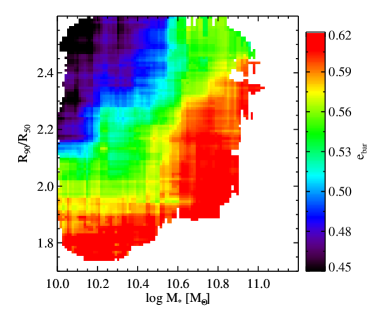
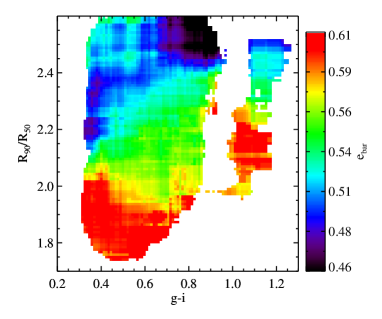
In the the middle panel of Figure 5, we investigate whether the degree of central star formation enhancement exhibits any dependence on the length of the bar relative to that of the disk. We plot C(SF) in the plane of versus concentration index. We see that C(SF) is somewhat higher when . We note however, that this effect is mainly due to the fact that the size of the bar is correlated with its ellipticity. This is clearly demonstrated in the right panel of the figure, which shows contours of C(SF) in the versus plane. The main dependence of C(SF) is on and not on .
In summary, we find that the central star formation enhancement depends mainly on the ellipticity of the bar, and not on the size of the bar or on the mass or structure of the host galaxy.

| X | ||||||||
|---|---|---|---|---|---|---|---|---|
| KS prob | KS prob | KS prob | KS prob | |||||
| 0.03 | 0.14 | -0.01 | 0.34 | 0.23 | 0.00 | 0.19 | 0.00 | |
| -0.04 | 0.75 | 0.07 | 0.32 | 0.11 | 0.00 | 0.32 | 0.00 | |
| -0.03 | 0.84 | 0.05 | 0.41 | 0.19 | 0.00 | 0.23 | 0.00 | |
| -0.00 | 0.93 | 0.03 | 0.46 | 0.26 | 0.00 | 0.12 | 0.09 | |
| -0.03 | 0.47 | 0.08 | 0.06 | 0.11 | 0.02 | 0.29 | 0.00 | |
| -0.01 | 0.40 | 0.06 | 0.82 | 0.17 | 0.00 | 0.23 | 0.00 | |
3.2 Bar and pseudo-ring colours
In this section, we compare the colours of the barred and pseudo ring regions in the barred and control galaxy samples. As shown in the previous section, the degree of central star formation depends prinarily on ellipticity, so we simply split the sample at . The left panels of Figure 6 show that the colours in the barred and pseudo-ring regions do not differ significantly from those measured in the control samples when . Much stronger differences are found when . These results imply that the enhanced central star formation extends well beyond the central region of the galaxy when the bar is strong. Enhanced star formation is found in regions where gas is likely to flow inwards, as well as in the outer regions of the galaxy, where gas is compressed by the resonance.
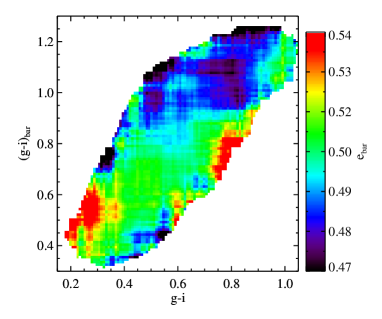
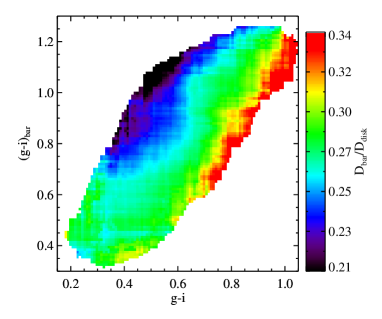
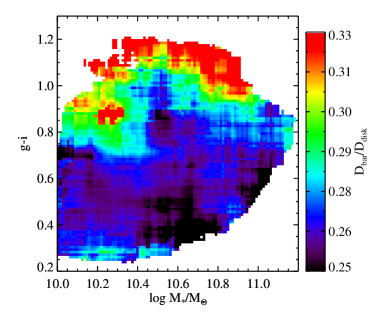
Finally, in the left panel of Figure 7, we examine how the average ellipticity of the bar varies as a function of location in the plane of bar colour versus global galaxy colour. As can be seen, if the barred region of the galaxy is blue, then a strong bar is generally located within it (note that the “noise” in the plot probably arises because the barred region only traces the gas inflow region in an approximate way). On the other hand, there is no obvious effect seen as a function of the global colour of the galaxy. In the right panel, we examine how varies as a function of the same two parameters. In contrast to the results obtained for , the size of the bar (scaled to that of the disk) does not correlate with the colour of the bar, but scales strongly as a function of the global colour of the galaxy. The reddest galaxies host the longest bars. We will discuss possible explanations for this result in Section 4.
3.3 Fraction of galaxies with strong bars
In this section, we examine how the fraction of disk galaxies with strong bars (i.e. galaxies having ) varies as a function of stellar mass, stellar mass surface density, and concentration. We show results for bar samples A and B. Sample A, which includes all galaxies with bars larger than a physical size of 5 kpc, is useful for deriving a stronger lower limit to the fraction of galaxies with strong bars. Sample B, which include only those galaxies with , should yield unbiased trends in strong bar fraction as a function of parameters such as stellar surface mass density, which scale with the size of the galaxy.
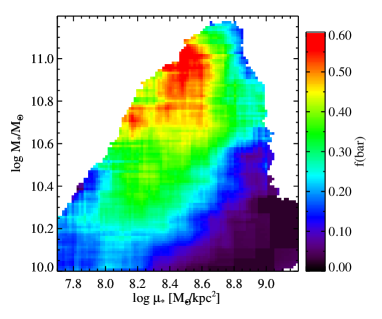
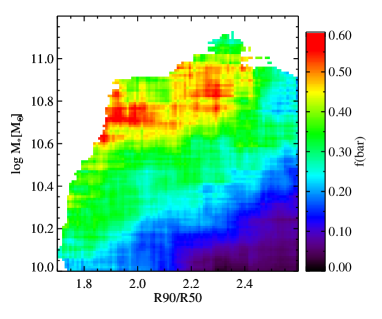
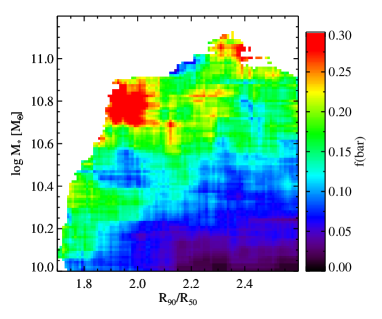
In the top row of Figure 8, we plot contours of strong bar fraction from Bar Sample A in the plane of stellar mass versus stellar surface mass density (left), and stellar mass versus concentration index (right). The fraction of galaxies with strong bars exceeds 0.5 for galaxies with with low stellar mass surface densities () and low concentrations (). For lower mass galaxies, the strong bar fraction is a factor of two smaller, but also peaks at low stellar surface densities and concentrations.
In the bottom row of Figure 8, we show results for sample B. The strong bar fractions are lower and the plots are noisier, but the same qualitative trends are apparent. We conclude, therefore, that the bar-driven mode of bulge formation appears to be most ubiquitous in massive, disk-dominated galaxies at the present day.
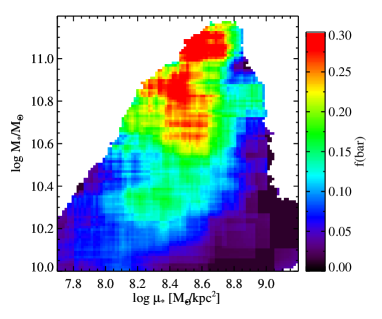
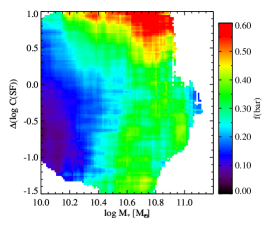
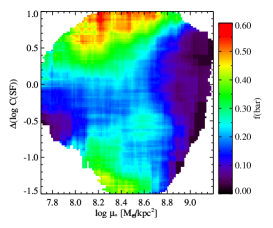
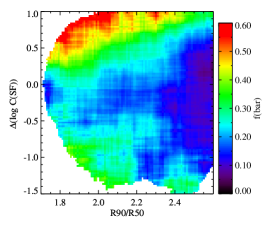
Finally, in Figure 9 we plot contours of strong bar fraction in the plane of C(SF) versus stellar mass, stellar surface mass density, and concentration parameter. This plot should tell us whether strong bars are not only a sufficient condition for enhanced central star formation in galaxies, but whether they are also necessary condition. Note that in this plot, C(SF)) is defined as C(SF) minus the average value for all galaxies with similar stellar mass mass surface density and concentration from the “parent sample”: positive values indicate that star formation is more concentrated than average, negative values that it is less concentrated.
We see from the top row of the figure that the strong bar fraction peaks in galaxies with the most concentrated star formation and with stellar masses greater than , stellar surface densities less than kpc-2, and concentration parameters less than . The peak strong bar fraction is around 0.5. This implies that although bar-driven inflows constitute a major channel for inducing enhanced central star formation in disk-dominated galaxies, they are not the only process at work. As shown by Li et al. (2008); Reichard et al. (2009), galaxies with close companions and lopsided galaxies also have enhanced star formation rates. We note that in the highest surface density galaxies, bars appear to play no role at all in inducing enhanced central star formation.
Very interestingly, there appears to be a secondary peak in the fraction of strong bars in galaxies with the same stellar masses, stellar surface densities and concentrations, but with central star formation rates that are significantly below average. In other words, there also appears to be a population of quenched galaxies with strong bars. This is consistent with the finding in Sheth et al. (2005) that some barred spirals have nuclear regions that are deficient in gas.
This result raises the question as to whether central starbursts produced by bar-driven inflows play any role in shutting down star formation in some galaxies, either by using up the available gas more quickly, or by generating winds/outflows that expel the gas from the central regions of these systems. We find no enhancement of optical or radio AGN fraction in this population, which suggests that starburst-driven processes may be at work. Another possible explanation is that the gas has simply been consumed and that the galaxies are in temporarily quiescent state. This will be the subject of a future investigation.
Finally, we note that for the low density, low concentration galaxy population ( kpc-2, ), the strong bar fraction is smallest when there is no enhancement in central star formation rate. This is consistent with the idea that in the absence of any dynamical perturbations, the star formation rates in present-day disk galaxies are regulated by accretion from the surrounding halo (e.g. Kauffmann et al 1993). Bar-driven inflows then play a key role in regulating the rate at which the accreted gas in consumed into stars.
3.4 The relation between bar properties and global galaxy properties
In Figure 10 and Figure 11, we examine how and depend on global galaxy properties such as stellar mass, concentration index and colour.
The left panels of Figure 10 show that more massive and less concentrated galaxes tend to have stronger bars. This is in agreement with results discussed previously, showing that the fraction of galaxies with strong bars peaks for massive, disk-dominated galaxies (see Appendix for a discussion about bulge contamination). The right panel shows that at a fixed concentration, there does not appear to be any direct connection between and global colour. Once again, results for Bar Sample A and B are qualitatively very similar.
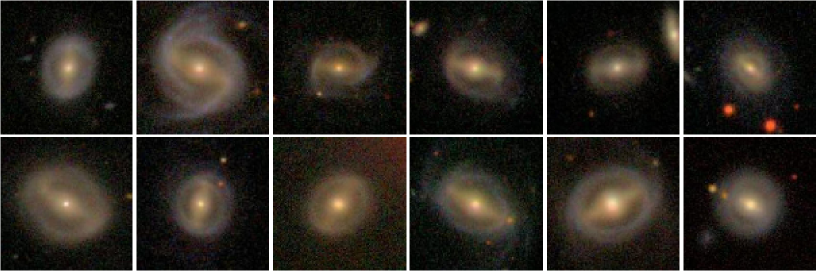
In Figure 11, we again see that is strongly correlated with global colour. At a fixed stellar mass or concentration, redder galaxies have higher bar-to-disk size ratios. In some extreme cases, the whole galaxy consists of a long bar and a surrounding ring. These galaxies are almost all red. Figure 12 shows a compendium of SDSS images of such galaxies. It is interesting to note that at a fixed colour, does not vary as a function of concentration or stellar mass.
In summary, is correlated with both stellar mass and structural parameters such as concentration, but not with global colour. is very strongly correlated with global colour, and only weakly correlated with mass and structural parameters.

4 Summary and Discussion
We have identified 1555 galaxies with bars longer than 5 kpc in a sample of 3757 face-on disk galaxies with stellar masses greater than and redshifts in the range drawn from the seventh data release of the Sloan Digital Digital Sky Survey. We have measured the ellipticity, length and colour of the bars and have explored the relationship between global galaxy properties, bar properties, and enhanced central star formation in galaxies.
Our main conclusions may be summarized as follows:
-
1.
Only strong bars with ellipticity greater than 0.5 result in enhanced central star formation in galaxies. This result holds for all galaxies, regardless of their stellar mass, stellar surface mass density or bulge-to-disk ratio. (Section 3.1, Figure 4)
-
2.
Strong bars tend to have blue colours, and are surrounded by a blue outer ring. This indicates that the enhanced star formation is occurring on the scale of the bar itself. (Section 3.2, Figure 6)
-
3.
The incidence of strong bars is highest for massive galaxies with low surface mass densities and concentrations, reaching values as high as 60% for galaxies with stellar masses greater than , stellar surface densities less than and concentration indices less than . (Section 3.3, Figure 8)
-
4.
Within this population, the incidence of strong bars appears to be bimodal. The fraction of bars is highest for galaxies with central star formation rates that are factor of 2-3 higher than the average. There is a secondary peak in strong bar fraction for galaxies with central star formation rates that are more than a factor of 10 lower than average. (Section 3.3, Figure 9)
-
5.
There is no correlation between the ellipticity (or strength) of the bar and the global colour of the galaxy. There is a strong correlation between the size of the bar and the global colour of the galaxy.
4.1 Relation of this work to other recent studies of bars in large galaxy samples
There have been a number of studies focusing on how the fraction and properties of bars varies as a function of Hubble type, or parameters such as stellar mass. Because most galaxy properties are strongly correlated, it is difficult to identify which is the primary parameter in many of these correlations. Our approach of analyzing the properties of bars in two-dimensional projections of different galaxy parameters helps us differentiate primary from secondary correlations.
Marinova et al. (2009) (M09) found an increasing bar fraction as a function of galaxy luminosity and stellar mass, consistent with our results. Barazza et al. (2008) (B08) found the opposite trend. However, our trends in bar fraction as a function of concentration index are consistent with B08. but at odds with M09. The main reasons for these discrepancies are the very different sample definitions (see discussion in Nair & Abraham, 2010). We note that the analysis in this paper has been carried out for a volume-limited sample of galaxies with stellar masses greater than , so the statistics presented in this paper should not suffer from any sample selection biases.
Laurikainen et al. (2007) found that does not vary as a function of Hubble type, Whyte et al. (2002) and Aguerri et al. (2009) found a tendency for later-type galaxies to have higher , while Martin (1995) found a tendency for early-type galaxies to have higher . Our result show a possible explanation for these discrepancy from different studies: early-type galaxies are both more massive and more concentrated than late-type galaxies, while we show that the trend of varying with stellar mass is contrary to the trend with concentration. We have chosen to bypass Hubble type altogether, focusing instead on conecntration index and stellar surface densities as parameters that have a simpler physical interpretation.
There have been many attempts to link the length of the bar length with the global structure of galaxies. Longer bars were found to correlate with more prominent bulges in early-type galaxies (Aguerri et al., 2009; Athanassoula &Martinet, 1980; Athanassoula, 2003; Erwin, 2005; Martin, 1995). Hoyle et al. (2011) was the first to find that galaxies hosting longer bars also tend to be redder. Our results show that has the tightest correlation with colour and at a fixed colour does not vary with stellar mass or concentration.
There have also been numerous studies of the relation between bars, gas concentration, central star formation rate and metallicity gradients in galaxies, supporting the picture that bars induce gas inflows in galaxies (de Jong et al., 1984; Jogee et al., 2005; Martin, 1995; Martin & Jean-René, 1994; Sakamoto et al., 1999; Sheth et al., 2005; Zaritsky et al., 1994). Recently, Ellison et al. (2011) used a large, visually classified sample to show that barred galaxies with stellar have centrally enhanced star formation rates. This is consistent with our results. No dependence of central star formation enhancement on bar ellipticity was found in Ellison et al. (2011). One possible reason for this discrepancy is that their control sample was only matched in stellar mass, while our control sample was matched in stellar mass, surface mass density and colour. Because the central star formation rates of galaxies depend on all these parameters (and on colour in particular), the Ellison et al. (2011) might not have had the sensitivity to isolate the ellipticity dependence.
Finally, we note that our results are inconsistent with some past findings (Devereux, 1987; Ho & Filippenko, 1997) that late type galaxies do not have significantly enhanced central star formation . One possible reason for this discrepancy is that these studies did not distinguish strongly barred galaxies from weakly barred galaxies. As we have seen, the fraction of galaxies with strong bars peaks at higher stellar masses, so the late-type samples investigated in these older studies may have only contained galaxies with weak bars. We also caution that bar classifications in bulge-dominated galaxies are subject to strong biases. Two dimensional image decomposition techniques that allow the bulge component to be properly subtracted are one obvious way forward (for example, Gadotti, 2009; Weinzirl et al., 2009), but this lies well beyond the scope of this study.
4.2 Comments on the results in this paper
4.2.1 Only bars with induce enhanced central star formation in galaxies
We found that only bars with were able to induce enhanced levels of star formation in the central and bar-dominated regions of the galaxies in our sample. In addition, star formation in the circular region surrounding the bar was also found to be enhanced.
These results are qualitatively consistent with simulations that show that gas inflows are stronger in galaxies with strong bars, because such bars induce stronger torques that pull the gas off their initially circular orbits, causing it to flow towards the center of the galaxy. Some of the inflowing gas will stop outside the corotation radius and form a ring (Athanassoula, 1992; Friedli & Benz, 1993).
Theoretically, the torques induced by the bar are proportional to the mass and to the elongation of the bar, but inversely proportional to the central axisymmetric mass (Combes & Sanders, 1981). Observationally, these three factors correspond to the mass of the bar relative to that of the disk, the bar ellipticity, and the bulge to disk ratio of the galaxy. In order to determine the mass of the bar, we would need to subtract a model for the bulge and the disk of the galaxy, which is beyond the scope of this work. In this study, ellipticity has been used as our measure of bar strength, because it is the more easily accessible observational parameter (Block et al., 2001; Laurikainen et al., 2002; Martinez-Valpuesta et al., 2006).
As the bulge-to-disk ratio increases, the effect of the bar will become weaker (Laurikainen et al., 2007; Whyte et al., 2002). Parameterizing bar strength in terms of for all galaxies, independent of their bulge-to-disk ratio, does not take this effect into account. However, as we have discussed, will be underestimated by our ellipse-fitting method in bulge-dominated galaxies. These two effects may somehow conspire to make an excellent predictor of central star formation enhancement, but we admit that further simulation studies are required to make a more detailed interpretation of our results
4.2.2 The fraction of strong bars in galaxies with central starbursts is peaked at value of
Tidal interactions are another obvious mechanism for inducing enhanced central star formation in galaxies (Cox et al., 2008; Bournaud et al., 2007). Li et al. (2008) found that of SDSS galaxies with the highest central specific star formation rates estimated have a close companion within a projected radius of 100 kpc). Li et al. (2009) showed that barred galaxies do not have an excess of close companions Marinova et al. (similar results were also found by also found by 2009); Barazza et al. (similar results were also found by also found by 2009). In our study, we have excluded interacting and merging galaxies from the “parent sample” in order to ensure that the ellipse fitting procedure delivers robust results.
In summary, our main conclusion seems to be that bars and galaxy-galaxy interactions are independent phenomena that together could explain most of the central starbursts in galaxies in the local Universe.
4.2.3 The size of the bar is strongly correlated with the global colour of the host galaxy
Simulation results indicate that once a bar is formed, it will rapidly slow down and grow longer as angular momentum is transfered to the bulge and to the halo. On the other hand, if gas continues to accrete onto the galaxy, the gas may transfer angular momentum to the bar, thereby re-accelerating it. This suppresses that growth of the bar and can even cause it to become shorter (Athanassoula, 2002, 2003; Berentzen et al., 2007; Curir et al., 2007; Debattista & Sellwood, 2000; Friedli & Benz, 1993; Villa-Vargas et al., 2010; Weinberg, 1985). Given that there is a tight correlation between colour and HI gas fraction in galaxies (Catinella et al., 2010), our results suggest that the observation effect may come about because the size growth of the bar is being regulated by gas accretion in galaxies. Red galaxies have not had a gas accretion event for many Gyr, so their bars have been able to grow. The fact that the colour of the bar and the size of the bar do not correlate, may imply that size of the bar depends on the gas accretion rate integrated over the past history of the galaxy, whereas the colour of the bar depends on the current gas inflow rate.
4.2.4 The incidence of bars peaks in disk-dominated galaxies with high masses and low stellar surface densities
Galaxy formation models in a CDM cosmology predict that disk instabilities represents the dominant contribution to the formation of bulges in massive galaxies with between and (De Lucia et al., 2011). In these studies, bars are assumed to form when disks satisfy the standard Toomre Q-parameter criterion, which has been validated by N-body simulations (Efstathiou et al., 1982):
| (1) |
We find that peaks when is high, in agreement with the (De Lucia et al., 2011) results. However, at fixed stellar mass, f(bar) increases at lower stellar lower surface densities, When or , f(bar) quickly drops to values near 0. This is not easily understood in the context of the formula given above. Athanassoula (2008) has criticized the Efstathiou et al. (1982) criterion, pointing out that it is not of general applicability and should not be used in semi-analytic models. In particular, stellar disks containing gas would be expected to be significantly more unstable than predicted.
Studies have shown that is a special transition point for galaxies in the local Universe. At surface densities lower than this value, galaxies contain significant amounts of gas, but at higher surface densities, the atomic and molecular gas fraction in galaxies drop suddenly in many galaxies (Catinella et al., 2010; Saintonge et al., 2011). A similar transition is seen at . In contrast, the correlation between gas content and stellar mass is not as pronounced. It is thus reasonable to suppose that the fraction of bars may peak at stellar surface densities below in the local Universe, because this currently represents some special instability point for galactic disks. What we are not able to say from these observations, is what role bars have played over the whole history of the Universe in shaping this instability point. In any case, our results do suggest that gas accretion, disk instabilities, structural changes, and quenching of gas and star formation may happen coherently in galaxies. In the present-day Universe, bars are clearly an important regulatory mechanism in the “transition regime” between the blue and the red populations.
Acknowledgements
We thank A. Cooper, T. Heckman, S. Jogee, and S. White et al. for useful discussions.
XK is supported by the National Natural Science Foundation of China (NSFC, Nos. 10633020, and 10873012), the Knowledge Innovation Program of the Chinese Academy of Sciences (No. KJCX2-YW-T05), and National Basic Research Program of China (973 Program; No. 2007CB815404).
GALEX (Galaxy Evolution Explorer) is a NASA Small Explorer, launched in April 2003, developed in cooperation with the Centre National d’Etudes Spatiales of France and the Korean Ministry of Science and Technology.
Funding for the SDSS and SDSS-II has been provided by the Alfred P. Sloan Foundation, the Participating Institutions, the National Science Foundation, the U.S. Department of Energy, the National Aeronautics and Space Administration, the Japanese Monbukagakusho, the Max Planck Society, and the Higher Education Funding Council for England. The SDSS Web Site is http://www.sdss.org/.
References
- Abazajian et al. (2009) Abazajian, K. N., Adelman-McCarthy, J. K., Agüeros, M. A., Allam, S. S., et al., 2009, ApJS, 182, 543
- Aguerri et al. (2009) Aguerri, J. A. L., Méndez-Abreu, J., & Corsini, E. M., 2009, A&A, 495, 491
- Athanassoula &Martinet (1980) Athanassoula E., Martinet L., 1980, A&A, 87, L10
- Athanassoula (1992) Athanassoula, E., 1992, MNRAS, 259, 345
- Athanassoula (2002) Athanassoula, E., 2002, ApJ, 569, 83
- Athanassoula (2003) Athanassoula, E., 2003, MNRAS, 341, 1179
- Athanassoula (2005) Athanassoula, E., 2005, MNRAS, 358, 1477
- Athanassoula (2005b) Athanassoula, E., lambert, J. C., Dehnen, W., 2005, MNRAS, 363,496
- Athanassoula et al. (2009) Athanassoula, E., Romero-Gómez, M., Masdemont, J., 2009, MNRAS, 394, 67
- Athanassoula et al. (2009b) Athanassoula, E., Romero-Gómez, M., Bosma, A., Masdemont, J., 2009, MNRAS, 400, 1706
- Athanassoula et al. (2010) Athanassoula, E., Romero-Gómez, M., Bosma, A., Masdemont, J., 2010, MNRAS, 407, 1433
- Balcells et al. (2003) Balcells, M., Graham, A. W., Domínguez-Palmero, L., & Peletier, R. F., 2003, ApJ, 582, 79
- Barnes & Hernquist (1992) Barnes, J., Hernquist, L., 1992, A&A Rev., 30, 705
- Barazza et al. (2008) Barazza, F. D., Jogee, S., & Marinova, I., 2008, ApJ, 675, 1194
- Barazza et al. (2009) Barazza, F. D., Jablonka, P., Desai, V., Jogee, S., et al., 2009, A&A, 497, 713
- Bell et al. (2003) Bell, E. F., Mclntosh, D. H., Katz, N., Weinberg, M. D., 2003, ApJ, 149, 289
- Benson et al. (2010) Benson et al. 2010, MNRAS, 402, 2321
- Berentzen et al. (2007) Berentzen, I. H., Shlosman, I. Marinez-Valpuesta, I., Heller, C. H., 2007, ApJ, 666,189
- Block et al. (2001) Block, D. L., Puerari, I., Knapen, J. H., Elmegreen, B. G., Buta, R., et al, 2001, A&A, 375, 761
- Bournaud & Combes (2002) Bournaud, F., Combes, F., 2002, A&A, 392,83
- Bournaud et al. (2007) Bournaud, F., Jog, C. J., Combes, F., 2007, A&A, 476, 1179
- Brinchmann et al. (2004) Brinchmann, J., Charlot, S., White, S. D. M., Tremonti, C., Kauffmann, G., 2004, MNRAS, 351, 1151
- Bruzual & Charlot (2003) Bruzal, G., Charlot, S., 2003, MNRAS, 344, 1000
- Bureau & Athanassoula (2005) Bureau, M., Athanassoula, E., 2005, ApJ, 626, 159
- Buta & Crocker (1993) Buta, R., Crocker, D. A., 1993, AJ, 105, 1344
- Buta et al. (2010) Buta, R., Laurikainen, E., Salo, H., & Knapen, J. H., 2010, ApJ, 721, 259
- Catinella et al. (2010) Catinella, B., Schiminovich, D., Kauffmann, G., Fabello, S., Wang, J., et al., 2010, MNRAS, 403, 683
- Calzetti et al. (2000) Calzetti, D., Armus, L., Bohlin, R. C., Kinney, A. L., Koornneef, J., Storchi-Bergmann, T., 2000, ApJ, 533, 682
- Combes (1981) Combes, F., 1981, A&A, 96, 164
- Combes & Sanders (1981) Combes, F., & Sanders, R. H., 1981, A&A, 96, 164
- Comerón et al. (2010) Comerón, S., Knapen, J. H., Beckman, J. E., et al., 2010, MNRAS, 402, 2462
- Conselice et al. (2003) Conselice, C. J. Bershady, M. A., Dickinson, M., Papovich, C., 2003, AJ, 126, 1183
- Couch et al. (1998) Couch, W. J., Barger, A. J., Smail, I., Ellis, R., & Sharples, R. M., 1998, ApJ, 497, 188
- Cox et al. (2008) Cox, T. J., Jonsson, P., Somerville, R. S., Primack, J. R., Dekel, A., 2008, MNRAS, 384, 386
- Curir et al. (2007) Curirs, A., Mazzei, P., Murante, G., 2007, A&A, 467, 509
- de Jong et al. (1984) de Jong, T., Clegg, P. E., Rowan-Robinson, M., Soifer, B. T., Habing, H. J., Houck, J. R., 1984, ApJ, 278, 67
- De Lucia et al. (2011) De Lucia, G., Fontanot, F., Wilman, D., Monaco, P., 2011, MNRAS, 414, 1439
- Debattista et al. (2006) Debattista, V. P., Mayer, L., Carollo, C. M., 2006, ApJ, 645, 209
- Debattista & Sellwood (2000) Debattista, V. P., Sellwood, J. A., 2000, ApJ, 543, 704
- Devereux (1987) Devereux, N., 1987, ApJ, 323, 91
- di Matteo et al. (2007) di Matteo, S., Combes, F., Melchior, A. L., Semelin, B., 2007, A&A, 468,61
- Efstathiou et al. (1982) Efstathiou, G., Lake, G., Negroponte, J., 1982, MNRAS, 199, 1069
- Ellison et al. (2011) Ellison, S. L., Nair, P., Patton, D. R., Scudder, J. M. S., Mendel, J. T., Simard, L., 2011, submitted to MNRAS, (arXiv:1106.1177)
- Erwin (2005) Erwin, P., 2005, MNRAS, 364, 283
- Fasano et al. (2000) Fasano, G., Poggianti, B. M., Couch, W. J., Bettoni, D. et al. 2000, ApJ, 542, 673
- Friedli & Benz (1993) Friedli, D., Benz, W., 1993, A&A, 268, 65
- Gadotti & de Souza (2003) Gadotti, D. A., de Souza, R. E., 2003, ApJ, 583, 75
- Gadotti (2009) Gadotti, D. A., 2009, MNRAS, 393, 1531
- Hawarden et al. (1986) Hawarden, T., Mountain, C., Leggett, S., Puxley, P., 1986, MNRAS, 221, 41
- Ho & Filippenko (1997) Ho, L. C., Filippenko, V., 1997, ApJ, 487, 591
- Hoyle et al. (2011) Hoyle, B., Masters, K. L., Nichol, R. C., Edmondson, E. M., Smith, A. M., 2011, Accepted by MNRAS(arxiv:1104.5394)
- Jogee et al. (2004) Jogee, S., Barazza, D., Hans-Walter, R., Shlosman, I., & Barden, M., et al., 2004, ApJ, 615, 105
- Jogee et al. (2005) Jogee, S., Scoville, N., Kenney, J. D. P., 2005, ApJ, 630, 837
- Knapen et al. (2000) Knapen, J. ,Shlosman, I., Peletier, R., 2002, ApJ, 529, 93
- Knapen et al. (2002) Knapen, J. , Pérez-Ramírez, D., Laine, S., 2002, MNRAS, 337, 808
- Kormendy & Kennicutt (2004) Kormendy, J., Kennicutt, C., 2004, A&A Rev., 42. 603
- Kovač et al. (2010) Kovač, K, Lilly, S. J., Knobel, C. Bolzonella, M., Iovino, A., 2010, ApJ, 718, 86
- Laine et al. (2002) Laine, S., Shlosman, I., Knapen, J. et al. 2002, ApJ, 567, 97
- Laurikainen et al. (2002) Laurikainen, E., Salo, H., Rautiainen, P., 2002, MNRAS, 331, 880
- Laurikainen & Salo (2002) Laurikainen , E., Salo, H., 2002, MNRAS, 337, 1118
- Laurikainen et al. (2007) Laurikainen , E., Salo, H., Buta, R., Knapen, J. H., 2007, MNRAS, 381, 401
- Li et al. (2009) Li, C., Gadotti, D. A., Mao, S., Kauffmann, G., 2009, MNRAS, 397, 726
- Li et al. (2008) Li, C., Kauffmann, G., Heckman, T. M., Jing, Y. P., & White, S. D. M., 2008, MNRAS, 385, 1903
- Marinova & Jogee (2007) Marinova, I., Jogee, S., 2007, ApJ, 659, 1176
- Marinova et al. (2009) Marinova, I., Jogee, S., Heiderman, A., Barazza, F. D.,Gray, M. E. et al., 2009, ApJ, 698, 1639
- Martin & Roy (1994) Martin, P., Roy, J., 1994, ApJ, 424, 599
- Martin etl al. (2005) Martin, D. C., et al., 2005, ApJ, 619, L1
- Martin (1995) Martin, P., 1995, ApJ, 109,6
- Martin & Jean-René (1994) Martin, P., & Jean-René, R., ApJ, 424, 599
- Martinet & Friedli (1997) Martinet, L., Friedli, D., 1997, A&A, 323, 363
- Martinez-Valpuesta et al. (2006) Martinez-Valpuesta, I., Shlosman, I., Heller, C., 2006, ApJ, 637,214
- Menéndez-Delmestre et al. (2007) Menéndez-Delmestre, K., Sheth, K., Schinnerer, E., et al. 2007, ApJ, 657, 790
- Mihos & Hernquist (1996) Mihos, J. C., Hernquist, L., 1996, ApJ, 464,641
- Nair & Abraham (2010) Nair, P. B., & Abraham, R. G., 2010, ApJ, 714, 260, (NA10)
- Parry et al. (2009) Parry et al.2009, MNRAS, 396, 1972
- Piner et al. (1995) Piner, B., Glenn, S., James, M., Teuben, P. J., 1995, ApJ, 449, 508
- Puxley et al. (1988) Puxley, P., Hawarden, T., Mountain, C., 1988,MNRAS, 231, 465
- Quillen et al. (1995) Quillen, A. C., Frogel, J. A., Kenney, J. D. P., et al., 1995, ApJ, 441, 549
- Reichard et al. (2009) Reichard, T. A., Heckman, T. M., Rudnick, G., Brinchmann, J., Kauffmann, G., Wild, V., 2009, ApJ, 691, 1005
- Regan et al. (1999) Regan, M. et al. 1999, ApJ, 526, 97
- Regan et al. (2002) Regan, M. W., Sheth, K., Teuben, P. J., Vogel, S. N., 2002, ApJ, 574, 126
- Regan & Teuben (2003) Regan, M. W., Teuben, P., 2003, ApJ, 582, 723
- Regan & Teuben (2004) Regan, M. W., Teuben, P. J., ApJ, 600, 595
- Sakamoto et al. (1999) Sakamoto, K., Okumura, S. K., Ishizuki, S., Scoville, N. Z., 1999, ApJ, 525, 691
- Saintonge et al. (2011) Saintonge, A., Kauffmann, G., Wang, J., Kramer, C., Tacconi, L., 2011, accepted for publication in MNRAS
- Schwarz (1981) Schwarz, M. P., 1981, ApJ, 247, 77
- Schinnerer et al. (2002) Schinnerer, E., Maciejewski, W., Scoville, N., Moustakas, L. A., 2002, ApJ, 575, 826
- Schinnerer et al. (2003) Schinnerer, E., Böker, T. , Meier, D. et al., 2003, ApJ, 591, L115
- Sheth et al. (2000) Sheth, K., Regan, M. W., Vogel, S. N., et al., 2000, ApJ, 532, 221
- Sheth et al. (2002) Sheth, K., Vogel, S. N., Regan, M. W., et al., 2002, AJ, 124, 2581
- Sheth et al. (2003) Sheth, K., Regan, M. W., Scoville, N. Z., Strubbe, L. E., 2003, ApJ, 592, 13
- Sheth et al. (2005) Sheth, K., Vogel, S. N., Regan, M. W., Thornley, M. D., & Teuben, P. J., 2005, ApJ, 632, 217
- Sheth et al. (2008) Sheth, K., Elmegreen, D. M., Elmegreen, B. G., Capak, P., Abraham, R. G., et al., 2008, ApJ, 675, 1141
- Toomre & Toomre (1972) Toomre, A., & Toomre, J., 1972, ApJ, 178, 623
- Toomre (1977) Toomre, A., In The Evolution of Galaxies and Stellar Populations, ed. BM Tinsley, RB Larson, p. 401. New Haven: Yale Univ. Obs.
- Villa-Vargas et al. (2010) Villa-Vargas, J., Shlosman, I., Heller, C., 2010, ApJ, 719, 1470
- Wang et al. (2011) Wang, J., Kauffmann, G., Overzier, R., Catinella, B., Schiminovich, D., 2011, MNRAS, 412, 1081
- Wild et al. (2011) Wild, V., Charlot, S. Brinchmann, J., Heckman, T., Vince, O., Pacifici, C., Chevallard, J., 2011, submitted to MNRAS(arXiv1106.1646)
- Weinberg (1985) Weinberg, M. D., 1985, MNRAS, 213, 451
- Weinzirl et al. (2009) Weinzirl, T., Jogee, S., Khochfar, S., Burkert, A., Kormendy, J., 2009, ApJ, 696, 411
- Whyte et al. (2002) Whyte, L. F., Abraham, R. G., Merrifield, M. R., Eskridge, P. B., et al., 2002, MNRAS, 336, 1281
- Wyse et al. (1997) Wyse, R. F. G., Gilmore, G., Franx, M., 1997, A&A Rev., 35, 637
- Wozniak et al. (1995) Wozniak et al. 1995, A&A, Suppl., 111, 115
- York et al. (2000) York, D. G. et al. 2000, A&A, 120, 1579
- Zaritsky et al. (1994) Zaritsky, D., Kennicutt, R. C., Huchra, J. P., 1994, ApJ, 420, 87
- Zhang (1999) Zhang, X., 1999, ApJ, 518, 613
- Zurita & Pérez (2008) Zurita, A., Pérez, I., 2008, A&A, 485, 5
Appendix A Tests of our bar identification procedure
In Sect 2.2, we discussed that the existence of prominent bulges will make the elliptical isophotes of galactic bars rounder, causing us to miss bars in bulge-dominated galaxies and under-estimate the bar ellipticity. Here we quantify the affect of bulge contamination on our estimates of ellipticity and bar fraction by simulating the effect of the bulge of our measurements .
First, we select the galaxies with from the original barred sample. According to the formula from Gadotti (2009), corresponds to a bulge mass fraction of less than 14. We use the images of these galaxies as “inputs”, and we then add idealized bulge components onto them as described below. ¿From now on, the bar parameters related to the original images will be referred to as intrinsic and the parameters related to the simulated images will be referred to as the output.
A pseudo bulge is more compact than the classical bulge (Gadotti, 2009), and is thus is more likely to distort the inner isophote of galaxies, so to be conservative, we only simulate pseudo-bulges in this test. We set the stellar mass of the pseudo bulges to range from 0.03 to 1.8 times the stellar mass of the original galaxies. This range is chosen to produce the range of the galaxies in our “parent sample”.
¿From Figure 13 of Gadotti (2009), we estimate log , where and are the effective radius and stellar mass of the pseudo-bulge. We describe the surface brightness of a pseudo-bulge by a sersic profile with index 1.4, , where is the surface brightness at radius , and is the central surface brightness (Kormendy & Kennicutt, 2004). We assume that the -band flux is linearly proportional to the stellar mass (Bell et al., 2003). Integrating the surface brightness profile to get the total flux, is estimated as .
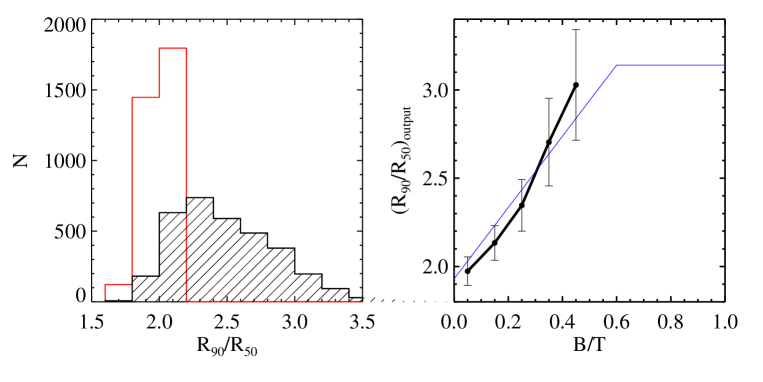
We produce 2000 simulated galaxy images by adding the simulated pseudo-bulge components to the real -band images of the disk-dominated galaxies. The distribution of concentration indices () of the simulated galaxies is shown in Figure 13. We can see that the simulated ranges from 1.8 to 3, and follows the same relation with bulge-to-total mass ratio of the galaxy shown in Gadotti (2009).
We then use the ellipse-fitting method described in Sect. 2.2 to identify and measure bars from the simulated images. We refer to the fraction of bars identified from the simulated images as the output bar fraction (), and the correspondingly measured bar ellipticity as .
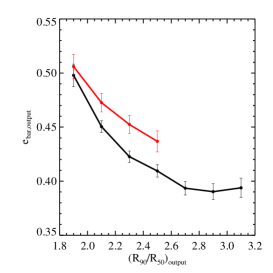
In the left panel of Figure 14, we show how the intrinsic ellipticity of the bar () is under-estimated as the concentration increases. We see that when 1.8, 2.4 and 2.8, is under-estimated by 0.065, 0.15 and 0.18. When , the error in flattens at a value of 0.18.
In the middle panel of Figure 14, we show how the from simulation and the measured from real galaxies vary as a function of concentration . The relation between and (black line) shows the pure bulge contamination effect. We can see that the bulge contamination could be responsible for all the decreasing trend of as a function of . Thus it is unclear whether there is a intrinsic trend that when is lower, is higher.
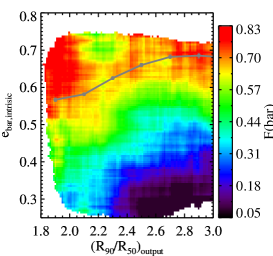
In the right panel of Figure 14, we show the bar verification rate () from the simulated images in the plain of output concentration versus input . We can see that at a fixed , is strongly correlated with input . At , when , only of the barred galaxies are identified. This is expected because we require for a galaxy to be classified as barred. When , of the barred galaxies are identified. When , flattens at a value of about 0.7. Bulge contamination thus results in loss of bars with low values of .
In this study, we focus on galaxies which have . This corresponds to an input that is a weakly rising function of , as shown by the grey curve in the right panel of Figure 14). We see that most of the region above the curve corresponds to values greater than 70%. In the region enclosed by the curve and , can vary from values of around 70% for the less concentrated galaxies to values of around 50% for the more concentrated galaxies. We conclude, therefore, that we are likely correctly identifying between 2/3 and 3/4 of the barred galaxies with intrinsic ellipticities greater than 0.5