Parsec-Scale Jet Behavior of the Quasar 3C 454.3 during the High Gamma-Ray States in 2009 and 2010
Abstract
We analyze total and polarized intensity images of the quasar 3C 454.3 obtained monthly with the VLBA at 43 GHz within the ongoing Boston U. monitoring program of -ray blazars started in June 2007. The data are supplemented by VLBA observations performed during intense campaigns of 2 week duration when the quasar was observed 3 times per campaign. We find a strong increase of activity in the parsec-scale jet of the quasar during high -ray states in December 2009, April 2010, and November 2010. We detect new superluminal knots, K09 and K10, associated with the autumn 2009 and 2010 outbursts, respectively, and compare their kinematic parameters. We analyze optical polarimetric behavior along with polarization parameters of the parsec-scale jet and outline similarities and differences in polarization properties across wavelengths. The results of the analysis support the conclusions that the optical polarized emission is produced in a region located in the vicinity of the mm-wave core of the jet of the quasar, and that the -ray outbursts occur when a superluminal disturbance passes through the core.
I INTRODUCTION
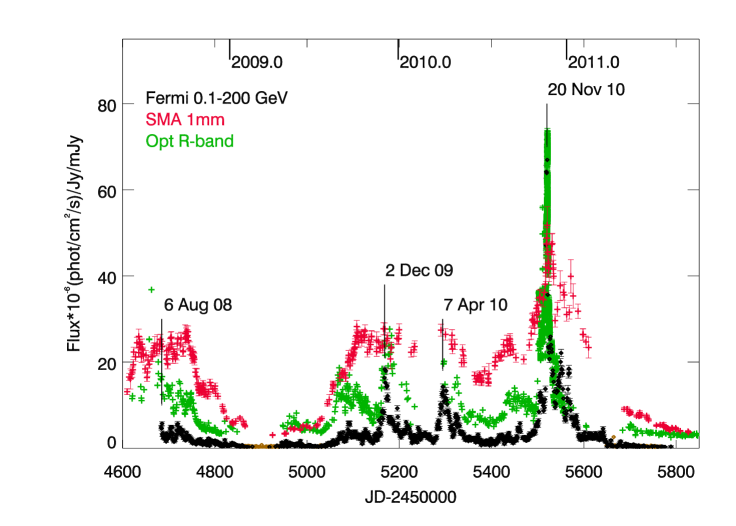
The quasar 3C 454.3 (z=0.859) was extremely active at -ray energies during the three years after the Fermi Large Area Telescope (LAT) started to operate in 2008 Summer. Figure 1 shows the -ray light curve, for energies E100 MeV, of the quasar that we have constructed using PASS 7 Photon and Spacecraft data and the Fermi-LAT ScienceTools software package (ver. v9r23p1) with the P7_V6_DIFFUSE set of instrument response functions. Figure 1 also displays the mm-wave (225 GHz) light curve obtained at the Submillimeter Array (Mauna Kea, Hawaii), as well as the optical light curve in R-band compiled from data from a number of ground-based telescopes. Four major peaks of the -ray emission are seen in Figure 1, corresponding to (I) the 2008 July-August enhanced activity with an average flux 310-6 ph cm-2s-1 (Abdo09, ); (II) the prominent -ray outburst in November-December 2009 when the -ray emission reached F100=22110-6 ph cm-2s-1 (Acker10, ); (III) the strong -ray outburst in April 2010 with F100=16310-6 ph cm-2s-1; and (IV) the gigantic outburst in November-December 2010 with a 3 hr peak F100=85510-6 ph cm-2s-1 (Abdo11, ), which correponds to an apparent -ray luminosity of Lγ=2.10.21050 erg s-1 (H∘=71 km s-1, =0.27, and =0.73).
The -ray spectrum of the quasar is well described by a broken power law with photon index 2.3 below the break frequency 2 GeV and 3.5 above the break (Abdo09, ). During outbursts I-III the -ray spectrum experienced a very moderate hardening when the -ray flux increased (Acker10, ). However, during the last outburst the spectrum showed significant differences between light curves for fluxes F0.1-1GeV and F>1GeV, with a progressive decrease of photon index from 2.35 to 2.1 as the most prominent flares developed. Comparison of the flux measured at 31 Gev with the flux extrapolated from lower energy suggests an upper limit of the photon-photon optical depth 2, which implies that the emission region is located at 0.14 pc from the central engine, which is close to, or beyond, the expected outer boundary of the BLR (Abdo11, ). The short timescale of flux variability (by a factor of 2 over 3 hr) is considered as indication of the origin of the -ray emission region within the BLR(TAV10, ). However, a timescale of the variability constrains the size of the flaring region, not its location.
The multi-frequency behavior of the quasar is complex. There is a strong correlation between long-term variations at optical and -ray frequencies, although the correlation weakens at short timescales (J10, ; RAI11, ; VER11, ). Raiteri et al. (RAI11, ) note that during outbursts I-III the same maximum optical flux was reached and the peaks at mm-waves are also comparable, while the -ray flux was significantly higher during outbursts II & III with respect to I. The authors interpret the optical through mm-wave observations as synchrotron radiation produced in an inhomogeneous jet with a progressive increase of both the size and distance (from the jet apex) of emitting region with wavelength. In this scenario the -ray emission is produced slightly downstream with respect to the optical synchrotron emission region if the synchrotron-self-compton mechanism (SSC) is responsible for -ray production. The -ray outburst IV has prominent counterparts at longer wavelengths (from X-ray to mm-wave) and the peaks of the outburst coincide within 1 day at different frequencies (see Fig. 1). However, the amplitude of -ray variations is significatly higher than those at longer wavelengths. Vercellone et al. (VER11, ) have modeled such behavior by an external Compton component boosted by a local enhancement of soft seed photons.
We monitor 3C 454.3 with the VLBA at 43 GHz in total and polarized intensity and at optical wavelengths in photometric and polarimetric modes. In this paper we add analysis of the parsec-scale jet and polarization behavior during the outbursts II-IV to the multi-frequency studies of the blazar, and thereby tighten constraints on the location of the -ray production.
II Parsec-Scale Jet Kinematics
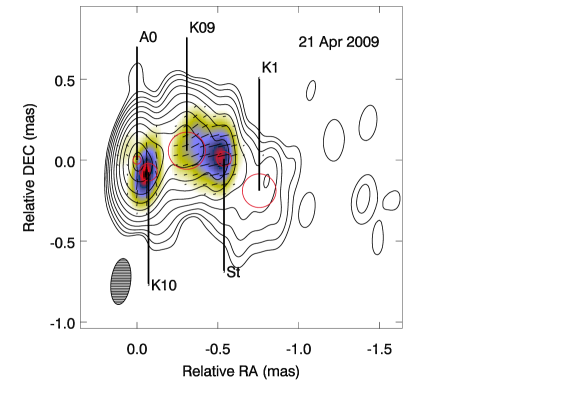
We monitor 3C 454.3 roughly monthly with the VLBA at 43 GHz during 24 hr session of observations of 30 -ray blazars. These observations are supplemented by observations carried out during four campaigns of two-week duration each (in 2008 October, 2009 October, 2010 April, and 2010 November) when 12-15 sources were observed during each 16 hr session three times per campaign. This resulted in 49 epochs of VLBA observations of the quasar obtained from 2008 January to 2011 September. The VLBA data were processed and imaged in a manner identical to that described in Jorstad et al. (J05, ). We performed calibration of the position angle of polarization (EVPA) using (1) VLA observations carried out during the campaigns, coinciding with one of the VLBA epochs, (2) the D-term method (Dterm, ), and (3) the stability of the EVPAs of selected stationary features in sources observed along with 3C 454.3. In general, the accuracy of the EVPA calibration is within 5-10 degrees. We model the images in terms of a small number of components with circular Gaussian brightness distributions and determine polarization parameters of components using an IDL program that calculates the mean values of the pixels at the position of a total intensity component and within an area equal to that of the size established by the model fit. Figure 2 shows the results of modeling within 1 mas of the core of 3C 454.3, which is a presumably stationary feature located at the eastern end of the jet. In addition to the core, A0, three features are prominent in the jet: a quasi-stationary component, St, which was seen previously (e.g., (J05, )) and two new suprluminal knots, K09 and K10. Three other features in the jets, K1, K2, and K3, appear to correspond to the knots discussed in (J10, ). They are designated with respect to those identifications. Figure 3 shows the total and polarized image on 2011 April 21, where four components (A0, St, K09, and K10) are indicated according to their parameters found by model fitting.

The kinematics of both knots K09 and K10 is complex. Knot K09 does not move ballistically, as is seen in Figure 2. It decelerates at a distance of 0.15 mas from the core and then accelerates at a distance of 0.3 mas. Knot K10 appears in the jet at PA, to the south with respect to the jet axis (Fig. 3), then its trajectory curves into the direction of the jet axis, PA. Table 1 lists parameters of the knot’s kinematics: proper motion, ; angular acceleration along the jet, ; angular acceleration perpendicular to the jet, ; apparent speed, ; time of ejection, ; maximum flux, ; timescale of flux variability, ; and angular size of component at the epoch of maximum flux, . Table 1 also gives the Doppler factor, , bulk Lorentz factor, , viewing angle, , and Doppler factor, , based on the approach that we developed in Jorstad et al. (J05, ). The parameters , , and of K09 are very close to those which we derived using the kinematics of the jet in 1998-2001 (J05, ), while the parameters of K10 agree with those of knot K3 (J10, ), which implies a Doppler factor of the jet of 50 during the most prominent -ray outburst. In addition, strong intraday variability is seen in R band during 2010 November 18-21, which coincides with the peak of the -ray outburst and the emergence of K10 from the core. Intraday variability was observed also during the optical outburst at the end of 2007, which we associated with knot K3 (J10, ). The apparent speeds of K09 and K10 are similar and higher than of K1, K2, and K3 reported in (J10, ), although within the range of found in (J05, ). According to the analysis, the difference in the derived value of of K09 and K10 results from faster fading of K10 on the VLBA images with respect to K09 (see in Table 1).
| Parameter | K09 | K10 |
|---|---|---|
| , mas yr-1 | 0.210.02 | 0.190.03 |
| , mas yr-2 | 0.100.01 | – |
| , mas yr-2 | 0.130.02 | 0.410.22 |
| , | 9.60.6 | 8.91.7 |
| , yr | 2009.880.05 | 2010.950.07 |
| , RJD | 515618 | 554325 |
| , Jy | 17.000.45 | 7.100.16 |
| , yr | 0.670.06 | 0.260.02 |
| , mas | 0.120.02 | 0.100.01 |
| 273 | 586 | |
| 152 | 293 | |
| , deg | 1.350.2 | 0.30.1 |
| 24 | 6 |
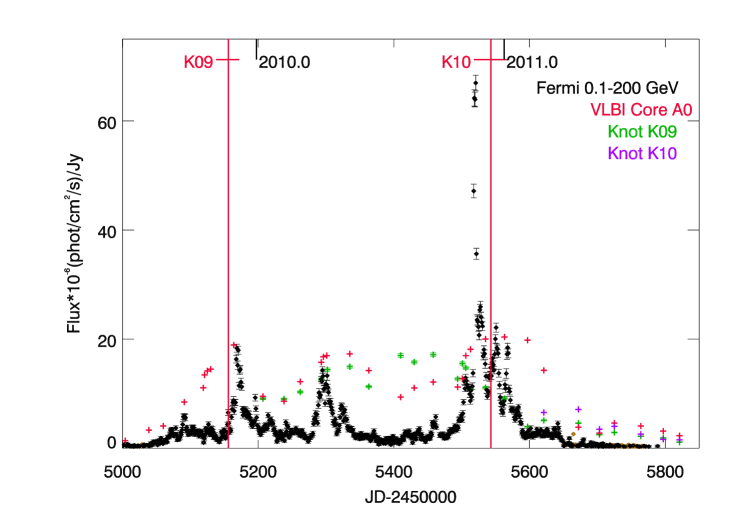
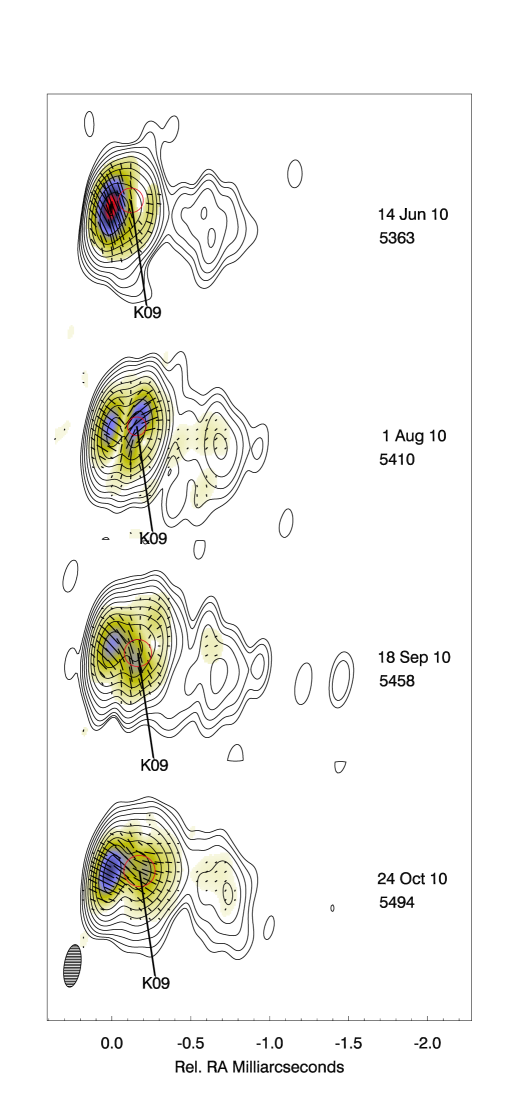
Figure 4 plots the -ray light curve and light curves of the core, A0, and components K09 and K10, and indicates the times of ejection of the knots. It shows that disturbances K09 and K10 passed through the mm-wave VLBI core close (within the 1 uncertainty of the ejection time of 18 and 25 days, respectively) to the time of -ray peaks of the prominent outbursts in autumn 2009 and 2010. Figure 4 also reveals that during the strong -ray outburst in 2010 April both the core and K09 had an outburst as well. Therefore, based on the history of 3C 454.3, it is likely that the increase in the flux of the core in 2010 April during the -ray event was caused by passage of a new superluminal knot through the core, with a flux of 5-7 Jy. We note that both the core was very bright in 2010 April (S18 Jy) and K09 was of similar brightness up to end of 2010. Summer - Autumn 2010 would have been the best period for detection of this hypothetical new component in the jet. Over this period K09 had a relatively small separation from the core, 0.12-0.20 mas. Although K09 was well resolved with the high resolution of our observations (0.1 mas, see Fig. 5), the resolution is most likely insufficient to have resolved a structure consisting of a weaker knot between two extremely bright ones within 0.20 mas. The increase in the flux of K09 in 2010 April might be an artifact of modeling by circular gaussians of such complex structure, but K09 continued to be bright (brighter than the core) when the core faded in the middle of 2010 (Fig. 4) that suggests that K09 (perhaps, blended with another superluminal knot) was responsible for the plateau at 1 mm (Fig. 1) on which the Autumn 2010 outburst is superposed. The new dramatic increase in the core flux in November 2010 and ejection of K10 further reduced the possibility of detecting any propagating disturbance associated with the -ray event in April 2010. However, collection of these events during the time of the high -ray state is strong evidence of a tight connection between activity in the parsec-scale jet and enhanced -ray emission.
III Polarization Behavior
An increase of the degree of optical linear polarization, , and rotation of the polarization position angle, , during high -ray/optical states were observed previously in several sources (MAR10, ; Abdo10, ), as well as in 3C 454.3 (J10, ; SAS11, ). Sasada et al. (SAS11, ) report two different episodes of rotation of during the Autumn 2009 event - a fast rotation of 2.3 deg/day (clockwise) in the beginning of the active state and a slower rotation of 9.80.5 deg/day (counterclockwise) from RJD:5157 to RJD:5192. The latter coincides with the peak of the outburst and passage of knot K09 through the VLBI core. A strong correlation between the gamma-ray flux and optical polarization at the early stage of the 2009 outburst was reported in Smith et al.(SMITH09, ), when the degree of the polarization decreased from 12% to 3% within a day in unison with the -ray flux. Our polarimetric monitoring during -ray events II, III, and IV shows that changes of in the 7 mm core are similar to the general behavior of the optical polarization (Figs. 6,7). This supports the idea that the polarized optical emisssion is produced in the vicinity of the mm-wave core of the blazar’s jet, as previously proposed by our group(J07, ; Frani07, ; IVAN1, ; IVAN2, ). Moreover, a strong increase in the degree of polarization both at optical wavelengths and in the VLBI core occurs at or near the -ray peaks. This implies that ordering of the magnetic field is needed for high -ray production in blazars. The most plausible mechanism for ordering of the magnetic field is the presence of a shock. Hughes, Aller, & Aller (HAA11, ) find that oblique shocks can reproduce variations in centimeter-wave polarization observed during -ray outbursts in blazars. However, the optical degree of polarization rises up to 25-30% (perhaps even higher, since in 2010 November our polarimetric observations missed the peak of the -ray emission), while the maximum of in the 7 mm core is only 5%. The latter implies that the polarized optical emission region, with a nearly uniform magnetic field, occupies only 0.04 of the mm-wave core. This suggests that the rest of the core contains a fairly turbulent magnetic field. Such a situation can be accommodated in the turbulent extreme multi-zone model proposed by Marscher (MAR12, ), in which a chaotic magnetic field modulates the efficiency of particle acceleration as the jet plasma crosses shock fronts.
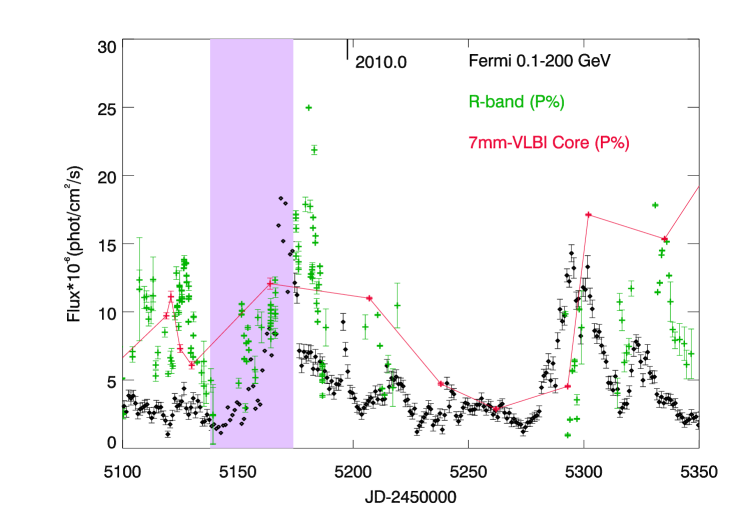
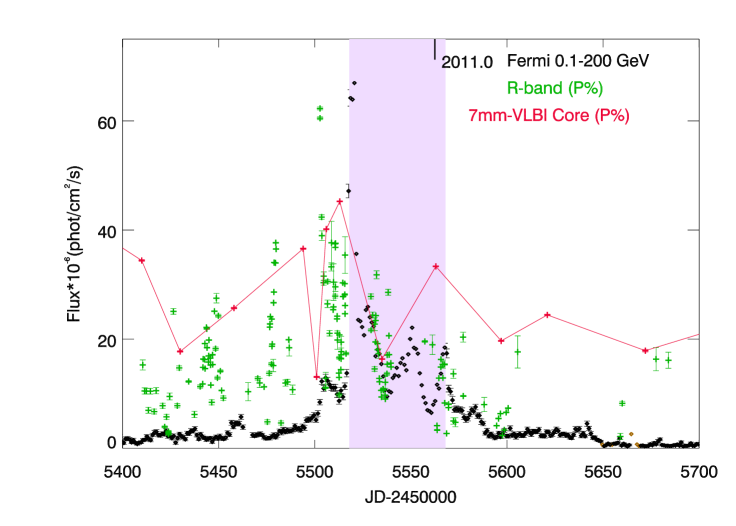

Figure 8 shows the behavior of the position angle of polarization at optical wavelengths, , and in the jet at 7 mm, , , and . In general, varies over the whole interval of possible position angles, while tends to be confined within position angles of -20-+10∘ (57% of the measurements), which corresponds to a direction of the polarization that is nearly perpendicular to the jet axis, . Figure 8 reveals a rotation of during passage of both knots K09 (the event observed by Sasada et al.(SAS11, )) and K10 through the core. Moreover, there is a good agreement between and measured during the Autumn 2009 outburst, and there is a signature of a rotation of in a similar manner as does during the Autumn 2010 outburst, althouth the 7 mm data are sparse. These are very strong indications that the optical polarized emission region is tightly connected to the mm-wave core of the radio jet.
IV Conclusions
Multifrequency observations of the quasar 3C 454.3 show a strong connection between the -ray, optical, 1 mm, and 7 mm VLBI core light curves. The well-defined peaks of the optical and 1 mm light curves coincided within 1 day with the peak of the gigantic -ray outburst in 2010 November. This argues in favor of the conclusion that the -ray and optical emission regions are co-spatial with that at millimeter wavelengths. During two major -outbursts, in 2009 December and 2010 November, a superluminal knot emerged from the core at the time of the -ray event (within the uncertainties of the VLBI measurements). The degrees of optical and core polarization reached maxima near to or at the same time as the -ray peaks (depending on the data sampling). Furthermore, the position angle of optical polarization rotated when a superluminal knot emerged from the core. Although we did not detect a disturbance associated with the -ray event in 2010 April, an increase in the flux and polarization in the core region was observed for this event as well, suggesting that such a disturbance was indeed passing through the core at this time. These observational findings strongly support the idea that the -ray outbursts originate in the mm-wave core of the jet when a disturbance, propagating down the jet at a relativistic speed, passes through the core. According to Jorstad et al. (J05, ), the parsec-scale jet of the quasar has a half opening angle 0.8∘. During the time period discussed here, the average angular size of the core at 43 GHz was 0.06 mas (although the core is not fully resolved in the images). This locates the region of the high energy activity in the quasar 3C 454.3 at a distance 16 pc from the central engine.
Acknowledgements.
This research was supported in part by NASA grants NNX08AV65G, NNX08AV61G, NNX09AT99G, NNX10AU15G, and NNX11AQ03G, and NSF grant AST-0907893 (Boston U.), NASA grants NNX08AW56G and NNX09AU10G (Steward Obs.). Agudo acknowledges funding by the “Consejería de Economía, Innovación y Ciencia” of the Regional Government of Andalucía through grant P09-FQM-4784, and by the “Ministerio de Economía y Competitividad” of Spain through grant AYA2010-14844. The VLBA is an instrument of the National Radio Astronomy Observatory, a facility of the Nation al Science Foundation operated under cooperative agreement by Associated Universities, Inc.References
- (1) A. A. Abdo et al. 2009, ApJ, 699, 817
- (2) M. Ackermann et al. 2009, ApJ, 721, 1383
- (3) A. A. Abdo et al. 2011, ApJ Letters, 733, L26
- (4) F. Tavecchio et al. 2010, MNRAS, 405, L94
- (5) S. G. Jorstad et al. 2010, ApJ, 715, 362
- (6) C. M. Raiteri et al. 2011, A&A, 534, 87
- (7) S. Vercellone et al. 2011, ApJ Letters, 736, L38
- (8) S. G. Jorstad et al. 2005, AJ, 130, 1418
- (9) J. L. Gómez et al. 2002, VLBA Scientific Memo 30 (Socorro: NRAO)
- (10) A. P. Marscher et al. 2010, ApJ Letters, 710, L126
- (11) A. A. Abdo et al. 2010, Nature, 463, 919
- (12) M. Sasada et al. 2011, arXiv:1112.4583
- (13) P. S. Smith, 2009, in Fermi Symposium 2009, eConference C091122, arXiv:0912.3621
- (14) S. G. Jorstad et al. 2007, AJ, 134, 799
- (15) F. D. D’Arcangelo et al. 2007, ApJ Letters, 659, L107
- (16) I. Agudo et al. 2011, ApJ Letters, 726, L13
- (17) I. Agudo et al. 2011, ApJ Letters, 735, L10
- (18) P. A. Hughes, M. F. Aller, and H. D. Aller 2011, ApJ, 735, 81
- (19) A. P. Marscher, 2012, in Fermi Symposium 2011, eConference C110509, arXiv:1201.5402