First-principles modeling of the thermoelectric properties of SrTiO3/SrRuO3 superlattices
Abstract
Using a combination of first-principles simulations, based on the density functional theory, and Boltzmann’s semiclassical theory, we have calculated the transport and thermoelectric properties of the half-metallic two dimensional electron gas confined in single SrRuO3 layers of SrTiO3/SrRuO3 periodic superlattices. Close to the Fermi energy we find that the semiconducting majority spin channel displays a very large in-plane component of the Seebeck tensor at room temperature, = 1500 V/K, and the minority spin channel shows good in-plane conductivity = 2.5 (mcm)-1. However, contrary to the expectation of Hicks and Dresselhaus model about enhanced global thermoelectric properties due to the confinement of the metallic electrons, we find that the total power factor and thermoelectric figure of merit for reduced doping is too small for practical applications. The reason for this failure can be traced back on the electronic structure of the interfacial gas, which departs from the free electron behaviour on which the model was based. The evolution of the electronic structure, electrical conductivity, Seebeck coefficient, and power factor as a function of the chemical potential is explained by a simplified tight-binding model. We find that the electron gas in our system is composed by a pair of one dimensional electron gases orthogonal to each other. This reflects the fact the physical dimensionality of the electronic system can be even smaller than that of the spacial confinement of the carriers.
pacs:
72.20.Pa,73.40.-c,74.70.Pq,73.20.AtI Introduction
The interest in thermoelectric materials has undergone a revival over the last decade. Tritt and Subramanian (2006); Zheng (2008) The reason behind this resurgence is double. On the one hand, recent experimental Ohta et al. (2007); Dragoman and Dragoman (2007); Venkatasubramanian et al. (2001); Kim et al. (2006) and theoretical Hicks and Dresselhaus (1993, 1993); Mahan and Sofo (1996); Slack (1995) discoveries allowed to glimpse new ways to significantly improve the efficiency of these materials, quantified by the thermoelectric adimensional figure of merit
| (1) |
where is the Seebeck coefficient (also called thermopower and denoted by by some authors), is the electrical conductivity, () is the electronic (lattice) contribution to the thermal conductivity, and is the absolute temperature. On the other hand, there is an indubitable technological interest over these systems, as significant improvements in this field will potentially impact fuel consumption efficiency and allow to build diminute cooling devices without moving parts. Tritt and Subramanian (2006)
It is usually accepted that applications in this field will only be cost effective for materials where is significantly larger than 1. However, the task of increasing its value remains challenging, since all the participating material’s parameters in Eq. (1) are strongly interconnected, and also dependent on material’s crystal structure, electronic structure and carrier concentration. Madsen (2006) Increasing the Seebeck coefficient for simple materials requires a decrease in the carrier concentration, that yields to a concomitant reduction in the electrical conductivity. Also, an increase in the electrical conductivity leads to a comparable increase in the electronic contribution to the thermal conductivity (as expressed in the Wiedemann-Franz law.) In conventional solids, a limit is rapidly obtained where a modification in any of these parameters adversely affects other transport coefficients so that the resulting for a given material at a given temperature does not vary significantly. Hicks et al. (1996)
Typical good thermoelectrics are doped semiconductors with intermediate values of the carrier density (close to 1018-1019 cm-3) displaying, at the same time, large Seebeck coefficients and good charge mobility. A typical example Tritt and Subramanian (2006) of this behavior is Bi2Te3 that, after doping, displays a value close to 1 at 320 K with a resitivity mcm and a Seebeck coefficient of 225 V/K. Other heavy-metal-based materials, such as group IV chalcogenides (lead telluride, PbTe, and related materials), exhibit large figure of merit at intermediate temperatures (up to 850 K). More interesting materials such as clathrates, Saramat et al. (2006) half-Heusler, Shen et al. (2001); Culp et al. (2008) skutterudites, Sales et al. (1996); Singh and Mazin (1997); Keppens et al. (1998) or strongly correlated oxides. Matsubara et al. (2001); Ohta et al. (2005, 2008); Wang et al. (2009); Hébert and Maignan (2010) have also been identified. Finally, it is noteworthy that graphene layers, Dragoman and Dragoman (2007) silicon nanowires Hochbaum et al. (2008); Vo et al. (2008) and molecular junctions have also received much attention due to their low thermal conductivity.
A completely new route to enhance the figure of merit was opened by Hicks and Dresselhaus in the early nineties. Hicks and Dresselhaus (1993) With a theoretical model, based on a simplified electronic band structure (assuming free-electron parabolic bands in two dimensions and a localized bound state in the third direction), these authors showed that a significant increase in would be possible due to the modification of the electronic properties of some materials when prepared in the form of quantum-well superlattices Hicks and Dresselhaus (1993) or nanowires. Hicks and Dresselhaus (1993) In particular they predicted that production of bidimensional heterostructures has two main consequences that improve the value of : (i) The confinement of the charge carriers in a plane is expected to reduce the dispersion of the density of states (DOS) of the bulk system, creating a sharper DOS at Fermi energy, and (ii) the nanostructuration of the system along a given spatial direction also favors the dispersion of phonons that have wavelengths longer than the period of the superlattice, leading to a decrease on the thermal conductivity , due to scattering of the lattice vibrations by the interface between layers. The first condition is in line with Mahan and Sofo’s proposal Mahan and Sofo (1996) for an “ideal thermoelectric”. From a purely mathematical point of view, these authors found how a -shaped transport distribution maximizes the thermoelectric properties.
Experimentally, these ideas have been thoroughly checked in semiconducting heterostructures containing heavy non-metal ions. As a proof of concept, pioneering experimental works were carried out by Hicks and coworkers Hicks et al. (1996) in PbTe/Pb1-xEuxTe multiple quantum wells, showing a good agreement between the experimental results and the theoretical model predictions for the increase in the figure of merit. Values of as high as 2.4 have been measured in -doped Bi2Te3/Sb2Te3 superlattices. Venkatasubramanian et al. (2001) However, these systems are far from ideal as they decompose at the temperature where thermoelectric materials are expected to function (they start to decompose at 200° C), and contain poisonous elements like lead or bismuth.
Also, in good agreement with the Hicks and Dresselhaus prediction, Ohta et al. Ohta et al. (2007) found that periodic SrTiO3/Nb-doped SrTiO3 superlattices, where a two-dimensional electron gas (2DEG) is formed at the Nb-doped layer, exhibit enhanced Seebeck coefficients as the width of the doping layer is reduced. In particular, when its thickness reaches the ultimate thickness of one unit cell a very high value of = 850 V/K was observed, and a of 2.4 for the 2DEG was estimated (this corresponds to an effectice of 0.24 for the complete device having the 2DEG as the active part). However, this enhancement of the thermoelectric properties in 2DEG at oxide superlattices seems not to be so universal. Recent experimental results Pallecchi et al. (2010) could not find any enhacement of the Seebeck effect due to the electronic confinement in the metallic state at the -type LaAlO3/SrTiO3 interface. Ohtomo and Hwang (2004)
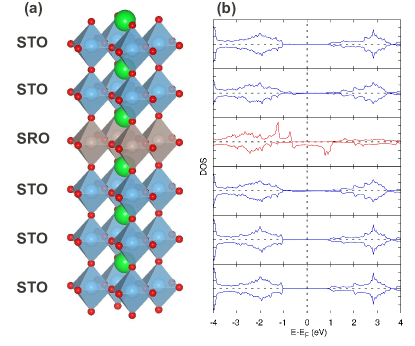
Very recently, we have proposed an alternative mechanism to generate 2DEG at oxide interfaces, Verissimo-Alves et al. (2012) playing with the possibility of generating a quantum well based on the different electronegativity of the cations in the perovskite structures used to build the interface. In particular a half-metallic spin-polarized 2DEG was theoretically predicted in (SrTiO3)5/(SrRuO3)1 superlattices. The electron gas is fully localized in the SrRuO3 layer due to higher electronegativity of Ru4+ ions compared to Ti4+ ones. The 2DEG presents a magnetic moment of /Ru ion. All these properties can be seen in the layer-by-layer projected density of states (PDOS) shown in Fig. 1, where the only contribution to the DOS at the Fermi energy comes from the minority spin SrRuO3 layer, while the majority spin channel behaves like a wide-gap semiconductor. From the point of view of the design of thermoelectric materials [see Eq. (1)] this system seems very promising due to the possible combination of a high-Seebeck coefficient (coming from the semiconducting majority spin channel) and metallic conductivity (coming from the minority spin channel).
The main objective of this work is to assess the thermoelectric properties of the 2DEG in (SrTiO3)5/(SrRuO3)1 superlattices, and to ascertain whether the Hicks and Dresselhaus model is applicable or not in this kind of systems. In order to achieve this goal, and starting from accurate first-principles electronic structure simulations on this interface, we use the Boltzmann transport theory Ziman (1972); Ashcroft and Mermin (1976) within the constant scattering time approximation to obtain the Seebeck coefficient and other transport functions.
The rest of the paper is organized as follows. Computational details are summarized in Sec. II. The main results on the Seebeck coefficient, electrical conductivity, and power factor for the superlattice are presented in Sec. III. Finally, in Sec. IV we discuss a simple model to understand the physical origin of the previous transport coefficients.
II Computational details
We estimated the electrical conductivity and the Seebeck coefficient through the semiclassical Boltzmann theory within the constant relaxation time approximation, as implemented in the BoltzTraP code. Madsen and Singh (2006) This implementation relies on the Fourier expansion of the band-energies, provided by a first-principles electronic structure code. Following our previous work, we have used siesta Soler et al. (2002) to compute both the relaxed atomic and electronic band structures of (SrTiO3)5/(SrRuO3)1 superlattice in the local density approximation (LDA) to the density functional theory. An extra Hubbard- term, following the rotationally invariant LDA+ scheme of Anisimov et al. Anisimov et al. (1997), is included to account for the strong electron correlations, with a of 4.0 eV applied only to the orbitals of Ru, as in Ref. Verissimo-Alves et al., 2012. In order to get smooth Fourier expansion of the one-electron eigenenergies and converged transport coefficients we proceed in a two step procedure: (i) first we relax the atomic structure and the one-particle density matrix with a sensible number of -points ( Monkhorst-Pack mesh Monkhorst and Pack (1976)), and (ii) freezing-in the relaxed structure and density matrix, we perform a non-self-consistent band structure calculation with a much denser sampling of (5994 -points in the irreducible Brilloin zone; 88128 -points in the full Brillouin zone). The rest of the computational parameters remain the same as in Ref. Verissimo-Alves et al., 2012. The robustness of the results presented below have been doubled-checked using the crystal09 code Dovesi et al. (2005) within the B1-WC hybrid functional Bilc et al. (2008) that mixes the generalized gradient approximation of Wu and Cohen Wu and Cohen (2006) with 16 % of exact exchange with the B1 scheme. Becke (1996)
The atomic structure of the (SrTiO3)5/(SrRuO3)1 superlattice at low temperature includes the rotation of both the TiO6 and RuO6 octahedra along the tetragonal -axis of the system [to establish the notation, we will call the plane parallel to the interface the plane, whereas the perpendicular direction will be referred to as the -axis]. Taking into account that the temperature at which bulk SrTiO3 undergoes the tetragonal to cubic transition is only 105 K, we expect that these distortions are fully suppressed when the system is acting as a thermoelectric generator at room or higher temperatures. Therefore, in the present study we do not allow rotation and tiltings of the oxygen octahedra during the atomic relaxations of the superlattices.
With the first-principles band structures, , computed as indicated above, together with the space group symmetry of the superlattice, we feed the BoltzTraP code. There, after performing the Fourier expansion, the conductivity tensor can be obtained as
| (2) |
where is the electronic charge, is the relaxation time, and
| (3) |
is the component of the group velocity for an electron in band . Now, from the previous conductivity matrix we can compute the relevant transport tensors that relate the electric current with an external electric field [] or temperature gradients []. These tensors depend on the temperature, , and the chemical potential, , that determines the number of carriers or the level of doping. The final expressions are given by
| (4) |
and
| (5) |
where is the Fermi-Dirac distribution. Finally the components of the Seebeck tensor can be computed as
| (6) |
The electronic contribution to the figure of merit is summarized in the power factor, , which is the numerator of the right-hand side in Eq. (1). For a magnetic system the value of the PF can be calculated from the individual spin bands using Eq. (4) and Eq. (5) and
| (7) |
While computing the previous transport properties two major approximations are considered: (i) the relaxation time is treated as constant, independent of temperature, band number, occupation and the vector direction. While this approximation is fairly strong, tests of this methodMadsen and Singh (2006) with semiconductor thermoelectrics like Bi2Te3 and systems including electron correlation like CoSb3 lead to a reasonable agreement with experiment. After Eq. (6), this approximation allow us to compute the Seebeck coefficient on an absolute scale (independent of ). However the conductivity can be calculated only with respect the relaxation time, and a value of has to be introduced as a parameter [typically using the theoretical value obtained from Eq. (4) to reproduce exactly the experimental conductivity at a given temperature and carrier density ]. Here, the relaxation time value s employed in the calculations was obtained from fitting the room temperature conductivity S/m of bulk SrTiO3 at electron concentration cm-3, Choi et al. (2010); Seo et al. (2007) which is very similar to that obtained from SrRuO3. Chang et al. (2009); Cao et al. (1997)
The second approximation is the “rigid band approach” that assumes that the band structure does not change with temperature or doping, and therefore is fixed independently on the chemical potential.
III Results
III.1 Electron localization and band structure
In Fig. 1 we show the DOS of the (SrTiO3)5/(SrRuO3)1 superlattices projected layer-by-layer. As previously discussed in Ref. Verissimo-Alves et al., 2012, the electronic structure displays a half-metallic state where the conduction only takes place for the minority spin electrons that are completely confined to the SrRuO3 layer. For the majority spin our LDA+ calculations predict a gap of eV around the Fermi energy, which is typical for wide-gap semiconductors.
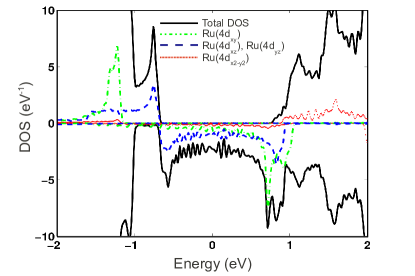
A more detailed description of the nature of the states around the Fermi energy is obtained when we plot the PDOS for the 4 orbitals of Ru (Fig. 2). Since Ru4+ is a low-spin transition metal ion, we expect the conduction band to have a strong (,,) character. Indeed, the conduction band in the minority spin is formed by the half-filled degenerate Ru() orbitals while the Ru() band is mainly situated at an energy slightly above the Fermi level. Similarly, the majority spin valence band is composed by Ru orbitals, but since they are shifted to lower energies they are strongly mixed with O(2) bands. In Ref. Verissimo-Alves et al., 2012 these features were explained with the use of a simplified tight-binding model including three main physical ingredients: (i) the bidimensionality of the SrRuO3 layer, (ii) the difference of in-plane and out-of-plane bonding for the Ru-ions, and (iii) the electron-electron interactions as described by a Hubbard term. In Fig. 2 we can also see the Ru() band, however as it lies at relatively high-energies its presence is negligible when discussing the transport properties in this system.
III.2 Transport calculations
In Fig. 3 we show the calculated electrical conductivity, Seebeck coefficient and power factor for = 300 K as a function of the position of the chemical potential (i.e. doping level) for both the majority and minority spin channels. We also compare them to their corresponding DOS. Due to the tetragonality of the superlattice, all the previous transport tensors are diagonal with only two independent components: one parallel to the interface ( = ), and a second one perpendicular to the interface ( component). Since all the carriers are confined to move in the SrRuO3 plane, from now on we will only focus on the parallel one.
As expected for a half-metal, the behavior of these quantities around the Fermi energy at zero doping is very different according to the different nature of each spin channel.
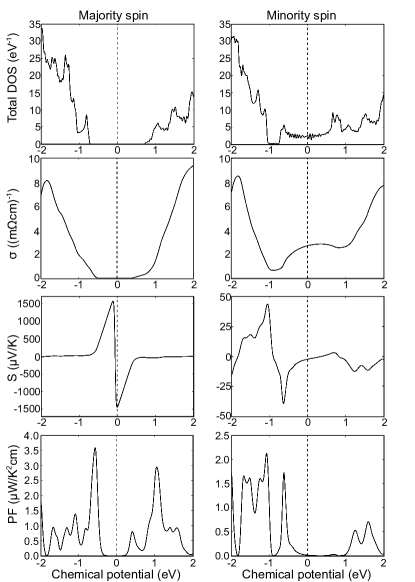
In the case of the minority spin, the system is metallic in the SrRuO3 layer (Fig. 2), and the conductivity presents a local maximum close to . Then, decreases quickly as the chemical potential decreases and gets closer to the Ru (4) band edge (around -0.6 eV below the Fermi energy, see Fig. 2). The other spin component (the majority one) is semiconducting and the small non-zero contribution to (indiscernible from zero in the scale of the figure) comes from the use of a finite temperature in the simulation (electrons thermally excited to the conduction bands, leaving behind holes in the valence band). In both cases the conductivity quickly increases when eV as the doping starts to involve the large density of states associated with SrTiO3 levels. When we compare these values with those of typical high-efficiency thermoelectrics, , we find that the value for the minority spin is larger [] while that of the majority channel is much smaller.
Similarly, the curves for also reflects the different nature of the spin components. In the case of the majority spin we note a discontinuity of the Seebeck coefficient, showing the change from hole (region with 0) to electron (region with 0) doping. The maximum absolute value for this channel is 1500 V/K and occurs for relatively small hole dopings ( eV) This value is significantly larger than the room temperature = 480 V/K found by Ohta et al. Ohta et al. (2007) for the 2DEG in one unit-cell-thick Nb-doped SrTiO3 superlattices, than the value of = 1050 V/K in TiO2/SrTiO3 heterointerfaces with an electron concentration of cm-3, Ohta et al. (2007) and also than those typical associated to good bulk thermoelectrics, which are usually Tritt and Subramanian (2006) around 150-250 V/K (the reader has to keep in mind that we are comparing maximum values of the Seebeck coefficient, thought they can be achieved at different carrier concentrations of holes or electrons.) The opposite happens to the minority spin channel, where the Seebeck coefficient is very small at as the conduction changes from being dominated by electrons to holes in the semi filled Ru() bands. When the system is doped, the absolute value increases linearly with the chemical potential but the energy scale is two orders of magnitude smaller than in the majority spin case, a typical factor when comparing the Seebeck coefficients of metals and semiconductors. Only when the chemical potential is close to the lower edge of the conduction band ( eV) the minority spin shows a pronounced enhancement of the thermopower reaching a moderate value of = -35 V/K.
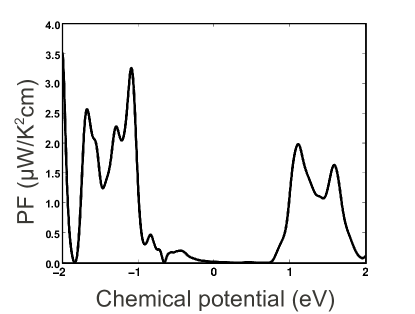
Calculation of the power factor for each of the spins shows strong compensation of Seebeck coefficient and conductivity in both channels giving rise to very small values ( W/K2cm) around the Fermi energy. Indeed, while the majority spin displays a large Seebeck coefficient and a very small conductivity, in the minority spin a reversed situation is found. In both cases the power factor for the undoped system is almost negligible when compared to those of good thermoelectrics (20 - 50 W/K2cm). Only for very strong hole doping, close to one hole per Ru4+ ion, an appreciable enhanment is observed for the power factor, both for the majority spin component, PF=3.6 W/K2cm and the minority spin one, PF=1.7 W/K2cm. This result is summarized in Fig. 4, where the total PF is calculated as indicated in Eq. (7). There we can observe that the total power factor is still very small for low dopings, and only when the system is strongly hole-doped (1e/Ru) an appreciable PF is obtained.
IV Discussion
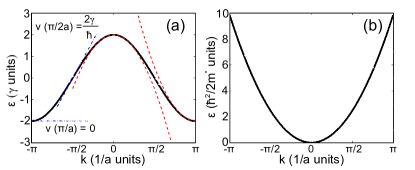
In the previous section we have found that even though (SrTiO3)5/(SrRuO3)1 superlattices exhibit a 2DEG, whose width is confined just within a single perovskite unit cell, the power factor does not display the strong enhancement expected by Hicks and Dresselhaus. Hicks and Dresselhaus (1993) In order to understand the previous results we will analyze them using both a free electron and a tight-binding model. The choice of the free electron model was motivated by the fact that the Hicks and Dresselhaus works were based on parabolic bands to describe the electronic structure of the system, while the tight-binding model has proven to be very successful to explain the first-principles results of the superlattice under study.
We define a simple one band free electron model in one, two or three dimensions using the energy dispersion,
| (8) |
where is the (isotropic) effective mass and runs over the dimensions of the system. Similarly, we define the energy dispersion for a one-band tight-binding model as
| (9) |
where is the characteristic interaction energy (band width) of one of the tight-binding center with its first-neighbors along , and is the cubic lattice spacing. A graphical representation of the free electron and tight-binding bands is presented in Fig. 5.
In Fig. 6 we compare the DOS and transport properties for both models using the formalism developed in Sec. II. For ease of comparison with the (SrTiO3)5/(SrRuO3)1 superlattice, this plot is structured in a similar way to Fig. 3.
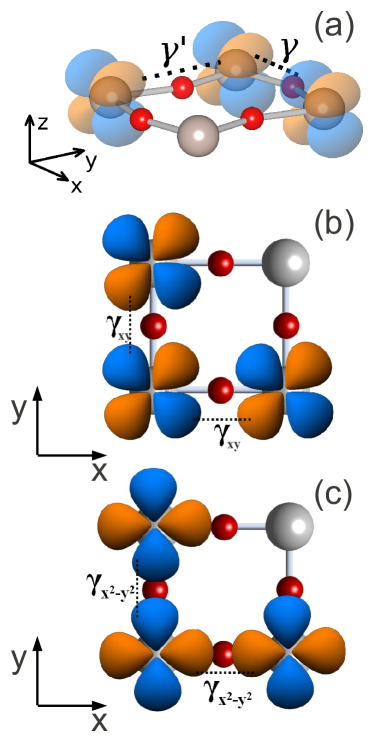
The DOS plots correspond with the textbook examples Ashcroft and Mermin (1976); Martin (2004) of the corresponding models where, for example, the 2D free-electron model involves a step function. Comparing both models for the same dimensionality we observe that, at the band edge, both are quite similar with a logarithmic divergence (in 1D), a finite discontinuity (in 2D), and a functional dependence with the energy (in 3D). However, the models quickly differ at higher energies. In particular, the tight-binding bands are symmetrical around the center of the band, while the free-electron ones are not. The reason behind the similitudes between the two models comes from the fact that the tight-binding dispersion curves can be approximated by parabolae (see Fig. 5) at the band-edges. Comparing these simple models to the first-principles calculated DOS of the conduction band (top-right panel of Fig. 3) we find that the most similar one is the 1D tight-binding model. In particular, both pictures display a very characteristic two-peaked structure. While it is reasonable that a tight-binding model is more adequate than a free-electron one to describe the narrow 4-bands of Ru, it seems surpring that the DOS resembles that of a 1DEG rather than a 2DEG one. The reason for this behavior is that in the case of Ru(4) and Ru(4) bands the hopping parameter in the conducting plane is only large along or directions, respectively [see Fig. 7(a)]. Thus, the 2DEG in the (SrTiO3)5/(SrRuO3)1 superlattice is, in fact, formed by two half-filled orthogonal 1D bands. In contrast, in the Ru(4) and Ru(4) bands the orbitals bond equally well in the and directions [see Fig. 7(b) and 7(c)] forming a proper 2DEG. Indeed, if we compare the DOS of the majority spin Ru(4) band in Fig. 2 we observe a very similar shape to that of the ideal bidimensional tight-binding model shown in Fig. 6. For the Ru(4) a good agreement with the model can be also be achieved if the tight-binding expansion is extended to include interactions with in-plane neighbors along directions that shift the central DOS peak to higher energies.
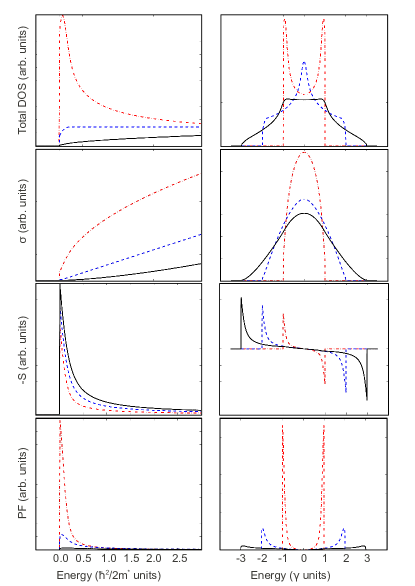
Regarding the electric conductivity, the results obtained for both the free electron and the tight-binding models are equivalent at the band-edge where the tight-binding bands can be approximated by parabolae. This can be seen in the way the conductivity curves decay in a quicker way as the energy gets closer to the lower bound of the band. However, the behavior for half filling is quite different in both models. In particular, the tight-binding model predicts a maximum conductivity in the middle of the band, a behavior not observed for the free electron approximation. This conductivity maximum corresponds to the maximum of the group velocity at as deduced from Eq. (9) and can be graphically visualized as the slope of the band diagram in Fig. 5. This maximum can clearly be seen around in the full conductivity calculation for the minority spin channel in (SrTiO3)5/(SrRuO3)1 (Fig. 3), and the 1D character of the band can also be observed in the abrupt reduction of conductivity around eV.
The Seebeck coefficient follows a similar trend, with the free electron and tight-binding results closely matching each other at the edge of the band. At this point, the absolute value of the Seebeck coefficient is larger for bulk (3D) than in lower dimensionality systems (2D, 1D). This may come as a surprise when it was experimentally shown that in the 2DEG in Nb-doped SrTiO3Ohta et al. (2007) the Seebeck constant increases with reduced dimensionality. However in that case it was argued Ohta et al. (2007); Choi et al. (2010) that polarons are responsible for transport Alexandrov and Bratkovsky (2010) and thus the present model cannot account for their behavior. Going back to the comparison between both the free electron and the tight binding models we find that in the former case electronic bands are either for electrons or holes depending on the sign of the curvature in Eq. (8) around = 0, while in the latter the bands transit from electron () to hole () dominated with filling. Thus, the value = 0 is achieved exactly in the middle of the band, as observed both for the model in Fig. 6 and the full calculation for the minority spin bands in the full heterostructure (Fig. 3).
Finally, we analyze the power factor in both models. We observe that at the band edge the PF reaches a maximum value that is significantly enhanced when the dimensionality is reduced, in agreement with parabolic band models within effective mass theory used by Hicks and Dresselhaus. Hicks and Dresselhaus (1993, 1993) Taking into account that PF= it is surprising to find this enhancement knowing that the maximum value of the Seebeck coefficient is reduced with dimensionality. However, this decrease is overcompensated by the increase of the conductivity at the edge of the band. As the decay of the one dimension conductivity is sharper close to the beginning of the band for lower dimensionality systems, the value of the conductivity is also larger close to the edge than in 3D leading to a global enhancement of the PF. In the middle of the band the tight-binding model predicts = 0 which leads to a null value of the PF. Thus, the fact that the conducting band is exactly half filled in (SrTiO3)5/(SrRuO3)1 superlattices explains their very poor thermoelectric properties even though they display a half-metallic 2DEG with a width of a single SrRuO3 layer and a very large thermopower.
Therefore, the strong confinement of the electron gas in (SrTiO3)5/(SrRuO3)1 superlattices does not involve a corresponding enhancement of the thermoelectric properties. Recent experiments in the conducting LaAlO3/SrTiO3 interface also point to the absence of an enhancement of the Seebeck coefficient due to electronic confinement. Pallecchi et al. (2010) This seems to be at odds with the Hicks and Dresselhauss’s model. Hicks and Dresselhaus (1993, 1993) However, there is no such discrepancy: simply, the physical approaches on which the previous mode was based are not fullfilled in the present case. The main difference of our system with those of Hicks and Dresselhauss is the fact that the bands in our system are narrow and half-filled, mostly due to the potential wells arising predominantly from the ionic charges, Mannhart and Schlom (2010) breaking the parabolic band approximation used in their calculations.
V Conclusions
In this work we have theoretically studied the transport properties of the 2DEG present in the half-metallic (SrTiO3)5/(SrRuO3)1 superlattice. Using Boltzmann’s transport theory we have shown that: (i) the semiconducting spin channel displays a large Seebeck coefficient, 1500 V/K, larger than that found in Nb-doped SrTiO3 thin films, (ii) however the total power factor is too small for the system to be a good thermoelectric material. The reason behind the low power factor is the half filling of the metallic spin channel that, while providing a high conductivity, finally quenches the total Seebeck constant of the system.
Our results do not contradict those of Hicks et al. Hicks and Dresselhaus (1993, 1993) who predicted an important enhancement of the thermoelectric properties for systems whose transport is strongly confined in one or two dimensions although it shows its limits of application. Hicks and Dresselhaus assumed a semiconducting superlattice with parabolic bands that could be doped to increase the carrier density. However, in our system the main transport bands are narrow as corresponds to those with a strong Ru(4) character and are half filled being, as a consequence, not suitable for the application of the free electron model. Indeed, they are well described within the tight-binding approximation. Using this model we show that the 2DEG in (SrTiO3)5/(SrRuO3)1 is unusual in the sense that is composed of two orthogonal bands where the hopping parameter is only strong in one dimension having thus, the properties of a 1DEG.
Financial support from the Spanish Ministery of Science and Innovation through the MICINN Grant FIS2009-12721-C04-02, and by the European Union through the project EC-FP7, Grant No. CP-FP 228989-2 “OxIDes”. PhG acknowledges financial support from an ARC project TheMoTher, IAP project P6/42 from the Belgian state-Belgian Science Policy, and through a Research Professorship from the Francqui Foundation. D.I.B. acknowledges financial support from the grant of the Romanian National Authority for Scientific Research, CNCS-UEFISCDI, Project No. PN-II-RU-TE-2011-3-0085. The authors thankfully acknowledge the computer resources, technical expertise and assistance provided by the Red Española de Supercomputación. Other calculations were performed on the computers at the ATC group of the University of Cantabria and on the NIC3 at ULg.
References
- Tritt and Subramanian (2006) T. M. Tritt and M. A. Subramanian, MRS Bulletin, 188 (2006).
- Zheng (2008) J.-C. Zheng, Front. Phys. China, 3, 269 (2008).
- Ohta et al. (2007) H. Ohta, S. Kim, Y. Mune, T. Mizoguchi, K. Nomura, S. Ohta, T. Nomura, Y. Nakanishi, Y. Ikuhara, M. Hirano, H. Hosono, and K. Koumoto, Nature Mater., 6, 129 (2007).
- Dragoman and Dragoman (2007) M. Dragoman and D. Dragoman, Appl. Phys. Lett., 91, 203116 (2007).
- Venkatasubramanian et al. (2001) R. Venkatasubramanian, E. Siivola, T. Colpitts, and B. O’Quinn, Nature (London), 413, 597 (2001).
- Kim et al. (2006) W. Kim, J. Zide, A. Gossard, D. Klenov, S. Stemmer, A. Shakouri, and A. Majumdar, Phys. Rev. Lett., 96, 045901 (2006).
- Hicks and Dresselhaus (1993) L. D. Hicks and M. S. Dresselhaus, Phys. Rev. B, 47, 12727 (1993a).
- Hicks and Dresselhaus (1993) L. D. Hicks and M. S. Dresselhaus, Phys. Rev. B, 47, 16631 (1993b).
- Mahan and Sofo (1996) G. D. Mahan and J. O. Sofo, Proc. Natl. Acad. Sci. USA, 93, 7436 (1996).
- Slack (1995) G. A. Slack, “Handbook of thermoelectrics,” (CRC Press, Boca Raton, FL, 1995) p. 407.
- Madsen (2006) G. K. H. Madsen, J. Am. Chem. Soc., 128, 12140 (2006).
- Hicks et al. (1996) L. D. Hicks, T. C. Harman, X. Sun, and M. S. Dresselhaus, Phys. Rev. B, 53, R10493 (1996).
- Saramat et al. (2006) A. Saramat, G. Svensson, A. E. C. Palmqvist, C. Stiewe, E. Mueller, D. Platzek, S. G. K. Williams, D. M. Rowe, J. D. Bryan, and G. D. Stucky, J. Appl. Phys., 99, 023708 (2006).
- Shen et al. (2001) Q. Shen, L. Chen, T. Goto, T. Hirai, J. Yang, G. P. Meisner, and C. Uher, Appl. Phys. Lett., 79, 4165 (2001).
- Culp et al. (2008) S. R. Culp, J. W. Simonson, S. J. Poon, V. Ponnambalam, J. Edwards, and T. M. Tritt, Appl. Phys. Lett., 93, 022105 (2008).
- Sales et al. (1996) B. C. Sales, D. Mandrus, and R. K. Williams, Science, 272, 1325 (1996).
- Singh and Mazin (1997) D. J. Singh and I. I. Mazin, Phys. Rev. B, 56, R1650 (1997).
- Keppens et al. (1998) V. Keppens, D. Mandrus, B. C. Sales, B. C. Chakoumakos, P. Dai, R. Coldea, M. P. Maple, D. A. Gajewski, E. J. Freeman, and S. Bennington, Nature (London), 395, 876 (1998).
- Matsubara et al. (2001) I. Matsubara, R. Funahashi, T. Takeuchi, S. Sodeoka, T. Shimizu, and K. Ueno, Appl. Phys. Lett., 78, 3627 (2001).
- Ohta et al. (2005) S. Ohta, T. Nomura, H. Ohta, M. Hirano, H. Hosono, and K. Koumoto, Appl. Phys. Lett., 87, 092108 (2005).
- Ohta et al. (2008) H. Ohta, K. Sugira, and K. Koumoto, Inorg. Chem., 47, 8429 (2008).
- Wang et al. (2009) Y. Wang, Y. Sui, H. Fan, X. Wang, Y. Su, W. Su, and X. Liu, Chem. Mater., 21, 4653 (2009).
- Hébert and Maignan (2010) S. Hébert and A. Maignan, “Functional oxides,” (John Wiley & Sons, Ltd., West Sussex, United Kingdom, 2010) pp. 203–255.
- Hochbaum et al. (2008) A. I. Hochbaum, R. Chen, R. D. Delgado, W. Liang, E. C. Garnett, M. Najarian, A. Majumdar, and P. Yang, Nature (London), 451, 163 (2008).
- Vo et al. (2008) T. T. M. Vo, A. J. Williamson, V. Lordi, and G. Galli, Nano Lett., 8, 1111 (2008).
- Pallecchi et al. (2010) I. Pallecchi, M. Codda, E. Galleani d’Agliano, D. Marré, A. D. Caviglia, N. Reyren, S. Gariglio, and J.-M. Triscone, Phys. Rev. B, 81, 085414 (2010).
- Ohtomo and Hwang (2004) A. Ohtomo and H. Y. Hwang, Nature (London), 427, 423 (2004).
- Verissimo-Alves et al. (2012) M. Verissimo-Alves, P. García-Fernández, D. I. Bilc, Ph. Ghosez, and J. Junquera, Phys. Rev. Lett., 108, 107003 (2012).
- Ziman (1972) J. M. Ziman, Principles of the theory of solids (Cambridge University Press, Cambridge, 1972).
- Ashcroft and Mermin (1976) N. W. Ashcroft and N. D. Mermin, Solid State Physics (Saunders College Publishing, Philadelphia, 1976) p. 826.
- Madsen and Singh (2006) G. K. H. Madsen and D. J. Singh, Comput. Phys. Commun., 175, 67 (2006).
- Soler et al. (2002) J. M. Soler, E. Artacho, J. D. Gale, A. García, J. Junquera, P. Ordejón, and D. Sánchez-Portal, J. Phys.: Condens. Matter, 14, 2745 (2002).
- Anisimov et al. (1997) V. I. Anisimov, F. Aryasetiawan, and A. I. Lichtenstein, J. Phys.: Condens. Matter, 9, 767 (1997).
- Monkhorst and Pack (1976) H. J. Monkhorst and J. D. Pack, Phys. Rev. B, 13, 5188 (1976).
- Dovesi et al. (2005) R. Dovesi, R. Orlando, B. Civalleri, C. Roetti, V. R. Saunders, and C. M. Zicovich-Wilson, Kristallogr., 220, 571 (2005).
- Bilc et al. (2008) D. I. Bilc, R. Orlando, R. Shaltaf, G.-M. Rignanese, J. Íñiguez, and Ph. Ghosez, Phys. Rev. B, 77, 165107 (2008).
- Wu and Cohen (2006) Z. Wu and R. E. Cohen, Phys. Rev. B, 73, 235116 (2006).
- Becke (1996) A. D. Becke, J. Chem. Phys., 104, 1040 (1996).
- Choi et al. (2010) W. S. Choi, H. Ohta, S. J. Moon, Y. S. Lee, and T. W. Noh, Phys. Rev. B, 82, 024301 (2010).
- Seo et al. (2007) S. S. A. Seo, W. S. Choi, H. N. Lee, L. Yu, K. W. Kim, C. Bernhard, and T. W. Noh, Phys. Rev. Lett., 99, 266801 (2007).
- Chang et al. (2009) Y. J. Chang, C. H. Kim, S. H. Phark, Y. S. Kim, J. Yu, and T. W. Noh, Phys. Rev. Lett., 103, 057201 (2009).
- Cao et al. (1997) G. Cao, S. McCall, M. Shepard, J. E. Crow, and R. P. Guertin, Phys. Rev. B, 56, 321 (1997).
- Martin (2004) R. M. Martin, Electronic Structure. Basic Theory and Practical Methods (Cambridge University Press, Cambridge, 2004) p. 624.
- Alexandrov and Bratkovsky (2010) A. S. Alexandrov and A. M. Bratkovsky, Phys. Rev. B, 81, 153204 (2010).
- Mannhart and Schlom (2010) J. Mannhart and D. G. Schlom, Science, 327, 1607 (2010).