Currently at: ]Johnson Matthey Technology Centre, Sonning Common, UK
Negative thermal expansion and antiferromagnetism in the actinide oxypnictide NpFeAsO
Abstract
A neptunium analogue of the LaFeAsO tetragonal layered compound has been synthesized and characterized by a variety of experimental techniques. The occurrence of long-range magnetic order below a critical temperature = 57 K is suggested by anomalies in the temperature-dependent magnetic susceptibility, electrical resistivity, Hall coefficient, and specific heat curves. Below , powder neutron diffraction measurements reveal an antiferromagnetic structure of the Np sublattice, with an ordered magnetic moment of 1.70 0.07 aligned along the crystallographic -axis. No magnetic order has been observed on the Fe sublattice, setting an upper limit of about 0.3 for the ordered magnetic moment on the iron. High resolution x-ray powder diffraction measurements exclude the occurrence of lattice transformations down to 5 K, in sharp contrast to the observation of a tetragonal-to-orthorhombic distortion in the rare-earth analogues, which has been associated with the stabilization of a spin density wave on the iron sublattice. Instead, a significant expansion of the NpFeAsO lattice parameters is observed with decreasing temperature below , corresponding to a relative volume change of about 0.2 and to an invar behavior between 5 and 20 K. First-principle electronic structure calculations based on the local-spin density plus Coulomb interaction and the local density plus Hubbard-I approximations provide results in good agreement with the experimental findings.
pacs:
75.50.Ee, 74.70.Xa, 65.40.De, 61.05.fmI Introduction
Rarely in physics has a single family of compounds generated as much interest as the iron-pnictide superconductors Zaanen (2009); Grant (2008); Kivelson and Yao (2008); Norman (2008); Pickett (2009). Research in this field is being conducted at such a hectic pace that no fewer than 2500 articles have cited the paper that reported the discovery of superconductivity in Kamihara et al. (2008). The reason for this frenzy of activity is clear: the superconducting transition temperatures are very high, second only to the cuprates.
The replacement of the rare-earth (R) species in the RFeAsO “1111” phase with Np, without change to the room temperature structure, and the ability to subsequently replace Np with heavier actinides: Pu and Am, represents a real possibility to control correlations (from weak to strong, Np to Am) and to potentially extend the already rich physics of the iron pnictides.
The parent RFeAsO “1111” compounds have so far involved rare-earth ions in the oxide layers. These have ionic radii and have partially filled 4f shells, which are atomic-like in nature. The influence of the oxide layer, in the behavior of these materials, beyond being a ‘spacer’, is a seldom addressed question. In fact, from a materials point of view this is a difficult problem to investigate, since elements that possess similar chemical properties to the rare earths, both in terms of bonding and size, are hard to find. For ideal candidates one needs to descend to the bottom of the periodic table, specifically, the transuranic actinide elements, Np, Pu and Am. These have ionic radii of almost identical magnitude to the majority of the lanthanides, and are commonly present in the trivalent state in similar compounds. Not only do they represent an alternative to the lanthanides per se, but they can also be used to study the effect of the degree of localization of the f electron states (in this case 5f) on the observed properties. This is a commonly adopted strategy in the actinide community when investigating new compounds; the behavior of the actinide metals as one traverses the period from uranium to americium changes from itinerant, transition metal-like electronic behavior to localized, atomic-like behavior.
Here, we report on the synthesis and characterization of NpFeAsO, an isostructural Np analogue of LaFeAsO. Magnetic, electrical transport, and specific heat measurements have been used to characterize its macroscopic physical properties, whereas neutron and x-ray diffraction have been used to monitor the evolution of the magnetic and crystallographic structures with decreasing temperature. The experiments show the development of antiferromagnetic order on the Np sublattice below = 57 K, and the absence of observable crystallographic distortions down to 5 K. This is at variance with the behaviour of the rare-earth analogues RFeAsO, where the occurrence of a tetragonal-to-orthorhombic lattice transformation is observed well above the critical temperature of the rare-earth sublattice. On the other hand, the magnetic transition in NpFeAsO is accompanied by a large expansion of the unit cell volume below followed by an invar behavior below about 20 K. First-principle calculations of the electronic structure provide a Fermi surface with almost 2-dimensional character, very similar to the one previously reported for RFeAsO, and predict an antiferromagnetic ground state with a staggered magnetization along the tetragonal -axis. The anomalous thermal expansion is qualitatively described within a local-density plus Hubbard-I approximation.
II Experimental
The first and not inconsiderable hurdle one has to overcome when studying these materials is sample synthesis. This is non-trivial in the case of the radioactive and toxic actinides. One point of caution at this stage is that we have started our study with Np, whereas it is most common to begin with U. For the case of the oxypnictides, replacing the rare-earth element by U is highly unlikely to be successful, given that U can be either tri- or tetravalent, and is the latter in the vast majority of oxygen containing U-based compounds.
Polycrystalline samples of were synthesized at the Institute for Transuranium Elements (ITU) by solid state reaction using (Alfa Aesar 99.997%), elemental Fe (Alfa Aesar 99.998%), and crystals of NpAs as starting materials. The thoroughly mixed powder was pressed into a pellet, sealed in an evacuated silica ampoule and heated at for 48 hours, before finally being furnace quenched. All operations were carried out in a radioprotected glovebox with low oxygen and water concentrations.
High resolution X-ray diffraction data were measured as a function of temperature ( K) on the powder diffraction beamline, ID31 at the European Synchrotron Radiation Facility (ESRF), France, using an incident beam energy of keV. Powderized sample for this experiment was doubly encapsulated, being put inside a kapton tube (50 m) and inserted in a plexiglass hollow cylinder with a wall thickness of 200 m.
The magnetic susceptibility measurements were performed at ITU on a Quantum Design MPMS-7 SQUID magnetometer, in applied magnetic fields = 5 T and = 7 T, where we define . Electrical resistivity, Hall effect and heat capacity were measured using a Quantum Design Physical Properties Measurement System (PPMS-9). The electrical resistivity was determined using a standard 4-probe DC technique, with four 0.05 mm diameter platinum wires glued to the sample using silver epoxy (Epotek H20E). The Hall resistance () was determined by voltage measurements under applied magnetic field at +9 and -9T. The field response (B) at fixed temperatures has been measured to confirm results obtained when ramping in temperature. The heat capacity was measured using a standard relaxation calorimetry method, where the data were corrected for the contribution of the Stycast encapsulation material (2850 FT) by using an empirical relation determined previously.
Neutron powder diffraction was performed on the high-intensity two-axis D20 diffractometer at the Institut Laue Langevin (ILL), France, in the high flux mode, with an incident wave-length of Å, using a (002) pyrolitic graphite monochromator. About 250 mg of NpFeAsO powder was used, within a triple-walled Al container. Data were collected at 5, 30, 90, 190, and 290 K using the ILL trans-uranic samples orange cryostat. Variable temperature ramp data were also collected between 30 and 90 K.
III Results and discussion
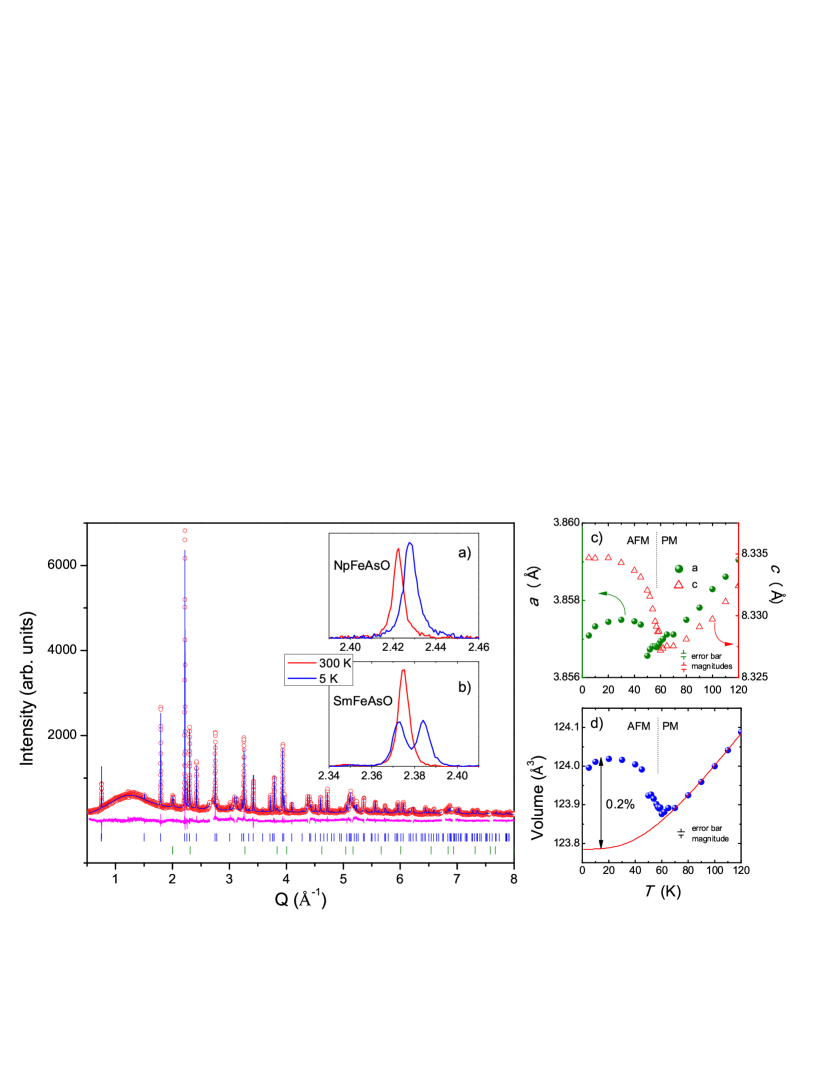
Upon the successful synthesis of NpFeAsO, our initial step was to check the crystal structure and sample purity using x-ray powder diffraction. At room temperature this indicates that this Np compound is an isostructural analogue to the celebrated rare-earth iron oxypnictide family RFeAsO, as demonstrated by the successful refinement of the high resolution data shown in Figure 1 to the ZrCuSiAs-type structure. Extra lines appearing in the diffraction pattern correspond to NpO2, which is the only observable impurity phase (about in weight). On cooling to K no orthorhombic distortion was observed within the resolution of our data (inset (a)), in contrast to all of the RFeAsO compounds (such as SmFeAsO in inset (b)). The absence of the crystallographic distortion immediately prompts a question regarding the nature of the magnetism in NpFeAsO, since it is believed that in the rare-earth compounds the distortion is intrinsically related to the development of a spin density wave on the iron, breaking the rotational symmetry within the plane. Inspection of Figure 2 reveals that bulk thermodynamic magnetic and transport property measurements give no indication of an anomaly within the standard temperature range for the RFeAsO spin density wave ordering ( K). Instead, anomalies are only observed at 25 K, corresponding to the phase transition in the NpO2 impurity phase Caciuffo et al. (1987), and significantly at K.
Even more striking and unusual, however, is the observed variation of the lattice parameters as a function of temperature. As shown in Figures 1(c) and (d), the standard thermal expansion behavior stops abruptly below K, and as the temperature is decreased the crystallographic cell expands. The very accurate data obtained at the ESRF ID31 high-resolution powder diffraction beamline allows us to study the effect along both principal crystallographic directions in detail. Although the temperature dependences for both and lattice parameters, show clear minima, , the -axis minimum is about 10 K higher than in the -axis direction. Below the lattice parameter increases monotonically and saturates for . On the contrary, the lattice parameter reaches a maximum at around 30 K and then starts to decrease with decreasing temperature. The relative lattice size change differs by a factor of 4, the one in the -axis direction being the greater. The above conclusions are not affected by the presence of the NpO2 impurity, whose lattice parameter shows a regular temperature behavior with a contraction at the onset of electric quadrupole order (T0 = 25 K) Mannix et al. (1999).
Using the second order Grüneisen approximation for the zero pressure equation of stateWallace (1998); Vočadlo et al. (2002), the volumetric data was modeled according to:
| (1) |
where is the internal energy, which we have calculated following the Debye approximation:
| (2) |
is the number of atoms in the unit cell, is the Boltzmann constant, and is the Debye temperature, obtaining K, eV, and Å3, and hence a negative thermal expansion of .
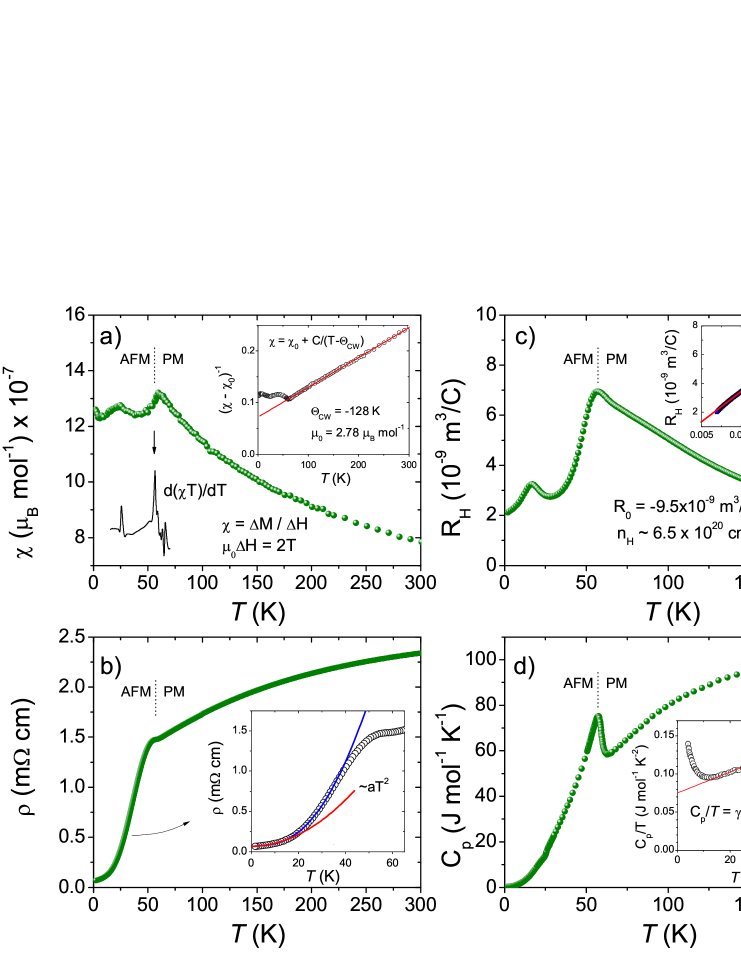
The presence and form of the anomaly in the magnetic susceptibility (Fig 2(a)) at K, implies the onset of antiferromagnetic ordering, and therefore that the anomalous thermal expansion is a consequence of a strong coupling between the magnetism and the lattice. In order to estimate the precise value of the Néel temperature, we followed Ref. Dutta et al. (2008), and plotted (solid line) on the same temperature scale. The maximum of is observed at K. Above 100K, the susceptibility curve has a Curie-Weiss behavior, with an effective paramagnetic moment and a Curie-Weiss temperature K. The above values have been obtained by fitting the inverse susceptibility curve to a straight line, taking into account the contribution of the NpO2 impurity phase by scaling the data reported in Ref. Caciuffo et al., 2003.
In the intermediate coupling scheme, of Np3+ is , and hence our results imply that the neptunium is trivalent, as is the case for the rare-earth species in the ReFeAsO isostructural compounds. The magnetic moment on the iron is likely to be small given that the majority of the magnetism can be attributed to the Np moments. The negative Curie-Weiss temperature suggests the presence of antiferromagnetic interactions. An additional anomaly is present in the data at K. This corresponds to the magnetic triakontadipole phase transition of NpO2 Santini et al. (2006); Magnani et al. (2008); Santini et al. (2009), which is present as an impurity phase in our sample, as detected in the x-ray diffraction pattern.
Figure 2(b) shows the resistivity, revealing a sharp drop at the magnetic transition. The low temperature resistivity can be described by the presence of AF interactions at high temperatures with the opening of a magnetic gap near the magnetic transition temperature Andersen (1980), as demonstrated by the fit in the insert to the function (blue solid line):
| (3) |
where , , and K. The value of is comparable to that obtained for (), which orders antiferromagnetically at K Colineau et al. (2004).
Whilst the electrical resistivity indicates that NpFeAsO is a reasonable metal, the number and nature of the carriers were further investigated by means of the Hall Effect. The temperature dependence of the Hall effect of NpFeAsO is shown in Fig. 2(c). At room temperature the Hall coefficient is positive and of the order of 210-9 m. It increases with decreasing temperature down to the Néel temperature K where exhibits a distinct maximum, reminiscent of the maximum in the temperature dependence of the magnetic susceptibility (see Fig. 2(a)). It has been shown experimentally and theoretically, based on the Anderson periodic model with the crystal electric field effect, that in magnetic materials the Hall coefficient may be described as a sum of two parts:
| (4) |
where is the normal Hall effect due to the Lorenz motion of carriers and the second term, the anomalous Hall effect, is related to the magnetic scatteringPutley (1960); Kontani et al. (1997); Nagaosa et al. (2010). The reduced susceptibility is approximated by where is the Curie-Weiss constantKontani et al. (1997). In the case of NpFeAsO, a least squares fitting of the above equation to the experimental data in the temperature range K (see the inset to Fig. 2(c)) resulted in the values m and m for the normal and anomalous Hall coefficients. The anomalous Hall effect, likely caused by the magnetism of the Np ions, is dominant, and therefore a positive is observed. However, the negative value of indicates that electrons are the dominant carriers, most probably due to their higher mobility. The single band model provides an estimate for the concentration of free electrons to be cm-3, which should be considered as the upper limit of the actual carrier concentration in NpFeAsO. Interestingly, the values of the ordinary Hall coefficient, as well as its sign, and carrier concentration obtained for NpFeAsO are similar to the ones derived for similar RFeAsO systems based on the lanthanide elementsSefat et al. (2008); McGuire et al. (2009); Suzuki et al. (2009); Liu et al. (2008). Neither resistivity, nor Hall effect measurements on NpFeAsO show anomalies as observed around 150 K in transport properties measurements of RFeAsO (R = La, Ce, Pr, Nd)McGuire et al. (2009).
Figure 2(d) presents the heat capacity data measured down to 2K. Two anomalies are clearly identified, namely a sharp -type cusp at 60 K, that coincides with the onset of antiferromagnetic order in NpFeAsO, and a shoulder at 25K, associated with the multipolar phase transition of NpO2 impurity Magnani et al. (2005). The insert shows a fit to in the K temperature range, where is the electronic contribution to the heat capacity, and () is the acoustic phonon contribution in the low temperature limit of the Debye model, where is the Debye temperature, is the number of atoms per formula unit, and is the Boltzmann constant. The contribution of the NpO2 impurity to the specific heat data have been subtracted by scaling the data reported for NpO2 in ref. Magnani et al., 2005.
In the magnetically ordered state the magnetic specific heat term () should be taken into account. In ref. Colineau et al., 2004, the formula that describes the specific heat of magnons with an energy gap in their dispersion relation, , was succesfully used in order to fit of NpCoGa5. Using the value of = 49 K obtained from the resistivity fit, and taking = 3.7 J mol-1K-3/2, as reported for NpCoGa5, term can be estimated. In the 3.5 K to 7 K temperature range, changes from K-1 to K-1, which is 5 and 2 orders of magnitude smaller than the measured value of and does not influence the fit shown in the inset of Figure 2(d), where no deviations from linear behavior are observed. The values of and extracted from the fit are mJ mol-1K-2, and K respectively. The obtained Debye temperature is not in good agreement with the value obtained from the fit of volumetric data. The observed upturn in below K is caused by the nuclear Schottky anomaly, which is commonly observed in Np compoundsKlimczuk et al. (2011); Colineau et al. (2004). In order to calculate the magnetic entropy, the phonon contribution to the specific heat must be subtracted. However, we can not use reported data for parent RFeAsO because all of them undergo a structural phase transition such that at low temperature they posses the orthorhombic crystal structure. According to our knowledge, despite of a lot of effort, synthesis of UFeAsO and ThFeAsO has not been successful. Therefore, the entropy removed upon magnetic ordering cannot be calculated at this moment.
Given both and , which was obtained from the interpolation of the fit to K, the Wilson ratio,
| (5) |
can be estimated for NpFeAsO, yielding a value for of 1.3. This is slightly higher than the free electron value () and less than expected for heavy fermion compounds ().

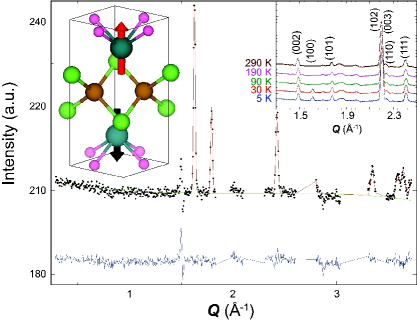
Information about the magnetic structure was obtained from neutron powder diffraction. On cooling below K additional Bragg reflections appeared (Figure 3). Their absence in the high resolution x-ray powder diffraction data, and their temperature dependence reflects their magnetic origin.
Rietveld modeling of the neutron data were performed using the GSAS programLarson and Von Dreele (2004) with EXPGUIToby (2001). The magnetic form factor assuming spherical symmetry ( and ) and the bound coherent scattering length of 237Np3+ (10.55 fm) were taken from the international tablesAnderson et al. (2006). A Landé splitting factor () of 0.6 was used. Several parts of the diffraction patterns were excluded, due to the aluminium container and other encapsulation and sample environment artifacts.
The 5 K and 30 K data sets were fitted with the AFM model, whilst the remaining sets were fitted with a paramagnetic model, the results of which are shown in Table I. To confirm that all the magnetic Bragg intensities were being modeled correctly, a purely magnetic fit was carried out to the difference between the 30 K and 90 K data sets (Figure 4). A list of reflections, with the measured and calculated structure factors are shown in Table 2. These peaks indexed using the magnetic Space Group, correspond to the Np moments being aligned along the -axis, with a ferromagnetic coupling within the basal plane, and an antiferromagnetic coupling between the planes (see the inset to Figure 4), reminiscent of the low temperature ordering of the Sm moments in SmFeAsONandi et al. (2011); Ryan et al. (2009).
No Fe moment is observed within the limits of the experiment. At 5 K, the ordered magnetic moment of the Np ions is of , in excellent agreement with Mössbauer spectroscopy estimations Gaczynski (2012).
| / K | 5 | 30 | 90 | 190 | 290 |
|---|---|---|---|---|---|
| / Å | 3.85525(15) | 3.85512(15) | 3.85530(15) | 3.85851(16) | 3.86235(17) |
| / Å | 8.3374(6) | 8.3371(6) | 8.3324(6) | 8.3466(7) | 8.3663(7) |
| Np | 0.1507(6) | 0.1508(6) | 0.1507(6) | 0.01512(7) | 0.1519(8) |
| As | 0.6742(11) | 0.6742(10) | 0.6755(10) | 0.6749(10) | 0.6738(12) |
| Np / Å2 | 0.028(2) | 0.029(2) | 0.027(2) | 0.031(3) | 0.036(3) |
| Fe / Å2 | 0.032(3) | 0.032(3) | 0.033(3) | 0.034(3) | 0.034(3) |
| As / Å2 | 0.032(4) | 0.032(4) | 0.035(4) | 0.037(4) | 0.038(4) |
| O / Å2 | 0.028(5) | 0.029(5) | 0.027(4) | 0.033(5) | 0.039(5) |
| Np / | 1.70(7) | 1.66(7) | — | — | — |
| 0.0212 | 0.0209 | 0.0205 | 0.0201 | 0.0198 | |
| 0.0155 | 0.0152 | 0.0151 | 0.0146 | 0.0141 |
It is worth noting, that for the parent RFeAsO “1111” compounds, the magnetic rare-earth moments order with the moments varying from 0.83 to 1.55 for CeFeAsO and NdFeAsO, respectively Lumsden and Christianson (2010). The highest Néel temperature, of the rare-earth sublattice, in the RFeAsO “1111” series, (Pr)=14 K observed for PrFeAsO Zhao et al. (2008), is four times lower than estimated for NpFeAsO.
To explore further the electronic and magnetic character of NpFeAsO we have performed first-principle local spin density approximation (LSDA) and LSDA plus Coulomb-U (LSDA+U) calculations. In all calculations we used the crystal structure parameters determined experimentally at room temperature, assuming the tetragonal ZrCuSiAs structure. Gaining inspiration from the neutron scattering data, we assumed that the magnetic and crystallographic unit cells coincide. Furthermore, we assumed that the magnetic moment is aligned along -[001]-axis, and considered non-magnetic (NM), ferromagnetic (FM), and anti-ferromagnetic (AF) arrangements for the Np moments. There were no magnetic moments set initially on the Fe atoms. In all calculations we assumed stoichiometric NpFeAsO and did not consider any defects or impurity NpO2 phase. The effect of defects and impurities is left for further consideration.
We used an in-house implementation of the full-potential linearized augmented plane wave (FP-LAPW) method Shick et al. (1999). This FP-LAPW version includes all relativistic effects (scalar-relativistic and spin-orbit coupling), and relativistic implementation of the rotationally invariant LSDA+U Shick and Pickett (2001). In the FP-LAPW calculations we set the radii of the atomic spheres to 2.75 a.u. (Np), 2.2 a.u. (Fe, As), and 1.6 a.u. (O). The parameter determined the basis set size, and the Brillouin zone (BZ) sampling was performed with 405 points. For the neptunium shell, Slater integrals of eV, eV, eV and eV were selected to specify the Coulomb interaction Moore and van der Laan (2009). They correspond to commonly accepted values for Coulomb eV and exchange eV parameters. The dependence of Np-atom on the choice of Coulomb- in a range from 1 eV to 3 eV was checked, and only small changes in the moment value were found.
In LSDA, we found that spin-polarization decreases the total energy with respect to the non-magnetic solution by 0.351 eV/ per formula unit (f.u.) for the FM-solution, and by 0.335 eV/f.u. for the AF-solution, suggesting an FM-ordered ground state. However, including the Coulomb- and exchange- in the fully-localized-limit (FLL) LSDA+U method, we obtain a total energy for the FM solution which is higher by 12 meV/f.u. than in the AF solution; on the contrary, if the double counting correction is made in the around-mean-field-limit (AMF), the AF solution becomes lower in energy than the FM one by 61.2 meV/f.u. Thus, both flavors of LSDA+U yield an AF-ordered ground state, in agreement with the experiment.
The spin , orbital , and total magnetic moments for the AF calculations with LSDA and LSDA+U are shown in Table 3. The staggered local magnetic moments, which are due to magnetic polarization of the Np -shell are formed at the two Np atoms. Comparison with the experimentally determined moment of shows that LSDA is failing completely to reproduce the results of neutron scattering experiments, whilst the AMF-LSDA+U calculations overestimate the moment value. On the other hand, the FLL-LSDA+U calculations yield an value in reasonable agreement with the experimental data, and the ratio of the orbital to total moment gives a g-value of 0.58, consistent with that for a free Np3+ ion, and the value of 0.6 used in the NPD refinements.
It should be noted that when the total energy difference between the FM and the AF solutions is used to make a ”naive” molecular-field theory estimate of the Néel temperature , the FLL-LSDA+U yields K in reasonable agreement with the experimental data. Thus we assume that the LSDA+U model with the FLL-double-counting choice gives the most appropriate description of the NpFeAsO.
| (Å-1) | |||
|---|---|---|---|
| 100 | 1.63 | 0.9312 | 0.9128 |
| 101 | 1.80 | 0.2374 | 0.2480 |
| 102111Excluded region. | 2.22 | — | 0.04335 |
| 111 | 2.43 | 0.4749 | 0.4442 |
| 112111Excluded region. | 2.75 | — | 0.4174 |
| 103222Partially excluded region. | 2.79 | 0.09241 | 0.2043 |
| 113111Excluded region. | 3.23 | — | 0.02390 |
| 201 | 3.35 | 0.3697 | 0.3177 |
| 104111Excluded region. | 3.43 | — | 0.06999 |
| 202 | 3.59 | 0.3496 | 0.3294 |
| 210 | 3.64 | 0.3925 | 0.4317 |
| 211222Partially excluded region. | 3.72 | 0.1687 | 0.1349 |
Although no magnetic polarization on other atoms in the unit cell was initially assumed, the presence of the exchange splitting at the Np atoms leads to induced staggered spin moments on the Fe atoms in a checker-board AF arrangement. These are fairly negligible in LSDA, but reach 0.1-0.25 values in LSDA+U. Such a moment on the iron was not visible in our neutron powder diffraction measurements, but can not be excluded due to the background arising from the sample encapsulation and to the high absorption cross-section of Np.
| LSDA | AMF-LSDA+U | FLL-LSDA+U | NPD | |||||||||||||
|---|---|---|---|---|---|---|---|---|---|---|---|---|---|---|---|---|
| Np | Fe | As | O | Np | Fe | As | O | Np | Fe | As | O | Np | ||||
| 2.91 | 0.00 | 0.03 | 0.00 | 1.53 | 0.25 | 0.01 | 0.00 | 2.98 | 0.10 | 0.02 | 0.00 | 2.26 | ||||
| -3.17 | 0.00 | 0.00 | 0.00 | -4.23 | 0.02 | 0.00 | 0.00 | -5.03 | 0.01 | 0.00 | 0.00 | -3.96 | ||||
| -0.25 | 0.00 | 0.03 | 0.00 | -2.70 | 0.27 | 0.01 | 0.00 | -2.05 | 0.11 | 0.02 | 0.00 | -1.7 | ||||
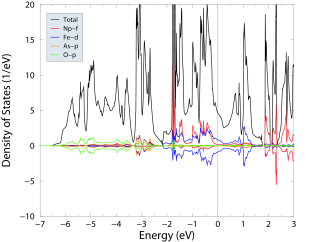
The total and partial (atom, spin and orbital-resolved) density of states (DOS) are shown in Fig. 5 calculated with FLL-LSDA+U= 3 eV. The DOS near the Fermi energy () has mostly Fe- character, while the As- and O- states are mostly located at 2-7 eV energy interval below . The Np- states are split by the exchange interaction. The resulting DOS at of 4.8 states/eV corresponds to the non-interacting value of the Sommerfeld coefficient = 5.6 mJ mol-1K-2 which is substantially lower than the experimental value of 75 mJ mol-1K-2. However, the theoretical value of the Sommerfeld coefficient is expected to increase due to electron mass enhancement caused by dynamical electron interactions and electron-phonon coupling.
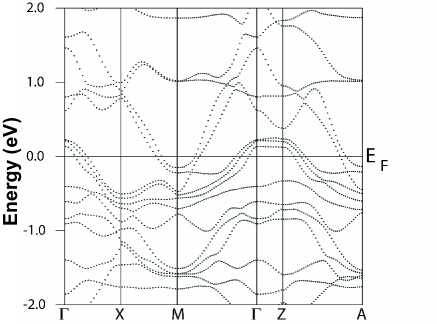
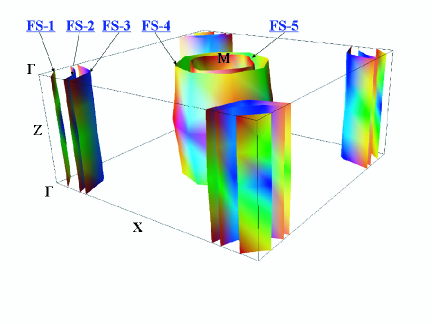
The band structure and the Fermi surface (FS) are shown in Fig. 6. The FS consists of five sheets, each of them doubly degenerate. Examination of the band structure shows that FS-1-3 sheets are hole-like, and centered at the -point. The FS-4 and FS-5 are electron-like and centered at the M-A line. Note the fairly two dimensional character of the FS, and the strong resemblance to those previously presented for RFeAsOCarrington et al. (2009); Singh and Du (2008). It is seen that most of the states in the vicinity of the FS are located near - and - k-points in the BZ suggesting the possibility of superconducting pairing mechanismChubukov (2012).
A striking feature of NpFeAsO which makes it different from the rare-earth-based counterparts, is the absence of the orthorhombic structural distortion associated with the magnetic ordering. In order to understand this, we performed magnetic anisotropy energy (MAE) calculations, rotating the staggered AF magnetization from the -axis to the -axis direction. What we found is that the total energy difference between these two directions of the magnetization is of 30.0 meV/f.u. This means that there is a strong positive uniaxial MAE in NpFeAsO. This MAE keeps the staggered AF magnetization along the tetragonal -axis and assists in the prevention of any distortion in the -plane.
Finally we turn to the discussion of the negative thermal expansion (NTE). The most recent theory of the Invar effect Khmelevskyi et al. (2003) is based on the use of a disordered local moment (DLM) approximation. The paramagnetic state in the DLM approximation is treated as a disordered pseudo-alloy with equal concentration of randomly oriented ”up” and ”down” local moments. It is usually implemented by making use of alloys theory in a coherent-potential approximation. Regrettably, it is not currently possible to use the DLM approximation together with the FP-LAPW basis used in this work.
| Method | LDA | LDA+HIA | FLL-LSDA+U |
|---|---|---|---|
| , (3) | 111.50 | 116.11 | 119.92 |
| , (MBar) | 1.92 | 1.86 | 1.79 |
Therefore, here the LDA+Hubbard I (HIA) approximation, as implemented in Ref.Shick et al., 2009, is used to treat the Np-atom local moment paramagnetic phase. The same values for the Slater integrals for Np atom as in LSDA+U were used in LDA+HIA calculations (which correspond to a Coulomb eV and an exchange eV), and the inverse temperature =40 eV-1 was chosen. The use of atomic-like LDA+HIA is justified for NpFeAsO at high temperature since the experiments presented above show a well localized character of the Np-atom f-shell above the Néel temperature. Furthermore, the effective paramagnetic moment of 2.84 per Np atom calculated in LDA+HIA, is in very good agreement with the moment of 2.780.06 obtained from susceptibility measurements.
The total energy versus volume was calculated for LSDA+U and LDA+HIA, and the equilibrium volumes () were obtained using a 3rd order polynomial fit. The -ratio and the internal positions of Np and As atoms were kept fixed in these calculations. The resulting for LSDA+U is reasonably close (with 3.3 % difference) to the experimental Å3 at T= 0 K, confirming an adequate choice of the computational model for NpFeAsO. However, the calculated of , whilst agreeing in sign, is about ten times bigger than the experimental value ().
This quantitative disagreement between theory and experiment is traced to the incorrect description of spin fluctuations on the Fe atoms in LDA+HIA calculations. The Hubbard-I correction is included for the Np atom only, and describes the local moment paramagnetic phase in Np-sublattices. The Fe-atom sublattice is treated within LDA, with no spin polarization (zero magnetic moment). This approximation is not sufficient for the Fe-atom sublattice in the paramagnetic phase of NpFeAsO. Note that it bears close similarities to what has been found in Ref. Turek et al., 2005, for the calculations in ferromagnetic RE(=Gd,Dy,Er)Co2 compounds. The FM-state was treated with the so-called ”open-core” approximation for RE-atom, and the DLM approximation was used for PM-phase. The calculated was found to be about five times bigger than in the experiment, and no spin polarization on the Co-atoms was found in the DLM calculations. By forcing a FM-moment on the Co-atom sublattice (applying DLM to the RE-sublattice only), the results improved quantitatively, and the value of reduced substantially.
IV Conclusions
In conclusion, we successfully synthesized NpFeAsO, one of the few actinide-based iron-oxypnictide compound (the other reported oxypnictides containing actinide elements are U2Cu2As3OKaczorowski et al. (1994a) , UCuPO Kaczorowski et al. (1994b); Wells et al. (2011), and NpCuPO Wells et al. (2011)). Although one may expect the physical properties of NpFeAsO to be similar to the lanthanide 1111 analogues, in reality this system behaves differently. In particular, we do not observe any structural transition, which is in agreement with the fact that neither transport properties (resisitivity and Hall effect) nor specific heat measurements reveal high temperature anomalies associated with an in-plane magnetic ordering in the Fe-As layer. We suggest that the lack of the orthorhombic structural distortion is caused by a strong positive uniaxial magnetic anisotropy energy.
Our results reveal that NpFeAsO exhibits an anomalous thermal expansion which is intimately linked to a giant magneto-expansion occurring as the system undergoes antiferromagnetic ordering. Negative thermal expansion was observed in PrFeAsOKimber et al. (2008), and we believe that it is a common feature in the 1111 family with a magnetic trivalent ion. However the effect in NpFeAsO is at least 20 times stronger and is clearly associated with the antiferromagnetism of the Np sublattice.
This invar effect is usually observed in transition metal disordered alloys (e.g. Fe-Ni,Fe-Pt Wassermann (1990)), and rare-earth ferromagnets (e.g. GdCu2 Lindbaum and Rotter (2002)) and anti-ferromagnets (e.g. PrFeAsO Kimber et al. (2008)). It was also found in -U metal Barrett et al. (1963) and later this effect was explained by the onset of a charge density wave. Even more striking is the observation of a NTE in - PuJette (1954), where the absence of magnetic ordering necessitates an alternative mechanism to that based on two spin states with different volumes, as for invar alloys Guillaume (1967); Weiss (1963). Instead in that case it is proposed that the negative thermal expansion is a signature of criticality arising from proximity to a localization-delocalization transitionSavrasov et al. (2001). Although uranium and plutonium have rather overshadowed their neighbor, neptuniumIbers (2010), here, in reporting the observation of NTE in NpFeAsO, neptunium will finally take centre-stage. To the best of our knowledge, NpFeAsO is the first actinide-based antiferromagnetic material, in which negative thermal expansion has been observed. This behavior originates from the magnetic order, but more exotic explanations, e.g. possible criticality at the interface between localised and itinerant electrons, should also be taken into consideration.
Acknowledgement
This work has been performed at the Institute of Transuranium Elements within its ”Actinide User Laboratory” program, with financial support to users provided by the European Commission. Np metal required for the fabrication of the compound was made available through a loan agreement between Lawrence Livermore National Laboratory and ITU, in the frame of a collaboration involving Lawrence Livermore National Laboratory, Los Alamos National Laboratory, and the US Department of Energy.
The support from Czech Republic Grants GACR P204/10/0330, and GAAV IAA100100912 is thankfully acknowledged. Work at Princeton supported by US DOE grant DE FG02-98ER-45706. TK acknowledges the European Commission for financial support in the frame of the ”Training and Mobility of Researchers” programme.
Many thanks to everyone who helped with the experiments and preparation of this paper, in particular F. Kinnart (ITU), A. Hesselschwerdt (ITU) and L. Havela (Charles University, Prague).
References
- Zaanen (2009) J. Zaanen, Nature 457, 546 (2009).
- Grant (2008) P. M. Grant, Nature 453, 1000 (2008).
- Kivelson and Yao (2008) S. A. Kivelson and H. Yao, Nature 7, 927 (2008).
- Norman (2008) M. R. Norman, Physics 1, 21 (2008).
- Pickett (2009) W. E. Pickett, Nat. Phys. 5, 927 (2009).
- Kamihara et al. (2008) Y. Kamihara, T. Watanabe, M. Hirano, and H. Hosono, J. Am. Chem. Soc. 130, 3296 (2008).
- Maroni et al. (2010) B. Maroni et al., Phys. Rev. B 82, 104503 (2010).
- Caciuffo et al. (1987) R. Caciuffo, G. H. Lander, J. C. Spirlet, J. M. Fournier, and W. F. Kuhs, Solid State Commun. 64, 149 (1987).
- Mannix et al. (1999) D. Mannix, G. H. Lander, J. Rebizant, R. Caciuffo, N. Bernhoeft, E. Lidström, and C. Vettier, Phys. Rev. B 60, 15187 (1999).
- Wallace (1998) D. C. Wallace, Thermodynamics of Crystals (Dover, New York, 1998).
- Vočadlo et al. (2002) L. Vočadlo, K. S. Knight, G. D. Price, and I. G. Wood, Phys. Chem. Miner. 29, 132 (2002).
- Dutta et al. (2008) P. Dutta, M. S. Seehra, T. S., and K. J., J. Phys-Condens. Mat. 20, 015218 (2008).
- Caciuffo et al. (2003) R. Caciuffo, J. A. Paixao, C. Detlefs, M. J. Longfield, P. Santini, N. Bernhoeft, J. Rebizant, and G. H. Lander, J. Phys. Condens. Matter 15, S2287 (2003).
- Santini et al. (2006) P. Santini, S. Carretta, N. Magnani, G. Amoretti, and R. Caciuffo, Phys. Rev. Lett. 97, 207203 (2006).
- Magnani et al. (2008) N. Magnani, S. Carretta, R. Caciuffo, P. Santini, G. Amoretti, A. Hiess, J. Rebizant, and G. H. Lander, Phys. Rev. B 78, 104425 (2008).
- Santini et al. (2009) P. Santini, S. Carretta, G. Amoretti, R. Caciuffo, N. Magnani, and G. H. Lander, Rev. Mod. Phys. 81, 807 (2009).
- Andersen (1980) N. H. Andersen, in Crystalline Electric Field and Structural Effects in f-electron Systems (Plenum, New York, 1980).
- Colineau et al. (2004) E. Colineau, P. Javorský, P. Boulet, F. Wastin, J. C. Griveau, J. Rebizant, J. P. Sanchez, and G. R. Stewart, Phys. Rev. B 69, 184411 (2004).
- Putley (1960) E. H. Putley, Semiconductor Monographs (Butterworths, London, 1960), chap. Hall effect and related phenomena.
- Kontani et al. (1997) H. Kontani, M. Miyazawa, and K. Yamada, J. Phys. Soc. Jpn. 66, 2252 (1997).
- Nagaosa et al. (2010) N. Nagaosa, J. Sinova, S. Onoda, A. H. MacDonald, and N. P. Ong, Rev. Mod. Phys. 82, 1539 (2010).
- Sefat et al. (2008) A. S. Sefat, M. A. McGuire, B. C. Sales, R. Jin, J. Y. Howe, and D. Mandrus, Phys. Rev. B 77, 174503 (2008).
- McGuire et al. (2009) M. A. McGuire, R. P. Hermann, A. S. Sefat, B. C. Sales, R. Jin, and F. G. D. Mandrus, New J. Phys. 11, 025011 (2009).
- Suzuki et al. (2009) S. Suzuki, S. Miyasaka, S. Tajima, T. Kida, and M. Hagiwara, J. Phys. Soc. Jpn. 78, 114712 (2009).
- Liu et al. (2008) R. H. Liu, G. Wu, T. Wu, D. F. Fang, H. Chen, S. Y. Li, K. Liu, Y. L. Xie, X. F. Wang, R. L. Yang, et al., Phys. Rev. Lett. 101, 087001 (2008).
- Magnani et al. (2005) N. Magnani, P. Santini, G. Amoretti, R. Caciuffo, P. Javorský, F. Wastin, J. Rebizant, and G. H. Lander, Physica B 359-361, 1087 (2005).
- Klimczuk et al. (2011) T. Klimczuk, J.-C. Griveau, P. Gaczynski, R. Eloirdi, E. Colineau, and R. Caciuffo, J. Phys. Conf. Series 273, 012024 (2011).
- Larson and Von Dreele (2004) A. C. Larson and R. B. Von Dreele, Tech. Rep. LAUR 86-748, Los Alamos National Laboratory, USA (2004).
- Toby (2001) B. H. Toby, J. Appl. Crystallogr. 34, 210 (2001).
- Anderson et al. (2006) I. S. Anderson, P. J. Brown, J. M. Carpenter, G. Lander, R. Pynn, J. M. Rowe, O. Schärpf, V. F. Sears, and B. T. M. Willis, International Tables for Crystallography (International Union of Crystallography, 2006), chap. 4.4, Neutron Techniques, pp. 430–487.
- Nandi et al. (2011) S. Nandi, Y. Su, Y. Xiao, S. Price, X. F. Wang, X. H. Chen, J. Herrero-Martín, C. Mazzoli, H. C. Walker, L. Paolasini, et al., Phys. Rev. B 84, 054419 (2011).
- Ryan et al. (2009) D. H. Ryan, J. M. Cadogan, C. Ritter, F. Canepa, A. Palenzona, and M. Putti, Phys. Rev. B 80, 220503 (2009).
- Gaczynski (2012) P. Gaczynski, in preparation (2012).
- Lumsden and Christianson (2010) M. D. Lumsden and A. D. Christianson, J. Phys-Condens. Mat. 22, 203203 (2010).
- Zhao et al. (2008) J. Zhao, Q. Huang, C. de la Cruz, J. W. Lynn, M. D. Lumsden, Z. A. Ren, J. Yang, X. Shen, X. Dong, Z. Zhao, et al., Phys. Rev. B 78, 132504 (2008).
- Shick et al. (1999) A. B. Shick, A. I. Liechtenstein, and W. E. Pickett, Phys. Rev. B 60, 10763 (1999).
- Shick and Pickett (2001) A. B. Shick and W. E. Pickett, Phys. Rev. Lett. 86, 300 (2001).
- Moore and van der Laan (2009) K. Moore and G. van der Laan, Rev. Mod. Phys. 81, 235 (2009).
- Carrington et al. (2009) A. Carrington et al., Physica C 469, 459 (2009).
- Singh and Du (2008) D. J. Singh and M.-H. Du, Phys. Rev. Lett. 100, 237003 (2008).
- Chubukov (2012) A. Chubukov, Annu. Rev. Condens. Matter Phys. 3, 57 (2012).
- Khmelevskyi et al. (2003) S. Khmelevskyi, I. Turek, and P. Mohn, Phys. Rev. Lett. 91, 037201 (2003).
- Shick et al. (2009) A. Shick, J. Kolorenc, A. I. Lichtenstein, and L. Havela, Phys. Rev. B 80, 085106 (2009).
- Turek et al. (2005) I. Turek, J. Rusz, and M. Divis, J. Magn. Magn. Mater. 290-291, 357 (2005).
- Kaczorowski et al. (1994a) D. Kaczorowski, M. Potel, and H. Noël, J. Solid State Chem. 112, 228 (1994a).
- Kaczorowski et al. (1994b) D. Kaczorowski, J. H. Albering, H. Noël, and W. Jeitschko, J. Alloy Compd. 216, 117 (1994b).
- Wells et al. (2011) D. M. Wells, E. Ringe, D. Kaczorowski, D. Gnida, G. Andr , R. G. Haire, D. E. Ellis, and J. A. Ibers, Inorg. Chem. 50, 576 (2011).
- Kimber et al. (2008) S. A. J. Kimber et al., Phys. Rev. B 78, 140503 (2008).
- Wassermann (1990) E. Wassermann, Ferromagnetic Materials (North-Holland, Amsterdam, 1990), p. 237.
- Lindbaum and Rotter (2002) A. Lindbaum and M. Rotter, Handbook of Magnetic Materials v.14 (North-Holland, Amsterdam, 2002), p. 307.
- Barrett et al. (1963) C. S. Barrett, M. H. Mueller, and R. L. Hitterman, Phys. Rev. 129, 625 (1963).
- Jette (1954) E. Jette, J. Chem. Phys. 23, 365 (1954).
- Guillaume (1967) C. E. Guillaume, Nobel Lectures, Physics 1901-1921 (Elsevier Publishing Company, 1967), chap. Invar and Elinvar, pp. 444–473.
- Weiss (1963) R. J. Weiss, Proc. Phys. Soc. 82, 281 (1963).
- Savrasov et al. (2001) S. Y. Savrasov, G. Kotliar, and E. Abrahams, Nature 410, 793 (2001).
- Ibers (2010) J. Ibers, Nat. Chem. 2, 996 (2010).