Hydrogen and deuterium in shock wave experiments, ab initio simulations and chemical picture modeling
Abstract
We present equation of state data of shock compressed hydrogen and deuterium. These have been calculated in the physical picture by using ab initio molecular dynamics simulations based on finite temperature density functional theory as well as in the chemical picture via the Saha-D model. The results are compared in detail with data of shock wave experiments obtained for condensed and gaseous precompressed hydrogen and deuterium targets in a wide range of shock compressions from low pressures up to megabars.
1 Introduction
The equation of state (EOS) of hydrogen and its isotopes has been in the focus of research for many years for several reasons. In models of stellar and planetary interiors Guillot99 ; Guillot99a ; Fortney10 hydrogen is the most abundant element and its EOS is the most important component for the results. Deuterium and tritium are target materials in inertial confinement fusion experiments Lindl04 . Therefore, a lot of experimental and theoretical efforts were done to understand the behavior of hydrogen, deuterium, and tritium in a wide range of densities and temperatures. Recent developments in shock-wave experiments have enabled an access to a precise database in the megabar pressure range. Single or multiple shock-wave experiments have been performed for hydrogen (or deuterium) by using, e.g., high explosives Mintsev06 , gas guns Nellis06 , pulsed power Knudson01 ; Knudson03 ; Knudson04 , or high-power lasers Cauble97 ; Hicks09 . The strongly correlated states of warm dense matter cover a wide range, from an atomic-molecular mixture at low temperatures to fully ionized weakly coupled plasma at high temperatures. In particular, the characterization of the transition region (partially ionized plasma) is a great challenge both to theory and experiment since the bound states exhibit a highly transient nature. This region of the phase diagram is, however, of great relevance for planetary interiors. Important experimental information is also gained from helioseismology data Christensen02 that allows to check and correct theoretical models very accurately in the high temperature limit.
Some theoretical methods yield accurate results for limiting cases which then can be used to benchmark more general but approximate methods. For instance, an exact asymptotic expansion of thermodynamic functions can be given in the limit of almost fully ionized, low density plasma Larkin60 ; Starostin05 . Ab initio simulation techniques such as Path Integral Monte Carlo (PIMC) Ceperley01 ; Delaney06 , quantum monte carlo (QMC) Lin09 ; Morales10 ; Morales10a or finite-temperature density functional theory molecular dynamics (FT-DFT-MD) simulations Collins95 ; Collins00 which treat quantum effects and correlations systematically have taken a great benefit from the rapid progress in computing power. These methods provide very accurate and reliable results for a variety of problems and systems, especially for warm dense matter. In addition to these approaches, advanced chemical models developed for partially ionized plasmas Ebeling69 have also been applied for warm dense matter for a long time Ebeling82 ; Saumon91 ; Saumon92 ; Saumon95 ; Reinholz95 ; Beule99 ; Juranek00 ; Fortov03 ; Holst07 ; Gryaznov09 .
In the present work we compare the results of the Saha-D model and of FT-DFT-MD simulations with shock-wave experiments for hydrogen and deuterium which were performed for different initial densities in a wide range of shock compressions. We find good agreement so that these models can also be used to give detailed predictions for high-pressure states that will be probed in future experiments by varying the initial conditions accordingly.
2 FT-DFT-MD simulations
FT-DFT-MD simulations are a powerful tool to describe warm dense matter Lenosky97 ; Collins01 ; Desjarlais02 ; Desjarlais03 ; Mazevet03 ; Bonev04 ; Laudernet04 ; Mazevet05 ; Mazevet07 ; Vorberger07 ; Lorenzen09 ; Lorenzen10 ; Caillabet11 ; Holst11 . Correlation and quantum effects are considered by a combination of classical molecular dynamics for the ions and density functional theory for the electrons. We use the plane wave density functional code VASP (Vienna Ab Initio Simulation Package) Kresse93 ; Kresse94 ; Kresse96 to perform molecular dynamics simulations. VASP applies Mermin’s finite temperature density functional theory Mermin65 which allows us to treat the electrons even at higher temperatures on a quantum level. Projector augmented wave potentials Kresse99 were used and we applied a generalized gradient approximation (GGA) within the parameterization of PBE Perdew96 . The plane wave cutoff has to be chosen high enough to obtain converged EOS data Desjarlais03 ; Holst08 . A convergence of better than 1% is secured for eV which was used in all calculations presented here. In the MD scheme of VASP the Born-Oppenheimer approximation is used, i.e. the dynamics of the ions is treated within a classical MD with inter-ionic forces obtained by FT-DFT calculations via the Hellmann-Feynman theorem. The electronic structure calculations were performed for a static array of ions at each MD step. This was repeated until the EOS measures were converged and a thermodynamic equilibrium was reached.
The simulations were done for 256 atoms in a supercell with periodic boundary conditions. A Nosé thermostat Nos'e84 controlled the temperature of the ions, and the temperature of the electrons was fixed by Fermi weighting the occupation of the electronic states Kresse94 . Sampling of the Brillouin zone using up to 14 k-points showed that well converged results were obtained using Baldereschi’s mean value point Baldereschi73 for 256 particles. The same convergence behavior has previously been reported for water French09 . The size of the simulated supercell fixed the density of the system. The internal energy was corrected due to zero point vibrations of the molecules at low temperatures, taking into account quantum contributions of a harmonic oscillator for each molecule French09a . For this procedure the number of molecules has to be known, which was obtained by evaluating the pair correlation function, see Ref. Holst08 for details. The system was simulated steps further after reaching the thermodynamic equilibrium to ensure a small statistical error. The EOS data were then obtained by averaging over all particles and simulation steps in equilibrium.
3 Saha-D model
The Saha-D model EOS is based on the chemical picture Ebeling69 ; Fortov03 ; Mono80 which represents the plasma as a mixture of interacting electrons, ions, atoms, and molecules. We consider the following components for hydrogen and deuterium: , , , , , (). For this case the Helmholtz free energy reads:
| (1) |
We shortly outline the approximations in which these three contributions were treated; for details, see Fortov03 ; Gryaznov06 . The first two terms of Eq. (1) are the ideal gas contributions of heavy particles (atoms, ions, and molecules) and of electrons. The latter corresponds to the partially degenerate ideal Fermi gas Landau76 . The last two terms describe corrections due to Coulomb interactions and short-range interactions between heavy particles. The Coulomb interaction effects of charged particles are considered here within a modified pseudopotential approach Fortov03 ; ILIEncy2004 ; Ilios80 .
The electron-electron and ion-ion interaction is each treated by using the Coulomb potential. For the effective electron-ion interaction we apply a pseudopotential using the Glauberman form Glaub1951 . The parameters of the pseudopotentials and of the corresponding pair correlation functions were determined from the general conditions of local electroneutrality and dipole screening, from the non-negativity constraint for the pair correlation functions, and from a relation between the screening cloud amplitude and the depth of the electron-ion pseudopotential. In the weak coupling limit, this approximation coincides with the Debye model but in the strong coupling limit it is much softer and demonstrates a quasi-crystalline behavior.
At high densities as typical for shock-compressed hydrogen the short-range repulsion between composite heavy particles (, , ) becomes very important. This effect is taken into account in the Saha-D model within a simple soft-sphere approximation Young77 which is modified for a mixture of soft spheres with different radii. In this case the effective packing fraction is calculated via the individual diameters of each particle species in correspondence with the one-fluid approximation:
| (2) |
is the diameter of the soft spheres in the respective potential . The contribution of the intermolecular repulsion dominates the EOS of dense hydrogen and deuterium in a wide range of pressures at low temperatures. The contribution of atom-atom and atom-molecule repulsion becomes important at elevated temperatures. The parameters for the soft-sphere repulsion for , , and are chosen according to the spherically symmetric parts of the effective interaction potentials of the non-empirical atom-atom approximation Yakub99 . The key parameter of this approximation is the ratio of corresponding soft-sphere diameters for atoms and molecules, . This ratio determines the change of intrinsic volumes of two atoms in comparison with that of a molecule (); it determines the effective shift of the dissociation and ionization equilibrium in warm dense hydrogen and deuterium. All parameters of the soft-sphere repulsion are given in Table 1. The parameter is chosen such that our soft-sphere potential for molecule-molecule repulsion will be close to the potential Yakub99 at a distance (in this case ).
| 6 | 4.0 | |
| 6 | 3.2 | |
| 6 | 3.2 |
In order to take into account the existence of condensed states (liquid and solid) for hydrogen and deuterium, the attraction term in the free energy has to be considered together with the soft-sphere repulsion. In our case reads:
| (3) | |||||
The attractive corrections Gryaznov98 are independent of temperature. The choice of as in our case corresponds to a van der Waals-like approximation. The parameter supplies the correct sublimation energy of a molecular system in the condensed state.
4 Results
We calculated Hugoniot curves based on the FT-DFT-MD and Saha-D EOS data sets for hydrogen and deuterium. In Fig. 1 we compare our calculations with gas-gun experiments Nellis83 ; Holmes95 on liquid hydrogen and deuterium. The experiments for deuterium and hydrogen are reproduced by the Saha-D model within the uncertainties of the experiments. The FT-DFT-MD Hugoniot curves reproduce the experiments with less precision. In the case of hydrogen the compression rate is slightly overestimated above 5 GPa. For deuterium this occurs for pressures above 15 GPa. Furthermore, the FT-DFT-MD curve lies above the experiments for pressures below 10 GPa. Between 10 GPa and 20 GPa the experimental data are reproduced within error bars.
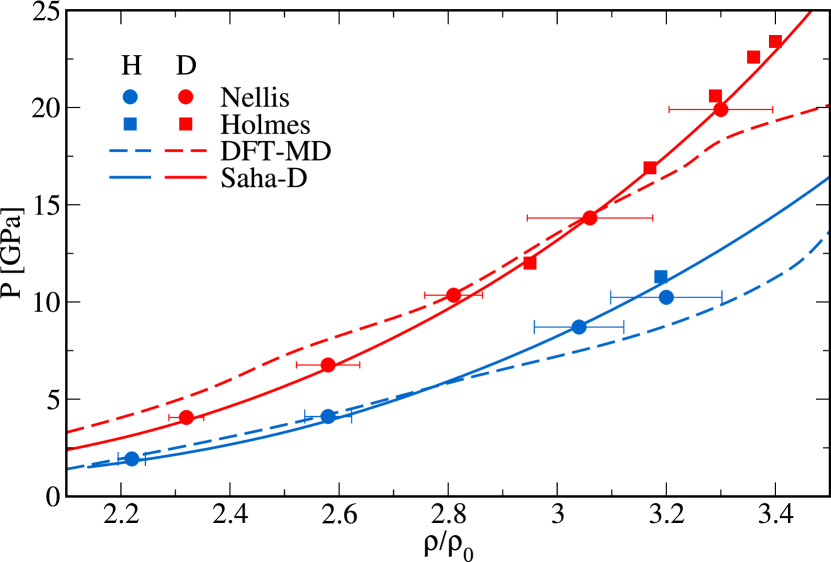
.
The less precision of the FT-DFT-MD data in the region of the gas gun experiments is connected with the relatively abrupt onset of dissociation processes which lead to an increase of the compression ratio at about 20 GPa and 4200 K as it has already been reported Tamblyn10 . The reason for this behavior can be related to the underestimation of the fundamental band gap in DFT-based electronic structure calculations. More accurate exchange-correlation functionals than PBE, specifically derived for finite temperatures, are urgently needed for warm dense matter. QMC calculations treat the exchange-correlation directly and are not affected by this approximation. Recent QMC calculations find in fact a shift of the dissociation region compared to DFT Morales10a but show no different results for the EOS for conditions relevant for planetary interiors Morales10 ; Morales12 . For instance, the Saha-D model yields 10% dissociation at 60 GPa and a temperature of 13000 K along the deuterium Hugoniot curve. Along the hydrogen Hugoniot curve dissociation occurs at about 15 GPa and 3000 K within the FT-DFT-MD model. The Saha-D model predicts 10% dissociation at 50 GPa and a temperature of 14000 K along the hydrogen Hugoniot curve.
The presented theoretical predictions both agree with the experiments within 10% accuracy in compression ratio and can therefore describe the principal behavior of the obtained results well. The compression reached in shock compressed hydrogen is higher than in deuterium at the same pressure. This is reproduced by the calculated Hugoniot curves, see also Caillabet11 .
The FT-DFT-MD hydrogen EOS data were also used to calculate the deuterium Hugoniot curve. To adjust for the deuterium initial conditions we considered the initial conditions of the hydrogen EOS at half the deuterium density given in the experiment ( g/cm3), i.e. g/cm3. Plotting the resulting pressure versus the compression ratio, both Hugoniot curves are almost the same. On the other hand, calculating the pressure with the deuterium EOS and adjusting for the hydrogen initial conditions in the same way, the resulting Hugoniot curves are identical within a smaller error than the statistical error of the FT-DFT-MD simulations. The different compression ratios of hydrogen and deuterium as seen in the experiment are, therefore, only slightly caused by differences in the EOS data of both isotopes at warm dense matter conditions. The difference in the compression ratios is mainly due to the fact that the densities of the liquid targets at K do not scale exactly by a factor of two. Scaling the deuterium density to that of hydrogen the initial density of liquid deuterium would be g/cm3 which differs from the value relevant for liquid hydrogen which is g/cm3. This deviation of about 20% entails the different Hugoniot curves.
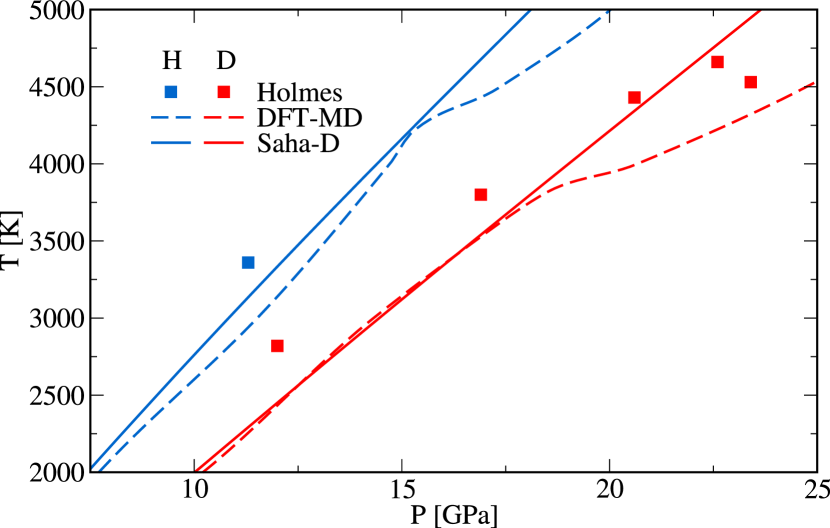
The temperature along the Hugoniot curves as predicted by the theoretical models is shown in Fig. 2 and compared with gas-gun experimental data Holmes95 . The temperatures measured in the experiments are in general higher than predicted by the Saha-D model and the FT-DFT-MD simulations, except for two deuterium points above 22 GPa which are below the Saha-D curve. Again, onset of dissociation causes the slight kink in the FT-DFT-MD curves at about 18 GPa (D2) and 15 GPa (H2). The general behavior indicated by the experiments can be reproduced: the temperature along the hydrogen Hugoniot curve is higher than that for deuterium at the same pressure. The maximum deviation of both theoretical models from the experimental data is about K.
We have also applied both theoretical EOS data sets to calculate the Hugoniot curves for different initial conditions in order to study the compression behavior of the hydrogen isotopes for a wide range of densities off the principal Hugoniot. Fig. 3 shows Hugoniot curves with respect to initial conditions as chosen in recent shock-wave experiments with precompressed targets Grish04 ; Boriskov05 . Two experiments were performed with gaseous targets at 1.5 kbar ( g/cm3) and 2.0 kbar ( g/cm3). Two other data sets were obtained with liquid ( g/cm3) and solid ( g/cm3) deuterium targets.
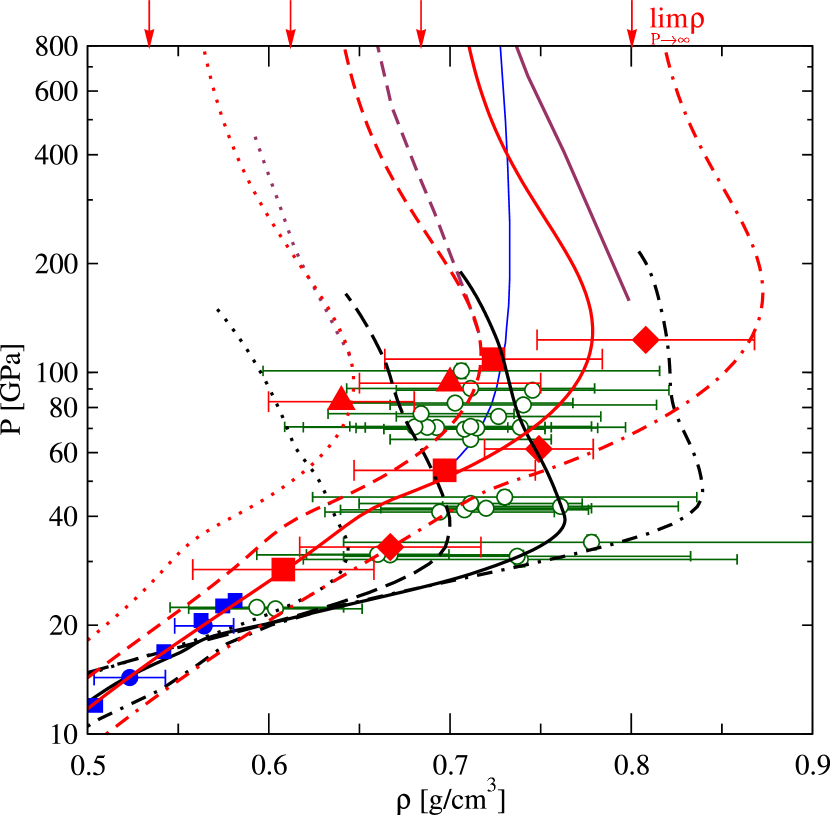
The two theoretical results and the experiments show the same general behavior: the attained absolute density is higher the more precompressed the target is. It has to be pointed out that the maximum compression ratio shows the inverse behavior, it decreases with higher precompression. Even so, the maximum density that can be probed in single shock experiments increases with precompression. The theoretical predictions of the two methods for the maximum density agree at the conditions of the experiments with gaseous and liquid targets and range from 0.65 g/cm3 to 0.775 g/cm3. For the initial condition in the solid, there is a slight difference: FT-DFT-MD predicts 0.83 g/cm3 and Saha-D 0.87 g/cm3. The pressure at this maximum compression density is also different for the two models; it ranges from 30 to 50 GPa within FT-DFT-MD and from 80 to 150 GPa according to Saha-D. These values cannot be discriminated via the few experimental points.
Fig. 4 shows the temperatures along the Hugoniot curves of deuterium using the initial conditions of the experiments with liquid and precompressed gaseous targets Holmes95 ; Grish04 ; Bailey08 .
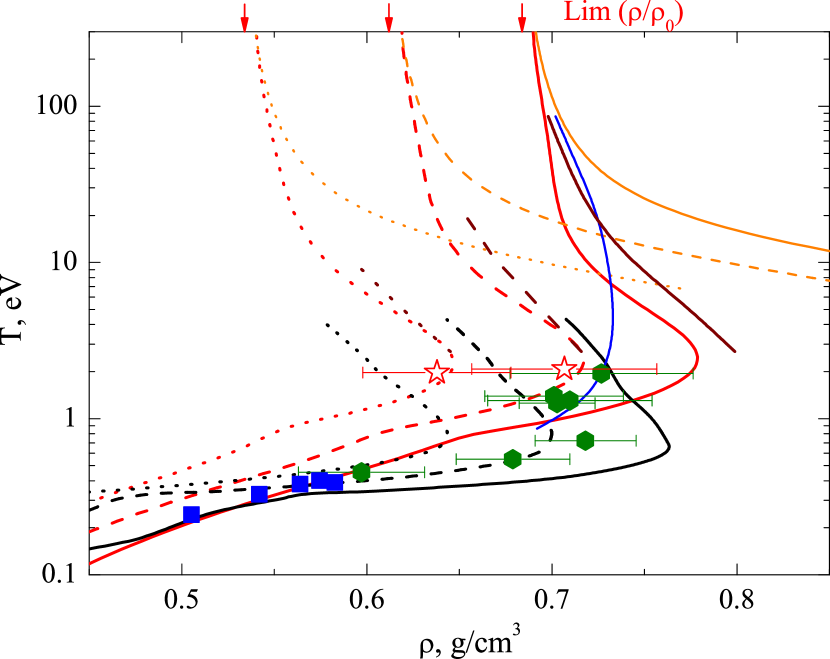
We have to note again that with a higher precompression also a higher density can be reached. The measurements indicate a temperature of about 2 eV for all three initial conditions. These results can be reproduced by the theoretical models within the error bars. The densest states are reached for the liquid deuterium target. The experiments of Bailey et al. Bailey08 show a maximum density between 0.7 and 0.8 g/cm3 which is reproduced by both theories. The temperatures measured in the experiments are underestimated by FT-DFT-MD and overestimated by Saha-D, with increasing deviation for higher temperatures. The limit of the Saha-D model at high temperatures can be checked by comparing with results obtained by the Saha-S model Gryaznov06 which is asymptotically exact for . Such a comparison shows that Saha-D (together with PIMC Militzer00 ; Levashov07 ) yields the correct high-temperature limit. The deviation of the Saha-S from the Saha-D curves at lower temperatures is due to the fact that the Saha-S model is no longer applicable for these parameters. In particular, the Saha-S model does not take into account the short-range repulsion effects of composite particles (). Interestingly, the temperature at maximum compression is almost independent of the initial conditions. The predictions of the theoretical models show that the curves are shifted only to higher densities while the temperature remains almost constant. This finding is supported by the experimental results.
5 Conclusions
We have calculated the EOS of deuterium and hydrogen with FT-DFT-MD simulations in the physical picture and the Saha-D model in the chemical picture over a wide range of density and temperature which enabled us to compare those results with recent shock-wave experiments. The theories predict, in agreement with the experiments, that higher compressed densities can be reached using precompressed targets, while the maximum compression ratio decreases. We compare also the temperature along the Hugoniot curve of deuterium with experimental data and find that only the density is affected by precompression, while the temperature remains almost the same along the different pathways. This leads to an increased pressure with higher precompression along the Hugoniot.
A check of EOS models against experiments within the WDM regime is available mostly for the relatively limited density and temperature range along the principal Hugoniot curve. Experiments producing shock waves within precompressed targets enable to check the quality of EOS models in a wider range in the phase diagram. Both EOS (based on FT-DFT-MD simulations and the Saha-D model) could reproduce the experimental data. On the other hand, neither the Saha-D model, which uses effective two-particle potentials with parameters that have been chosen to match physical constraints, nor the FT-DFT-MD method, which has no adjustable parameters, can reproduce all experimental features precisely. Nevertheless, experimental data is still not available in the needed quantity and precision to allow for a definite decision of which model has to be used to describe all quantities in all ranges of the phase diagram. We therefore look forward to future high-pressure experiments, especially off the principal Hugoniot curve.
The combination of an advanced chemical model with an ab initio approach yields a reasonable description of warm dense hydrogen because the low-density molecular liquid, the strongly correlated warm dense fluid, as well as the hot plasma can be described adequately, see also Redmer10 . Simultaneously this combination saves computational power as the treatment of a low-density molecular liquid is increasingly demanding when using FT-DFT-MD simulations. The treatment of a free energy minimiztion model like Saha-D is much less expensive regarding computational time. Accordingly, this combination provides an opportunity to construct a wide-range EOS for planetary interior modelling for which a database from ambient conditions up to pressures of several tens of megabar and temperatures up to about 100.000 K is needed. This project is going to be compiled for and will be be applied to model the interior of Jupiter Nettelmann12 .
Acknowledgements.
This work was supported by the Deutsche Forschungsgemeinschaft within the SFB 652, the High Performance Computing Center North (HLRN), and the Program of the Presidium of the Russian Academy of Sciences ”Research of Matter at Extreme Conditions”. We acknowledge support from the computer center of the University of Rostock and of the Education Center – Physics of High Energy Density Matter – of the Moscow Institute of Physics and Technology. We thank Eugene Yakub for helpful discussions and for providing us with the results of calculations for the deuterium Hugoniot.References
- (1) T. Guillot, Science 286, 72 (1999)
- (2) T. Guillot, Planet. Space Sci. 47, 1183 (1999)
- (3) J.J. Fortney, N. Nettelmann, Space Sci. Rev. 152, 423 (2010)
- (4) J.D. Lindl, P. Amendt, R.L. Berger, S.G. Glendinning, S.H. Glenzer, S.W. Haan, R.L. Kauffman, O.L. Landen, L.J. Suter, Phys. Plasmas 11, 339 (2004)
- (5) V.B. Mintsev, V.E. Fortov, J. Phys. A: Math. Gen. 39, 4319 (2006)
- (6) W.J. Nellis, Rep. Prog. Phys. 69, 1479 (2006)
- (7) M.D. Knudson, D.L. Hanson, J.E. Bailey, C.A. Hall, J.R. Asay, W.W. Anderson, Phys. Rev. Lett. 87, 225501 (2001)
- (8) M.D. Knudson, D.L. Hanson, J.E. Bailey, C.A. Hall, J.R. Asay, Phys. Rev. Lett. 90, 035505 (2003)
- (9) M.D. Knudson, D.L. Hanson, J.E. Bailey, C.A. Hall, J.R. Asay, C. Deeney, Phys. Rev. B 69, 144209 (2004)
- (10) R. Cauble, L.B.D. Silva, T.S. Perry, D.R. Bach, K.S. Budil, P. Celliers, G.W. Collins, A. Ng, T.W. Barbee Jr., B.A. Hammel et al., Phys. Plasmas 4, 1857 (1997)
- (11) D.G. Hicks, T.R. Boehly, P.M. Celliers, J.H. Eggert, S.J. Moon, D.D. Meyerhofer, G.W. Collins, Phys. Rev. B 79, 014112 (2009)
- (12) J. Christensen-Dalsgaard, Rev. Mod. Phys. 74, 1073 (2002)
- (13) A. Larkin, Sov. Phys. JETP 11, 1363 (1960)
- (14) A. Starostin, V. Roerich, JETP 100, 186 (2005)
- (15) D.M. Ceperley, E. Manousakis, J. Chem. Phys. 115, 10111 (2001)
- (16) K.T. Delaney, C. Pierleoni, D.M. Ceperley, Phys. Rev. Lett. 97, 235702 (2006)
- (17) F. Lin, M.A. Morales, K.T. Delaney, C. Pierleoni, R.M. Martin, D.M. Ceperley, Phys. Rev. Lett. 103, 256401 (2009)
- (18) M.A. Morales, C. Pierleoni, D.M. Ceperley, Phys. Rev. E 81, 021202 (2010)
- (19) M.A. Morales, C. Pierleoni, E. Schwegler, D.M. Ceperley, Proc. Natl. Acad. Sci. U.S.A. 107, 12799 (2010)
- (20) L.A. Collins, I. Kwon, J.D. Kress, N.J. Troullier, D. Lynch, Phys. Rev. E 52, 6202 (1995)
- (21) L.A. Collins, J.D. Kress, S.R. Bickham, T.J. Lenosky, N.J. Troullier, High Pressure Research 16, 313 (2000)
- (22) W. Ebeling, Physica 43, 293 (1969)
- (23) W. Ebeling, W. Richert, Annalen der Physik 39, 362 (1982)
- (24) D. Saumon, G. Chabrier, Phys. Rev. A 44, 5122 (1991)
- (25) D. Saumon, G. Chabrier, Phys. Rev. A 46, 2084 (1992)
- (26) D. Saumon, G. Chabrier, H.M. van Horn, Astrophys. J. Suppl. Ser. 99, 713 (1995)
- (27) H. Reinholz, R. Redmer, S. Nagel, Phys. Rev. E 52, 5368 (1995)
- (28) D. Beule, W. Ebeling, A. Förster, H. Juranek, S. Nagel, R. Redmer, G. Röpke, Phys. Rev. B 59, 14177 (1999)
- (29) H. Juranek, R. Redmer, J. Chem. Phys. 112, 3780 (2000)
- (30) V.E. Fortov, V.Y. Ternovoi, M.V. Zhernokletov, M.A. Mochalov, A.L. Mikhailov, A.S. Filimonov, A.A. Pyalling, V.B. Mintsev, V.K. Gryaznov, I.L. Iosilevskii, J. Exp. Theor. Phys. 97, 259 (2003)
- (31) B. Holst, N. Nettelmann, R. Redmer, Contrib. Plasma Phys. 47, 368 (2007)
- (32) V.K. Gryaznov, I.L. Iosilevskiy, J. Phys. A: Math. & Gen. 42, 214007 (2009)
- (33) T.J. Lenosky, J.D. Kress, L.A. Collins, Phys. Rev. B 56, 5164 (1997)
- (34) L.A. Collins, S.R. Bickham, J.D. Kress, S. Mazevet, T.J. Lenosky, N.J. Troullier, W. Windl, Phys. Rev. B 63, 184110 (2001)
- (35) M.P. Desjarlais, J.D. Kress, L.A. Collins, Phys. Rev. E 66, 025401 (2002)
- (36) M.P. Desjarlais, Phys. Rev. B 68, 064204 (2003)
- (37) S. Mazevet, J.D. Kress, L.A. Collins, P. Blottiau, Phys. Rev. B 67, 054201 (2003)
- (38) S.A. Bonev, B. Militzer, G. Galli, Phys. Rev. B 69, 014101 (2004)
- (39) Y. Laudernet, J. Clérouin, S. Mazevet, Phys. Rev. B 70, 165108 (2004)
- (40) S. Mazevet, M.P. Desjarlais, L.A. Collins, J.D. Kress, N.H. Magee, Phys. Rev. E 71, 016409 (2005)
- (41) S. Mazevet, F. Lambert, F. Bottin, G. Zérah, J. Clérouin, Phys. Rev. E 75, 056404 (2007)
- (42) J. Vorberger, I. Tamblyn, B. Militzer, S.A. Bonev, Phys. Rev. B 75, 024206 (2007)
- (43) W. Lorenzen, B. Holst, R. Redmer, Phys. Rev. Lett. 102, 115701 (2009)
- (44) W. Lorenzen, B. Holst, R. Redmer, Phys. Rev. B 82, 195107 (2010)
- (45) L. Caillabet, S. Mazevet, P. Loubeyre, Phys. Rev. B 83, 094191 (2011)
- (46) B. Holst, M. French, R. Redmer, Phys. Rev. B 83, 235120 (2011)
- (47) G. Kresse, J. Hafner, Phys. Rev. B 47, 558 (1993)
- (48) G. Kresse, J. Hafner, Phys. Rev. B 49, 14251 (1994)
- (49) G. Kresse, J. Furthmüller, Phys. Rev. B 54, 11169 (1996)
- (50) N.D. Mermin, Phys. Rev. 137, A1441 (1965)
- (51) G. Kresse, D. Joubert, Phys. Rev. B 59, 1758 (1999)
- (52) J.P. Perdew, K. Burke, M. Ernzerhof, Phys. Rev. Lett. 77, 3865 (1996)
- (53) B. Holst, R. Redmer, M.P. Desjarlais, Phys. Rev. B 77, 184201 (2008)
- (54) S. Nosé, J. Chem. Phys. 81, 511 (1984)
- (55) A. Baldereschi, Phys. Rev. B 7, 5212 (1973)
- (56) M. French, T.R. Mattsson, N. Nettelmann, R. Redmer, Phys. Rev. B 79, 054107 (2009)
- (57) M. French, R. Redmer, Journal of Physics: Condensed Matter 21, 375101 (2009)
- (58) V. Gryaznov, I. Iosilevskiy, Y. Krasnikov, N. Kuznetsova, V. Kucherenko, G. Lappo, B. Lomakin, G. Pavlov, E. Son, V. Fortov, Thermophysics of Gas Core Nuclear Reactor (Atomizdat, Moscow, 1980)
- (59) V.K. Gryaznov, S.V. Ayukov, V.A. Baturin, I.L. Iosilevskiy, A.N. Starostin, V.E. Fortov, J. Phys. A: Math. & Gen. 39, 4459 (2006)
- (60) L. Landau, E. Lifshits, Statistical physics, Vol. 5, 3rd edn. (Nauka, Moscow, 1976)
- (61) I. Iosilevskiy, in Encyclopedia of Low-Temperature Plasma Physics. Supplement, edited by A. Starostin, I. Iosilevskiy (Fizmatlit, Moscow, 2004), pp. 349–428
- (62) I.L. Iosilevskii, High Temp 18, 355 (1980)
- (63) A. Glauberman, Dokl. Acad. Nauk SSSR 78, 883 (1951)
- (64) D. Young, Tech. Rep. UCRL-52352, LLNL, Univ. California (1977)
- (65) E. S.Yakub, Physica B - Cond. Matter 265, 31 (1999)
- (66) V.K. Gryaznov, V.E. Fortov, M.V. Zhernokletov, G.V. Simakov, R.F. Trunin, L.I. Trusov, I.L. Iosilevskiy, J. Exp. Theor. Phys 87, 678 (1998)
- (67) W.J. Nellis, A.C. Mitchell, M. van Thiel, G.J. Devine, R.J. Trainor, N. Brown, J. Chem. Phys. 79, 1480 (1983)
- (68) N. Holmes, M. Ross, W. Nellis, Phys. Rev. B 52, 15835 (1995)
- (69) I. Tamblyn, S.A. Bonev, Phys. Rev. Lett. 104, 065702 (2010)
- (70) M.A. Morales, L.X. Benedict, D.S. Clark, E. Schwegler, I. Tamblyn, S.A. Bonev, A.A. Correa, S.W. Haan, High Energy Density Physics 8, 5 (2012), ISSN 1574-1818
- (71) S. Grishechkin, S. Gruzdev, V. Gryaznov, M. Zhernokletov, R. Il’kaev, I. Iosilevskii, G. Kashintseva, S. Kirshanov, S. Manachkin, V. Mintsev et al., JETP Letters 80, 398 (2004)
- (72) G. Boriskov, A. Bykov, R. Il’kaev, V. Selemir, G.V. Simakov, R. Trunin, V. Urlin, A. Shuikin, W. Nellis, Phys. Rev. B 71, 092104 (2005)
- (73) B. Militzer, D.M. Ceperley, Phys. Rev. Lett. 85, 1890 (2000)
- (74) P.R. Levashov, V.S. Filinov, A.V. Botsan, M. Bonitz, V.E. Fortov, First principal calculation of deuterium Hugoniots by Path integral Monte-Carlo method, in IX Kharitons Topical Scientific Readings. Extreme States of Substance. Detonation. Shock Waves, edited by A.L. Mikhailov (RFNC-VNIIEF, 2007), pp. 276–281
- (75) J.E. Bailey, M.D. Knudson, A.L. Carlson, G.S. Dunham, M.P. Desjarlais, D.L. Hanson, J.R. Asay, Phys. Rev. B 78, 144107 (2008)
- (76) R. Redmer, G. Röpke, Contrib. Plasma Phys. 50, 970 (2010)
- (77) N. Nettelmann, A. Becker, B. Holst, R. Redmer, Astrophys. J. 750, 52 (2012)