The properties of the 2175 Å extinction feature discovered in GRB afterglows
Abstract
The unequivocal, spectroscopic detection of the 2175 Å bump in extinction curves outside the Local Group is rare. To date, the properties of the bump have been examined in only two gamma-ray burst (GRB) afterglows (GRB 070802 and GRB 080607). In this work we analyse in detail the detections of the 2175 Å extinction bump in the optical spectra of the two further GRB afterglows: GRB 080605 and 080805. We gather all available optical/near-infrared photometric, spectroscopic and X-ray data to construct multi-epoch spectral energy distributions (SEDs) for both GRB afterglows. We fit the SEDs with the Fitzpatrick & Massa (1990) model with a single or broken power-law. We also fit a sample of 38 GRB afterglows, known to prefer a Small Magellanic Cloud (SMC)-type extinction curve, with the same model. We find that the SEDs of GRB 080605 and GRB 080805 at two epochs are fit well with a single power-law with a derived extinction of and , and and respectively. While the slope of the extinction curve of GRB 080805 is not well-constrained, the extinction curve of GRB 080605 has an unusual very steep far-UV rise together with the 2175 Å bump. Such an extinction curve has previously been found in only a small handful of sightlines in the Milky Way (MW). One possible explanation of such an extinction curve may be dust arising from two different regions with two separate grain populations, however we cannot distinguish the origin of the curve. We finally compare the four 2175 Å bump sightlines to the larger GRB afterglow sample and to Local Group sightlines. We find that while the width and central positions of the bumps are consistent with what is observed in the Local Group, the relative strength of the detected bump () for GRB afterglows is weaker for a given than for almost any Local Group sightline. Such dilution of the bump strength may offer tentative support to a dual dust-population scenario.
Subject headings:
Gamma-ray burst: general – Gamma-ray burst: individual: GRB 080606, 0808051. Introduction
Starlight in galaxies is absorbed and scattered by dust grains present in the interstellar medium (ISM). The process is usually quantified by the introduction of an interstellar extinction curve. A characteristic feature in the extinction curves of the MW and Large Magellanic Cloud (LMC) is the 2175 Å extinction bump, first discovered by Stecher (1965). The 2175 Å bump has been attributed to absorption by graphite grains processed by star formation (e.g., Draine 2003). However, the exact origin of the 2175 Å bump is still unclear although several candidates have been suggested ranging from carbonaceous materials (Henrard et al. 1997) to iron poor silicates in the form of partially hydrogenated amorphous Mg2SiO4 particles (Steel & Duley 1987). It has also been suggested that coating on graphite cores can explain the variation in the bump width, and possible candidates for mantle material are a mixture of neutral polycyclic aromatic hydrocarbons (PAHs) or other forms of non-graphitic carbon (Mathis 1994).
The most striking characteristics of the 2175 Å bumps are the remarkably constant central wavelength, large dispersion of height and width, and variable strength, varying from one line of sight to another (see Fitzpatrick & Massa 2007). The 2175 Å bump in the MW extinction curves appear to be the strongest known to date, though there are very few absolute extinction curves known outside the Local Group. The feature becomes gradually weaker in the LMC and SMC. The two broad categories of LMC sightlines are LMC-average, having MW-type extinction curves, and LMC2 supershell showing weaker bumps and a steep rise into the UV (Nandy et al. 1981; Gordon et al. 2003). The SMC sightlines exhibit a featureless extinction curve and an even steeper rise into the UV. However a line of sight through the SMC wing exhibits an extinction curve with a prominent 2175 Å bump (Lequeux et al. 1982; Gordon et al. 2003).
| Mid-time | Exp. time | Instrument | Filters | Magnitudes |
|---|---|---|---|---|
| hr | ks | AB mag | ||
| 0.202 | 0.02 | UVOT | ||
| 6.158 | 0.54 | UVOT | ||
| 0.194 | 0.04 | UVOT | ||
| 8.375 | 0.26 | UVOT | ||
| 0.201 | 0.04 | UVOT | ||
| 4.546 | 0.50 | UVOT | ||
| 0.208 | 0.04 | UVOT | ||
| 5.160 | 0.28 | UVOT | ||
| 0.214 | 0.02 | UVOT | ||
| 7.769 | 0.58 | UVOT | ||
| 0.113 | 0.39 | UVOT | ||
| 0.323 | 0.39 | UVOT | ||
| 6.772 | 0.24 | UVOT | ||
| 0.042 | 0.10 | UVOT | ||
| 0.196 | 0.10 | UVOT | ||
| 1.555 | 0.14 | GROND | ||
| 2.785 | 1.50 | GROND | ||
| 1.555 | 0.14 | GROND | ||
| 2.785 | 1.50 | GROND | ||
| 5.512 | 3.23 | GROND | ||
| 6.504 | 3.23 | GROND | ||
| 1.555 | 0.14 | GROND | ||
| 2.785 | 1.50 | GROND | ||
| 1.555 | 0.14 | GROND | ||
| 2.785 | 1.50 | GROND | ||
| 1.555 | 0.24 | GROND | ||
| 2.785 | 1.20 | GROND | ||
| 6.021 | 6.93 | PAIRITEL | ||
| 9.528 | 9.22 | PAIRITEL | ||
| 1.555 | 0.24 | GROND | ||
| 2.785 | 1.20 | GROND | ||
| 6.021 | 6.93 | PAIRITEL | ||
| 9.528 | 9.22 | PAIRITEL | ||
| 1.555 | 0.24 | GROND | ||
| 2.785 | 1.20 | GROND | ||
| 6.021 | 6.93 | PAIRITEL | ||
| 9.528 | 9.22 | PAIRITEL |
| Time since trigger | Exp. time | Instrument | Filters | Magnitudes |
|---|---|---|---|---|
| hr | s | AB mag | ||
| 3.968 | 1104 | UVOT | ||
| 3.958 | 415 | UVOT | ||
| 2.248 | 1082 | UVOT | ||
| 2.404 | 1081 | UVOT | ||
| 0.283 | 150 | VLT/FORS2 | ||
| 0.719 | 150 | VLT/FORS2 | ||
| 3.102 | 1082 | UVOT | ||
| 0.080 | 66 | GROND | ||
| 0.243 | 40 | VLT/FORS2 | ||
| 0.679 | 40 | VLT/FORS2 | ||
| 3.331 | 1207 | UVOT | ||
| 2.513 | 1180 | UVOT | ||
| 0.080 | 66 | GROND | ||
| 0.150 | 30 | VLT/FORS2 | ||
| 0.322 | 30 | VLT/FORS2 | ||
| 0.585 | 30 | VLT/FORS2 | ||
| 0.784 | 10 | VLT/FORS2 | ||
| 0.822 | 10 | VLT/FORS2 | ||
| 2.325 | 120 | VLT/FORS2 | ||
| 0.080 | 66 | GROND | ||
| 0.216 | 40 | VLT/FORS2 | ||
| 0.652 | 40 | VLT/FORS2 | ||
| 0.080 | 66 | GROND | ||
| 0.180 | 60 | VLT/FORS2 | -Gunn | |
| 0.616 | 60 | VLT/FORS2 | -Gunn |
The net attenuation curves of local starburst galaxies show that their dust lacks the 2175 Å bump (Calzetti et al. 1994). A significant 2175 Å bump is observed in the spectra of star forming galaxies at , indicating an LMC-like extinction curve (Noll et al. 2007). It has also been detected in the Great Observatories Origins Deep Survey (GOODS)-Herschel field galaxies at (Buat et al. 2011). The detection of the 2175 Å bump has been reported in several individual distant absorbing systems (e.g., Junkkarinen et al. 2004; Wang et al. 2004; Noterdaeme et al. 2009; Zhou et al. 2010; Jiang et al. 2011). The feature has also been detected in the SEDs of GRB afterglows with a large diversity of extinction curve shapes (Krühler et al. 2008; Elíasdóttir et al. 2009; Prochaska et al. 2009; Perley et al. 2011; Zafar et al. 2011). The detection of the 2175 Å bump is also reported for an intervening absorber at towards GRB 060418 (Ellison et al. 2006).
GRBs provide a unique tool for studying the absolute extinction curves of distant galaxies because of their bright afterglow emission, simple power-law spectra and their occurrence in star-forming regions. In this paper we report in detail the observations and analyses of two extinguished GRB afterglows showing a 2175 Å bump in their optical spectra: GRB 080605 and GRB 080805,which we compare to the two spectroscopically-confirmed 2175 Å bumps in GRB hosts. Previously optical spectra of there afterglows of GRB 080605 and GRB 080805 have been presented in Fynbo et al. (2009) and the SEDs have been discussed briefly in Zafar et al. (2011). Based on photometry, the detection of the bump has also been confirmed for both afterglows (Greiner et al. 2011).
The paper is organized as follows: In §2 we describe multi-wavelength observations of the afterglows of GRB 080605 and GRB 080805 carried out with different instruments. In §3 we present our results from the SED fitting. In §4 we make a comparison between the bump properties of 42 GRB afterglows and Local Group sightlines. We further discuss the extinction curve of GRB 080605. In §5 we provide our conclusions.
2. Observations and data reduction
2.1. GRB 080605
Swift Burst Alert Telescope (BAT; Barthelmy et al. 2005) triggered on GRB 080605 on 2008 June 05 at 23:47:57.86 UT. Swift X-ray Telescope (XRT; Burrows et al. 2005) slew immediately to GRB location and began observing the X-ray afterglow of GRB 080605. The Gamma-Ray Optical and Near-Infrared Detector (GROND) observed the field in different optical and NIR bands (Greiner et al. 2011). The afterglow was also observed with the Peters Automatic Infrared Imaging Telescope (PAIRITEL; Bloom et al. 2006) in the , , and bands starting from 5 to 11 and then 31 hrs after the burst. The GRB is found close to a bright star, which may contribute to the measured flux. We reduced the PAIRITEL data and used image subtraction techniques (Alard 2000) to get reasonable photometry of the afterglow. To increase the signal to noise ratio we stacked the images from 5-7 hrs and 8-11 hrs post-burst. The afterglow is clearly detected up to 11 hrs after the burst whereas it is not detected at 31 hrs after the burst (see Table 1). We also reduced the Swift Ultra-violet and Optical Telescope (UVOT; Roming et al. 2005) data of the afterglow. After subtracting the contribution from the nearby object we found that the afterglow is not detected in any of the UVOT bands. The host galaxy of GRB 080605 is bright, with mag (see Krühler et al. 2011) and the contribution is subtracted from the photometric data.
An optical spectrum of the afterglow was secured at the Very Large Telescope (VLT) equipped with the FOcal Reducer and low dispersion Spectrograph 2 (FORS2) using the 300V grism at 3.2 hrs (2 exposures with an exposure time of 1200 s each) after the burst (Jakobsson et al. 2008b; Fynbo et al. 2009). Spectra were also secured with the 1200R and 1400V grisms yielding a spectral resolution of and respectively. The 300V spectrum was flux calibrated using the spectrum of a spectrophotometric standard star LTT9239 obtained on the same night. The afterglow spectra were taken under good observing conditions. The spectra show several narrow absorption lines with the highest redshift of the absorber at , which we adopt as the redshift of the GRB. All photometric and spectroscopic data have been corrected for Galactic extinction using the maps of Schlegel et al. (1998), mag.
Ly absorption could not be detected for this burst with a ground-based telescope due to the relatively low redshift (see Fynbo et al. 2009 for the optical spectrum). A large number of metal species (e.g. Si, C, Al, Zn, Fe, Mg, Mn and Cr) are identified at the redshift of the GRB (Fynbo et al. 2009). To obtain a limit on the ionic column densities, we analyzed all grism spectra. The absorption features indicate a two component profile in the 1200R and 1400V spectra. The GRB absorption features are saturated and the resolution is not high enough to estimate reliable limits for the metal column density. Assuming the Mn ii 2577 line is located at the weak limit of the curve of growth, this would imply that (Mn ii) cm-2. The metallicity of the GRB cannot be obtained from the afterglow spectrum due to the absence of Ly absorption trough. The metallicity inferred from emission lines from the host is around solar (Krühler et al. 2012). Moreover the equivalent widths of metal lines are compared with Fynbo et al. (2009) and Christensen et al. (2011) sample. The equivalent widths of metal lines of GRB 080605 lie above the average for most elements except Fe and Zn. The lower equivalent width for Fe could be due to dust depletion.
2.2. GRB 080805
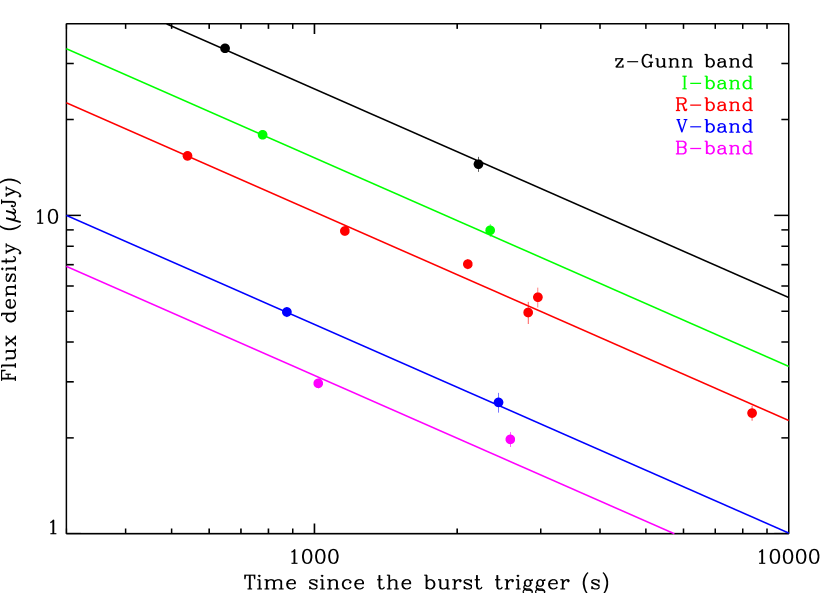
At 07:41:34.73 UT on 2008 August 05 after the BAT trigger, Swift XRT began observations of GRB 080805. GROND observed the afterglow at 4.6 min after the burst in the , , and filters. Further imaging of the afterglow was performed with VLT/FORS2 in the Bessel , , , and -Gunn filters starting from 9 to 139.5 min after the burst (see Table 2). VLT/FORS2 photometric data were reduced in standard way. The magnitudes of the afterglow were obtained using ESO zero-points from the night of the observation (for filters) and by observing a standard field covered by the Sloan Digital Sky Survey (SDSS) for the -Gunn band. Fitting the -band afterglow lightcurve provides a temporal index of (see Fig. 1).
The optical spectrum of the afterglow was taken with VLT/FORS2 (grism 300V) at 1.0 hr (2 exposures, each of 600 s) after the burst (Jakobsson et al. 2008a; Fynbo et al. 2009). The spectrum was flux calibrated using the spectrum of a spectrophotometric standard star LTT1020 observed on the same night. The spectra were also obtained with the 1400V, 1200R and 1028z () grisms (Jakobsson et al. 2008a). The data were taken under photometric conditions. The UVOT data of the afterglow was reduced and the source was not detected in any of the filters. The redshift is based on a metal system at displaying Al ii 1671, Fe ii 2382, 2586, 2600, Mg ii 2796, 2803 and Mg i 2852 absorption lines. All data have been corrected for Galactic extinction using the Schlegel et al. (1998) maps with mag.
The Ly absorption line is also not seen for this burst due to its relatively low redshift. Because of the low resolution and highly saturated absorption features, ionic column densities could not be obtained for this burst. We compared equivalent widths of metal lines of this burst with Fynbo et al. (2009) and Christensen et al. (2011) composite samples and find overabundance in Al and Mg. Fe lie about average and this might indicate depletion.
| Parameter | GRB 080605 | 080805 | ||
|---|---|---|---|---|
| (hr) | 1.55 | 2.78 | 0.08 | 0.72 |
| (m) | ||||
| (m2) | (f) | (f) | ||
| (m-1) | (f) | (f) | ||
| (m-1) | ||||
| (f) | (f) | |||
| (m-1) | ||||
| (mag) | ||||
| /dof | 31/18 | 733/840 | 22/11 | 1268/1317 |
2.3. X-ray data
For the two GRB afterglows the Swift XRT data were downloaded from the Swift data archive. The X-ray data were reduced using HEAsoft (version 6.10). GRB afterglow spectra were extracted in the 0.3–10.0 keV energy range using the latest calibration files. X-ray spectra were obtained near the time of the photometric data. The afterglow lightcurves were retrieved from the GRB light curve repository at the UK Swift Science Data Centre, created as described in Evans et al. (2010). The lightcurves were fitted by assuming a smoothly broken power-law (Beuermann et al. 1999). Using the lightcurve fit, the X-ray spectra were then scaled to the relevant SED time by considering the photon weighted mean time of the X-ray spectra. We used the fitting procedure described in Zafar et al. (2011) where the X-ray spectra are fitted and corrected for soft X-ray absorption below 3 keV within XSPEC. The spectrum of GRB 080605 was fitted using a single power-law (PL) with a best fit photon index of and frozen for Galactic X-ray absorption of cm-2 (using the nH FTOOL; Kalberla et al. 2005). The equivalent neutral hydrogen column density from the host galaxy of GRB 080605, estimated from soft X-ray absorption is cm-2. The X-ray spectrum of GRB 080805 was fitted with a best fit photon index of with fixed Galactic absorption ( cm-2). The derived equivalent hydrogen column density is cm-2.
3. Results
We use a PL or broken power-law (BPL) to fit the SEDs and model the extinction with the parameterized extinction curve defined in Fitzpatrick & Massa (1990) constitute of a UV linear component and a Drude component describing the UV/optical extinction curve in the rest frame of the object. In addition we used the parameter from Fitzpatrick & Massa (2007). We will refer to the extinction model as FM. The parameterized extinction curve for m-1 is written as
| (1) |
where
where (m-1), and the Lorentzian-like Drude profile is expressed as
| (2) |
where is the peak position, is the bump width and is the bump strength. The UV linear component is controlled by the intercept and slope . The extinction properties in the optical and infrared ( m-1) are derived using spline interpolation. Additional useful quantities can be defined using the UV parameters e.g., measures the area of the bump and measures the maximum height of the bump above the UV linear extinction (Fitzpatrick & Massa 2007). SEDs of GRB afterglows are modelled with the parameterized extinction curve in the rest-frame of the GRB.
We used the uncertainties on the data-points to create 1000 Monte Carlo (MC) Gaussian random realizations. We fit these realizations, and in Table 3 we list the standard deviation of this distribution as statistical errors on the best fit parameters. It should be noted as a caveat, that the fitting parameters of the FM model are strongly correlated (see Fitzpatrick & Massa 2007, for a detailed discussion), meaning that the introduction of new data which may change the overall slope for example, also impact the values of many of the other parameters, as observed in the difference between the best-fit parameters here where we have new NIR data, and Zafar et al. (2011) for GRB 080605 without this data. This caution is applicable in this paper especially to GRB 080805 where we have had to assume a value for .
3.1. SED of GRB 080605
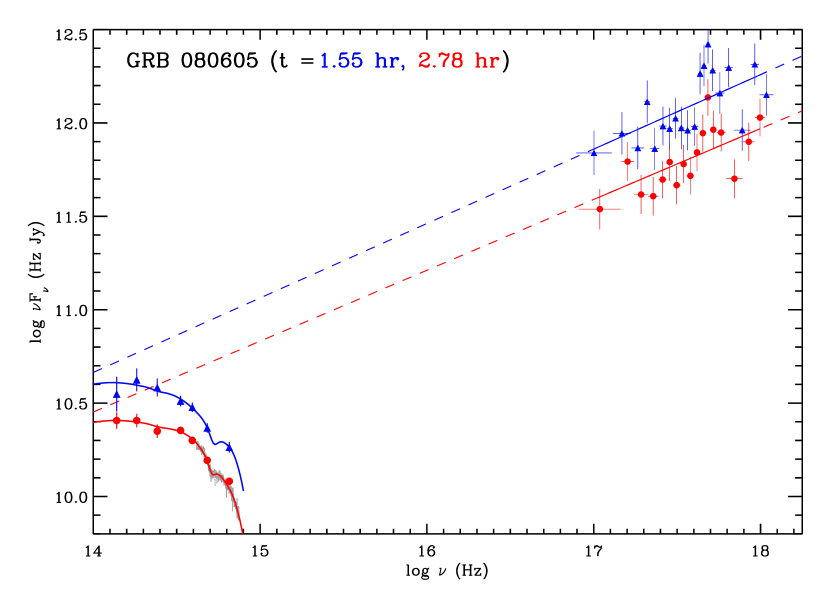
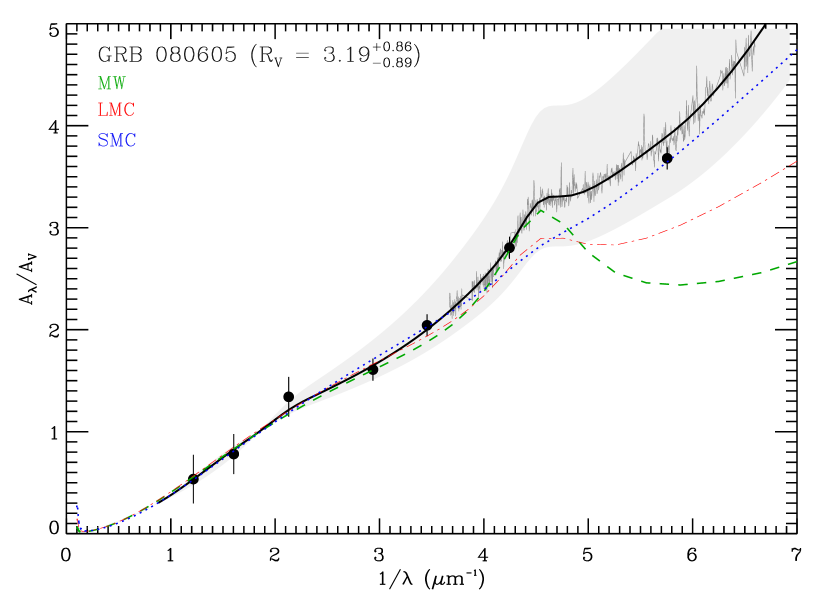
The SED of the afterglow of GRB 080605 is extracted at two epochs i.e. 1.55 and 2.78 hrs after the burst (see Fig. 2). The GROND-XRT and FORS2/GROND-XRT data were fitted at 1.55 and 2.78 hrs respectively. The FM parameterization is used to fit the afterglow SEDs (see §3). The data from both epochs were well fit with a single PL and a 2175 Å bump. The results of the fits are reported in Table 3. The model cannot constrain the and parameters at 1.55 hrs due to a lack of far-UV data, therefore, the values are fixed to the best fit value of 2.78 hrs. The best-fit parameters from both epochs are all consistent within the 90% interval (see Table 3). The extinction curve from the best-fit model at 2.78 hrs is better-constrained, and so we use this to examine the extinction properties of the afterglow of GRB 080605 (Fig. 3). The extinction curve (in units of /) of the GRB rises steeply into the UV like the SMC extinction curve but has a significant 2175 Å bump (see §4). The at 1.55 hrs epoch is 2 significant. We also fit the data with Pei (1992) SMC model and found that model without the bump is not a significantly better fit with an F-test probability of 90% (SMC:/dof=53/24, FM:/dof=31/18). At 2.78 hrs epoch is significant. The derived metals-to-dust ratio based on 2.78 hrs epoch results is cm-2 mag-1.
The FORS2-XRT SED of the afterglow was previously published in Zafar et al. (2011) at 1.74 hrs after the burst, finding a large amount of extinction with . Because of the lack of NIR data, the extinction curve was not constrained well in that fit, resulting in a larger and relatively flatter extinction curve Zafar et al. (2011). Greiner et al. (2011) implemented a GROND-XRT joint fit and found with the Pei (1992) MW dust extinction curve, similar to the value of found here.
3.2. SED of GRB 080805
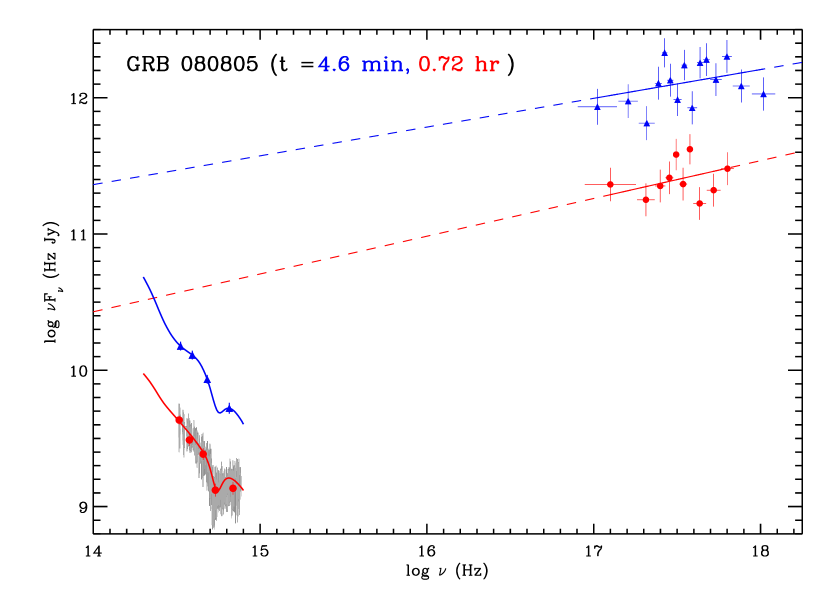
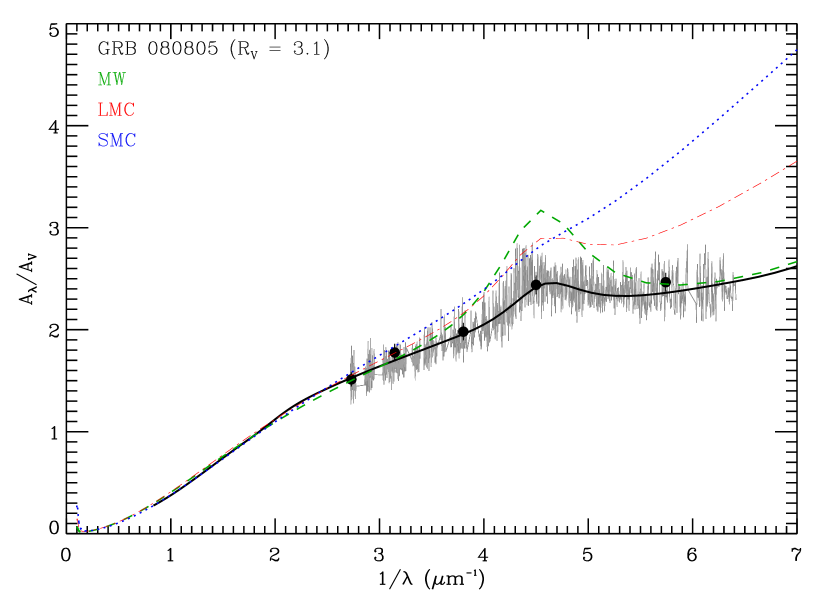
The SED of the afterglow of GRB 080805 was constructed at 4.6 min and 0.72 hr after the burst. The GROND-XRT and FORS2-XRT SEDs are well fitted with a single PL and a 2175 Å bump (see Fig. 4). The cannot be constrained for this burst because of the lack of NIR data, therefore, the value is fixed to the average value of the MW i.e. . Because we do not have a detection in the far-UV at 4.6 min after the burst, the and fit parameters are fixed to the best-fit value of 0.72 hr epoch results. The at 0.72 hrs epoch is 5 significant. At 4.6 min epoch is 1 significant. Because of less available data in the optical at 4.6 min, the significance of the bump cannot confirmed at this epoch. We, therefore, rely mostly on 0.72 hrs epoch results for GRB 080805. At 4.6 min after the burst Greiner et al. (2011) found that GROND-XRT data fit well with a BPL and Pei (1992) LMC dust model. We determine from the optical spectrum that the bump seen for GRB 080805 is not LMC-like and has smaller strength and width to that of the Pei (1992) LMC bump. We fit the data with the FM extinction model using the 0.72 hr SED best-fit results as an initial guess and found that the SED can be well reproduced by a single PL and required a 2175 Å bump. We also fit the data with Pei (1992) LMC model and found that a broken power-law is not a significantly better fit with an F-test probability of 83% (PL:/dof=25/16, BPL:/dof=20/14).
The extinction curve of the afterglow of GRB 080805 was generated by using the best fit model obtained at 0.72 hr after the burst (see Fig. 5). Due to the lack of the rest-frame optical/NIR data the overall slope of the extinction curve is not robust for this burst and can deviate from the one shown in Fig. 5, resulting in a smaller or larger . The inferred metals-to-dust ratio based on 0.72 hr epoch results is cm-2 mag-1. It is also worth noting that Schlegel et al. (1998) maps have been confirmed by Dutra et al. (2003) up to mag. Assuming an uncertainty of 15% (Schlafly et al. 2010), we find that uncertainty in the Galactic extinction correction does not affect our results for both GRB afterglows and is always smaller than our statistical uncertainties.
3.3. SED fitting of the GRB afterglow sample
In this work, we re-fit the GRB afterglow data published in the spectroscopic sample study of Zafar et al. (2011) with the FM extinction model. This was done to obtain the bump parameters especially (bump strength) and (bump width) to study the 2175 Å bump properties i.e.: ) how common the 2175 Å bump is in GRB sightlines, ) variation in the bump strength, width and area from one GRB sightline to another, and ) do the GRB bump properties resemble those found in the Local Group? We fit SEDs of 38 GRB afterglows observed with the VLT/FORS instrument (see Zafar et al. 2011, for the complete list of afterglows). All 38 GRBs in Zafar et al. (2011) prefer an SMC-type extinction curve. We re-fit those GRBs with the FM extinction model and chose Gordon et al. (2003) mean SMC parameters as an initial guess. From our FM fitting analysis we find that all GRBs with best fit SMC-type extinction curve in Zafar et al. (2011) have insignificant values of (). We report upper limits for for all 38 afterglows (see Fig. 6). GRB 070802 and GRB 080607 are not re-fitted in the current analysis because of having been fit with the FM extinction model in Zafar et al. (2011). We use results for both afterglows from the analysis published in Zafar et al. (2011). GRB 080605 and GRB 080805 are, of course, reviewed in detail in this work and we use results from the current analysis (see Table 3).
4. Discussion
It has previously been found that GRBs reside in low-mass, faint, sub-luminous, and blue galaxies (e.g., Le Floc’h et al. 2003). However recent studies show that GRBs also occur in a population of dusty, luminous, red and evolved galaxies (Piro et al. 2001; Levan et al. 2006; Berger et al. 2007; Chen et al. 2010; Krühler et al. 2011). This suggests the previously known faint, young, and low-mass galaxy population is not representative of GRB hosts as a whole. The paucity of the 2175 Å bump found in the afterglows of GRBs to date seems likely to be an indication of our lack of spectroscopic completeness due to dust bias (Zafar et al. 2011) and coincides with the suggestion of Noll et al. (2007) that dust with a significant 2175 Å bump requires an evolved population.
The association between the carriers of the 2175 Å bump and evolved stellar populations would manifest itself also in the host galaxies of the respective GRBs. In comparison to the general population of GRB hosts, these galaxies should have higher stellar masses, higher IR luminosities and global metallicities. Such a trend is indeed observed in recent host samples, which indicate that, on average, galaxies hosting afterglows with a 2175 Å bump are redder, more massive and luminous than the standard GRB host (Krühler et al. 2011). Similarly, the host of GRB 080605 exhibits high gas-phase metallicity above 0.4 solar which puts it among the most metal rich GRB hosts ever detected (Krühler et al. 2012). Although number statistics and high-quality host observations are still sparse, the properties of the host galaxies hence seem to support the assertion that the presence of the 2175 Å bump traces environments with evolved stellar populations and substantial chemical enrichment.
Below we compare the results of this analysis to Local Group sightlines to investigate the general properties of the dust in GRB hosts. We discuss the extinction curve of GRB 080605 which is surprisingly different from typical Local Group extinction curves. Cardelli & Clayton (1991) showed that Galactic sightlines could typically be well-fit with a -dependent extinction curve. There are a few Galactic sightlines which are not adequately represented by the Cardelli & Clayton (1991) extinction curve (Sofia et al. 2005). We also investigate whether the bump is correlated with the presence of neutral carbon in the gas phase.
4.1. Comparison with Local Group sightlines
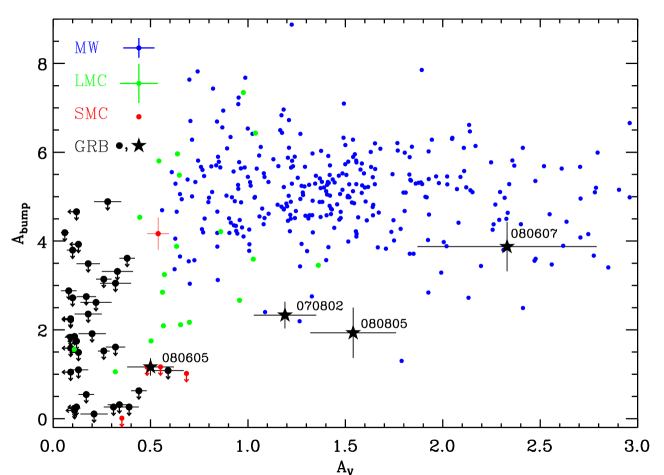
Using the results of the FM fitting analysis, we calculated the area and maximum height of the bump for the GRB afterglow sample of Zafar et al. (2011) by using the relations described above (see § 3). In Fig. 6 we plot against and compare the GRB afterglow sample results to the lines of sight in the MW (Fitzpatrick & Massa 2007), LMC and SMC (Gordon et al. 2003). We find that (hence the strength and the maximum height of the 2175 Å bump) for the four GRB afterglows with spectroscopically detected 2175 Å bumps, is typically smaller than for the vast majority of known Local Group sightlines for a given value of . In other words, the bump for GRB afterglows is not as prominent as in lines of sight in the Local Group. It is interesting to note that it is not simply that the bumps seen in GRB afterglows are weaker and shallower than the bumps seen in the lines of sight in the MW—the extinction curves of GRB afterglows are expected to be different from the MW extinction curves—the bumps are also weaker than those detected in the Magellanic Clouds, where one might expect the dust to be similar, because we are probing actively star-forming environments rather than quiescent regions (see Gordon et al. 2003).
The results of this work imply that the common usage of the average MW, LMC and SMC extinction models to fit the GRB afterglow SEDs is inadequate (see also Clayton et al. 2000; Gordon et al. 2003). Here we have shown that GRB sightlines with bumps can have weaker bumps than either LMC or MW and bumps in combination with a steep extinction curve, both highly uncharacteristic of most Local Group sightlines. In reality Local Group sightlines exhibit a variety of extinction curves. This work shows that, similar to the Local Group, GRB hosts seem to have a continuum of dust extinction curves varying from steep to flat and bumpy to featureless. In future, better rest-frame UV through NIR data will allow us to obtain reasonable numbers of extinction curves of individual events (see § 5.2 of Zafar et al. 2011). In support of this objective the X-shooter spectrograph on the VLT is now regularly obtaining UV through NIR spectra of GRB afterglows (e.g., de Ugarte Postigo et al. 2010; D’Elia et al. 2010).
4.2. Dust composition
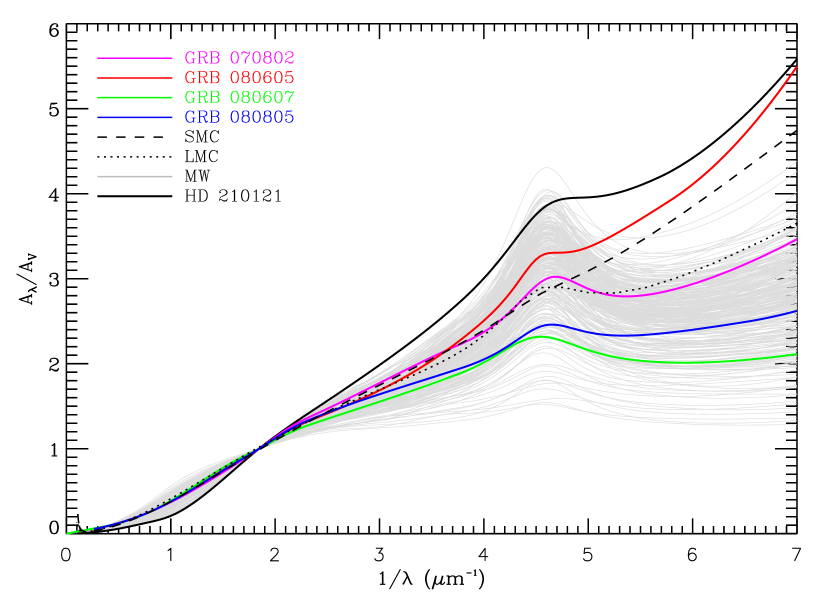
The extinction curve of GRB 080605 has a steeper rise into the UV and a weak 2175 Å bump. Such extinction is also seen in the MW in the lines of sight toward HD 210121, and to some extent, HD 62542, and HD 204827, all of which deviate substantially from the other MW extinction curves (Valencic et al. 2003). The two other interesting extinction curves in the MW are lines of sight towards HD 283809 and HD 29647 showing a weaker bump but a regular flat UV curvature (Clayton et al. 2003; Whittet et al. 2004). Among these, the sightline towards HD 210121 is very unusual, displaying a very steep rise into the far-UV, a small value of and a weak 2175 Å bump (Larson et al. 2000; Sofia et al. 2005; see Fig. 7). Weingartner & Draine (2001) showed that their carbonaceous/silicate dust model can reproduce the extinction towards HD 210121. They suggested two ways of reproducing the 2175 Å bump: by introducing either small graphite particles or a population of small carbonaceous grains including PAH molecules, and, more likely, the rise into the far-UV may be due to a population of silicate grains (see Weingartner & Draine 2001).
The relative weakness of the GRB afterglow bumps compared to Local Group sightlines hints at the possibility that sightlines with a 2175 Å feature may be composed of two distinct, physically separated dust populations, one with a steep extinction curve and no bump, the other with a relatively flat extinction curve and a strong bump. The steep, featureless curve would then dilute the strength of the bump, and potentially produce the type of extinction curve observed in GRB 080605. In this scenario, both dust populations may reside in the GRB host (e.g. in the molecular cloud in which the GRB forms and in the more general host ISM), or one of the populations in a foreground system. In the case of GRB 070802, for example, we know that there is a foreground absorber at lower redshift with a relatively high metal column density (Elíasdóttir et al. 2009), however, strong dust absorption in foreground systems will not be the typical case. Rather, we have some evidence that two distinct column densities exist in the gas phase within the host galaxy: one nearby and one relatively distant (Perna & Lazzati 2002; Watson et al. 2007; Schady et al. 2011; Vreeswijk et al. 2007; Campana 2009; Krühler et al. 2011). The unusual dust properties observed here may simply be a reflection of this dual population.

4.3. The 2175 Å bump and C i
The first ionization potential of carbon is 11.3 eV. It is not shielded by neutral hydrogen and hence only expected to be present in regions with a low density of ionizing photons. Carbonaceous materials are believed to be responsible for the 2175 Å bump, and carbonaceous grain growth and formation requires neutral carbon and molecules (Henning & Salama 1998). Therefore it would not be surprising to see both features together from the same environment. In the literature we find two detections of the C i absorption feature in the lines of sight towards the Local Group: the line of sight towards HD 185418 in the MW (Sonnentrucker et al. 2003) and the line of sight towards the SMC-bar with C i detected in the MW but only as an upper limit in the SMC (Welty et al. 1997). Beyond the Local Group, C i absorption is detected in many systems (e.g., Ledoux et al. 2002; Jorgenson et al. 2010). Junkkarinen et al. (2004) reported the detection of 2175 Å bump for an intervening damped Ly absorber () towards AO 0235+164 where C i absorption line is also seen (see also §4.3 Elíasdóttir et al. 2009 for more discussion).
To our knowledge C i is detected for all GRB afterglows with a prominent 2175 Å bump except for GRB 080805 due to its low signal-to-noise ratio and redshift. Conversely, C i is also detected in the afterglow spectra of GRB 060210 and GRB 061121 (see Fynbo et al. 2009). However, GRB 060210 is at , so that the bump region is not covered in the optical spectrum. GRB 061121 is at and has no detection of the 2175 Å bump. The spectra of both afterglows appear to be blue suggesting little dust extinction for these bursts. We also looked into the spectrum of GRB 060418 which has a reported intervening absorber at with a 2175 Å bump. At this redshift C i is blended with the C iv doublet arising from the GRB host galaxy (). Fitting the C iv doublet leaves a residual, suggesting the presence of another line, most probably Ci from the intervening absorber.
It is striking that the extinguished afterglows with detected C i absorption also have a 2175 Å bump. The presence of C i absorption in the afterglows with the 2175 Å bump suggests that the UV radiation field is weaker in these GRBs. In Fig. 8 we attempt to quantify this with the very little data we have. It is possible that there may be a correlation between the area under the bump and the rest-frame equivalent width of C i 1656.9. The numbers are too small, however, to confirm any relation. Such a correlation would suggest that we expect to see large equivalent widths of C i for strong bumps and less for weak ones. It should be noted that the ground electronic state of C i split into three fine structure states as C i, C i*, and C i** (see e.g., Jorgenson et al. 2010). In our low resolution data we cannot distinguish the strength of the various contributions of the excited states. If C i line is not saturated then the EW of the complex is a useful indication of the column density of neutral carbon. But if C i line is saturated and in the presence of significant excited states of C i, our EW measurements may not be a meaningful measure of the column density in C i.
We briefly also compared the area of the bump with the underlying UV slope of the GRB extinction curves i.e. . We find a hint of a relationship between the two quantities suggesting that smaller C i equivalent widths are observed for GRBs with steeper UV extinction curve slopes and vice versa. In future such relationships can be checked with a larger sample of detected 2175 Å bump and significant C i absorption. If such a correlation holds then C i could be used as a spectroscopic signature to locate the 2175 Å bump in dusty environments.
5. Conclusions
In this paper, we investigated the 2175 Å bump observed in GRB afterglows. We performed multi-epoch NIR–X-ray SED analysis of GRB 080605 and 080805 displaying 2175 Å bumps in their optical spectra. We find the SEDs to be well fitted with a PL and an FM extinction model at different epochs. So far the bump is spectroscopically detected in the spectra of five GRB afterglows where one is in an intervening absorber. We compare the bump properties of our GRB afterglow sample to Local Group sightlines. We find that for GRB afterglows is smaller for a given than almost all Local Group sightlines. All four GRB extinction curves with detected 2175 Å bumps differ from one another. The differences in the extinction curves suggest that the use of the average MW, LMC and SMC extinction curve is inadequate. In particular, we know that the extinction curve of the afterglow of GRB 080605 is very different from the other GRB extinction curves, with a 2175 Å bump and steep rise into the far-UV. Such extinction curves and the relative faintness of the bump strength with total extinction might suggest that the dust we observe in the afterglow spectrum consists of two different grain populations having different compositions. The presence of the bump also contradicts the common notion that GRBs occur only in blue, low-mass and faint galaxies. We find a hint of a possible relationship between and neutral carbon for GRB afterglows that needs to be further investigated.
References
- Alard (2000) Alard, C. 2000, A&AS, 144, 363
- Barthelmy et al. (2005) Barthelmy, S. D., et al. 2005, Space Sci. Rev., 120, 143
- Berger et al. (2007) Berger, E., Fox, D. B., Kulkarni, S. R., Frail, D. A., & Djorgovski, S. G. 2007, ApJ, 660, 504
- Beuermann et al. (1999) Beuermann, K., et al. 1999, A&A, 352, L26
- Bloom et al. (2006) Bloom, J. S., Starr, D. L., Blake, C. H., Skrutskie, M. F., & Falco, E. E. 2006, in Astronomical Society of the Pacific Conference Series, Vol. 351, Astronomical Data Analysis Software and Systems XV, ed. C. Gabriel, C. Arviset, D. Ponz, & S. Enrique, 751
- Buat et al. (2011) Buat, V., et al. 2011, A&A, 533, A93
- Burrows et al. (2005) Burrows, D. N., et al. 2005, Space Sci. Rev., 120, 165
- Calzetti et al. (1994) Calzetti, D., Kinney, A. L., & Storchi-Bergmann, T. 1994, ApJ, 429, 582
- Campana (2009) Campana, S. 2009, ApJ, 699, 1144
- Cardelli & Clayton (1991) Cardelli, J. A., & Clayton, G. C. 1991, AJ, 101, 1021
- Chen et al. (2010) Chen, H., et al. 2010, ApJ, 723, L218
- Christensen et al. (2011) Christensen, L., Fynbo, J. P. U., Prochaska, J. X., Thöne, C. C., de Ugarte Postigo, A., & Jakobsson, P. 2011, ApJ, 727, 73
- Clayton et al. (2003) Clayton, G. C., et al. 2003, ApJ, 592, 947
- Clayton et al. (2000) Clayton, G. C., Gordon, K. D., & Wolff, M. J. 2000, ApJS, 129, 147
- de Ugarte Postigo et al. (2010) de Ugarte Postigo, A., et al. 2010, A&A, 513, A42
- D’Elia et al. (2010) D’Elia, V., et al. 2010, A&A, 523, A36
- Draine (2003) Draine, B. T. 2003, ARA&A, 41, 241
- Dutra et al. (2003) Dutra, C. M., Ahumada, A. V., Clariá, J. J., Bica, E., & Barbuy, B. 2003, A&A, 408, 287
- Elíasdóttir et al. (2009) Elíasdóttir, Á., et al. 2009, ApJ, 697, 1725
- Ellison et al. (2006) Ellison, S. L., et al. 2006, MNRAS, 372, L38
- Evans et al. (2010) Evans, P. A., et al. 2010, A&A, 519, A102
- Fitzpatrick & Massa (1990) Fitzpatrick, E. L., & Massa, D. 1990, ApJS, 72, 163
- Fitzpatrick & Massa (2007) —. 2007, ApJ, 663, 320
- Fynbo et al. (2009) Fynbo, J. P. U., et al. 2009, ApJS, 185, 526
- Gordon et al. (2003) Gordon, K. D., Clayton, G. C., Misselt, K. A., Landolt, A. U., & Wolff, M. J. 2003, ApJ, 594, 279
- Greiner et al. (2011) Greiner, J., et al. 2011, A&A, 526, A30
- Henning & Salama (1998) Henning, T., & Salama, F. 1998, Science, 282, 2204
- Henrard et al. (1997) Henrard, L., Lambin, P., & Lucas, A. A. 1997, ApJ, 487, 719
- Jakobsson et al. (2008a) Jakobsson, P., Fynbo, J. P. U., Vreeswijk, P. M., & de Ugarte Postigo, A. 2008a, GRB Coordinates Network, 8077, 1
- Jakobsson et al. (2008b) Jakobsson, P., Vreeswijk, P. M., Xu, D., & Thoene, C. C. 2008b, GRB Coordinates Network, 7832, 1
- Jiang et al. (2011) Jiang, P., Ge, J., Zhou, H., Wang, J., & Wang, T. 2011, ApJ, 732, 110
- Jorgenson et al. (2010) Jorgenson, R. A., Wolfe, A. M., & Prochaska, J. X. 2010, ApJ, 722, 460
- Junkkarinen et al. (2004) Junkkarinen, V. T., Cohen, R. D., Beaver, E. A., Burbidge, E. M., Lyons, R. W., & Madejski, G. 2004, ApJ, 614, 658
- Kalberla et al. (2005) Kalberla, P. M. W., Burton, W. B., Hartmann, D., Arnal, E. M., Bajaja, E., Morras, R., & Pöppel, W. G. L. 2005, A&A, 440, 775
- Krühler et al. (2012) Krühler, T., et al. 2012, A&A submitted arXiv:1203.1919
- Krühler et al. (2011) —. 2011, A&A, 534, A108
- Krühler et al. (2008) —. 2008, ApJ, 685, 376
- Larson et al. (2000) Larson, K. A., Wolff, M. J., Roberge, W. G., Whittet, D. C. B., & He, L. 2000, ApJ, 532, 1021
- Le Floc’h et al. (2003) Le Floc’h, E., et al. 2003, A&A, 400, 499
- Ledoux et al. (2002) Ledoux, C., Srianand, R., & Petitjean, P. 2002, A&A, 392, 781
- Lequeux et al. (1982) Lequeux, J., Maurice, E., Prevot-Burnichon, M., Prevot, L., & Rocca-Volmerange, B. 1982, A&A, 113, L15
- Levan et al. (2006) Levan, A., et al. 2006, ApJ, 647, 471
- Mathis (1994) Mathis, J. S. 1994, ApJ, 422, 176
- Nandy et al. (1981) Nandy, K., Morgan, D. H., Willis, A. J., Wilson, R., & Gondhalekar, P. M. 1981, MNRAS, 196, 955
- Noll et al. (2007) Noll, S., Pierini, D., Pannella, M., & Savaglio, S. 2007, A&A, 472, 455
- Noterdaeme et al. (2009) Noterdaeme, P., Ledoux, C., Srianand, R., Petitjean, P., & Lopez, S. 2009, A&A, 503, 765
- Pei (1992) Pei, Y. C. 1992, ApJ, 395, 130
- Perley et al. (2011) Perley, D. A., et al. 2011, AJ, 141, 36
- Perna & Lazzati (2002) Perna, R., & Lazzati, D. 2002, ApJ, 580, 261
- Piro et al. (2001) Piro, L., et al. 2001, ApJ, 558, 442
- Prochaska et al. (2009) Prochaska, J. X., et al. 2009, ApJ, 691, L27
- Roming et al. (2005) Roming, P. W. A., et al. 2005, Space Sci. Rev., 120, 95
- Schady et al. (2011) Schady, P., Savaglio, S., Krühler, T., Greiner, J., & Rau, A. 2011, A&A, 525, A113
- Schlafly et al. (2010) Schlafly, E. F., Finkbeiner, D. P., Schlegel, D. J., Jurić, M., Ivezić, Ž., Gibson, R. R., Knapp, G. R., & Weaver, B. A. 2010, ApJ, 725, 1175
- Schlegel et al. (1998) Schlegel, D. J., Finkbeiner, D. P., & Davis, M. 1998, ApJ, 500, 525
- Sofia et al. (2005) Sofia, U. J., et al. 2005, ApJ, 625, 167
- Sonnentrucker et al. (2003) Sonnentrucker, P., Friedman, S. D., Welty, D. E., York, D. G., & Snow, T. P. 2003, ApJ, 596, 350
- Stecher (1965) Stecher, T. P. 1965, ApJ, 142, 1683
- Steel & Duley (1987) Steel, T. M., & Duley, W. W. 1987, ApJ, 315, 337
- Valencic et al. (2003) Valencic, L. A., Clayton, G. C., Gordon, K. D., & Smith, T. L. 2003, ApJ, 598, 369
- Vreeswijk et al. (2007) Vreeswijk, P. M., et al. 2007, A&A, 468, 83
- Wang et al. (2004) Wang, J., Hall, P. B., Ge, J., Li, A., & Schneider, D. P. 2004, ApJ, 609, 589
- Watson et al. (2007) Watson, D., Hjorth, J., Fynbo, J. P. U., Jakobsson, P., Foley, S., Sollerman, J., & Wijers, R. A. M. J. 2007, ApJ, 660, L101
- Weingartner & Draine (2001) Weingartner, J. C., & Draine, B. T. 2001, ApJ, 548, 296
- Welty et al. (1997) Welty, D. E., Lauroesch, J. T., Blades, J. C., Hobbs, L. M., & York, D. G. 1997, ApJ, 489, 672
- Whittet et al. (2004) Whittet, D. C. B., Shenoy, S. S., Clayton, G. C., & Gordon, K. D. 2004, ApJ, 602, 291
- Zafar et al. (2011) Zafar, T., Watson, D., Fynbo, J. P. U., Malesani, D., Jakobsson, P., & de Ugarte Postigo, A. 2011, A&A, 532, A143
- Zhou et al. (2010) Zhou, H., Ge, J., Lu, H., Wang, T., Yuan, W., Jiang, P., & Shan, H. 2010, ApJ, 708, 742