SN 2009kn - the twin of the Type IIn supernova 1994W
Abstract
We present an optical and near-infrared photometric and spectroscopic study of supernova (SN) 2009kn spanning 1.5 yr from the discovery. The optical spectra are dominated by the narrow (full width at half-maximum km s-1) Balmer lines distinctive of a Type IIn SN with P Cygni profiles. Contrarily, the photometric evolution resembles more that of a Type IIP SN with a large drop in luminosity at the end of the plateau phase. These characteristics are similar to those of SN 1994W, whose nature has been explained with two different models with different approaches. The well-sampled data set on SN 2009kn offers the possibility to test these models, in the case of both SN 2009kn and SN 1994W. We associate the narrow P Cygni lines with a swept-up shell composed of circumstellar matter and SN ejecta. The broad emission line wings, seen during the plateau phase, arise from internal electron scattering in this shell. The slope of the light curve after the post-plateau drop is fairly consistent with that expected from the radioactive decay of 56Co, suggesting an SN origin for SN 2009kn. Assuming radioactivity to be the main source powering the light curve of SN 2009kn in the tail phase, we infer an upper limit for 56Ni mass of 0.023 M⊙. This is significantly higher than that estimated for SN 1994W, which also showed a much steeper decline of the light curve after the post-plateau drop. We also observe late-time near-infrared emission which most likely arises from newly formed dust produced by SN 2009kn. As with SN 1994W, no broad lines are observed in the spectra of SN 2009kn, not even in the late-time tail phase.
keywords:
supernovae: general supernovae: individual: SN 2009kn , supernovae: individual: SN 1994W.1 Introduction
It is widely accepted that stars more massive than M⊙ end their life cycles as core-collapse supernovae (CCSNe). To date, the more common CCSN Types Ib/c and plateau Type II (IIP) SNe have been studied extensively, but the narrow-line Type II (IIn) SNe remain less well studied. Such SNe are identified from strong and narrow hydrogen emission lines in the spectrum, especially the prominent H line. For a review of SN classification, see Filippenko (1997). The narrow-line features of Type IIn SN spectra are thought to arise from the SN ejecta interacting with an H-rich circumstellar medium (CSM). Recently, Li et al. (2011) derived new relative rates for different SN subtypes, concluding that Type IIn SNe make up 5 per cent of all SNe in their volume-limited sample.
Type IIn SNe exhibit the most heterogeneous properties among the different CCSN subtypes. However, Kiewe et al. (2012) proposed separating a subcategory of Type IIn SNe based on their slowly evolving narrow P Cygni lines [full width at half-maximum (FWHM) km s-1], exhibited especially by the H line. Chugai et al. (2004) associated these events with SNe interacting with a massive CSM envelope ejected in an outburst rather than in a superwind. Following these authors, we identify a subclass of Type IIn SNe consisting of events similar to SN 1994W. Such objects include SN 1994ak (Filippenko, 1997), SN 1994W (Sollerman, Cumming & Lundqvist, 1998; Chugai et al., 2004; Dessart et al., 2009, hereafter SCL98, CBC04, and DHG09, respectively), SNe 1995G and 1999eb (Pastorello et al., 2002), SN 1999el (Di Carlo et al., 2002), SN 2005cl (Kiewe et al., 2012), SN 2011A (Pignata et al., 2011) and SN 2011ht (Roming et al., 2012). In this work, we show that SN 2009kn also belongs to this subclass. The variety of other Type IIn SNe, such as SN 1988Z (Stathakis & Sadler, 1991; Turatto et al., 1993), SN 1998S (Fassia et al., 2001) and the ultraluminous SN 2006gy (e.g. Smith et al., 2010a), makes them less easy to group into subclasses.
We present data on SN 2009kn obtained by a wide European SN collaboration111This is paper is based on European Southern Observatory (ESO) NTT long-term programme, in the framework of a large international collaboration for SN research. For the composition of the Collaboration and its scientific goals, we refer the reader to our web pages (http://graspa.oapd.inaf.it/). comprising one of the most comprehensive data sets yet collected for this subclass of Type IIn SNe. In Section 2, we give the basic parameters of SN 2009kn. In Sections 3 and 4, the photometric and spectroscopic data are described. In Section 5, we discuss the intrinsic nature of SN 2009kn and compare it to SN 1994W. A summary is given in Section 6.
2 SN 2009kn
Gagliano et al. (2009) discovered SN 2009kn on 2009 October 26.46 ut (JD ) in the Sb-type spiral galaxy MCG03-21-006 (also known as ESO 561-G020) by comparison to their reference images obtained in 2005. Spectroscopic observations by Steele, Cobb & Filippenko (2009) on November 9 revealed it to be a Type IIn SN based on the detection of narrow spectral Balmer lines. A radio non-detection on November 27.43 ut was reported by Chandra & Soderberg (2009).
The recession velocity of 4931 km s-1 of MCG03-21-006 (Chamaraux et al., 1999), corrected for Virgo and Great Attractor peculiar motion (Mould et al., 2000), gives a heliocentric redshift . The corresponding luminosity distance is 70.3 Mpc (H km s-1Mpc-1, and ) and the distance modulus mag.
The lack of pre-discovery imaging of the field of SN 2009kn close in time to the SN discovery prevents us from establishing an accurate date of explosion. However, by cross-correlating the spectra of SN 2009kn to the spectral sequence of SN 1994W, we obtain an estimate of the explosion date of JD (October 11). We adopt this as the explosion date in the remainder of the paper. See Section 4.2 for details and caveats on the method.
The spectra of SN 2009kn show no Na i absorption at the host galaxy redshift. We therefore assume that the host galaxy extinction is negligible compared to the Galactic component. We adopt the Galactic extinction of mag as the extinction towards SN 2009kn (see Section 4.2 for details).
3 Photometry
Photometric observations of SN 2009kn were obtained with the 2.56-m Nordic Optical Telescope (NOT; Djupvik & Andersen, 2010) with the Andalucia Faint Object Spectrograph and Camera (ALFOSC222The data presented here were obtained in part with ALFOSC, which is provided by the Instituto de Astrofisica de Andalucia (IAA) under a joint agreement with the University of Copenhagen and NOTSA.) and the Nordic Optical Telescope near-infrared Camera and spectrograph (NOTCam), the 3.56-m New Technology Telescope (NTT) with the ESO Faint Object Spectrograph and Camera v.2 (EFOSC2; Buzzoni et al., 1984) and the Son of ISAAC (SofI; Moorwood, Cuby & Lidman, 1998), the 2.2-m Calar Alto (CA) telescope with the Calar Alto Faint Object Spectrograph (CAFOS; Meisenheimer, 1998), the 2.0 meter Liverpool Telescope (LT; Steele et al., 2004) with the RATCam and the SupIRCam, and the 2 8.4 m Large Binocular Telescope (LBT) with the LBT Near Infrared Spectroscopic Utility with Camera and Integral Field Unit for Extragalactic Research (LUCIFER; Mandel et al., 2000). We report on 22 epochs of optical imaging from day 15 to day 446 post-explosion and 12 epochs of NIR imaging from day 76 to day 531.
3.1 Data reduction
The basic data reduction, i.e. bias subtraction, flat-fielding, alignment and co-addition of the exposures, were carried out using standard Image Reduction and Analysis Facility (iraf)333iraf is distributed by the National Optical Astronomy Observatories, which are operated by the Association of Universities for Research in Astronomy, Inc., under cooperative agreement with the National Science Foundation. tasks. The sky subtraction for the near-infrared (NIR) data was done using the xdimsum444Experimental Deep Infrared Mosaicing Software package developed for iraf.
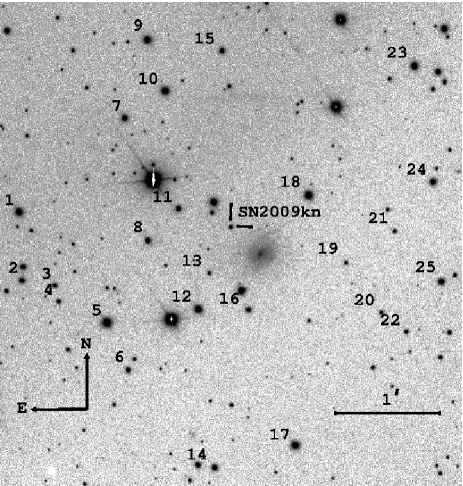
Instrument-specific optical colour terms were derived using several epochs of standard field observations. The calibration of the optical photometry was done relative to a sequence of up to 25 local stars, in turn calibrated using the photometric standard star field RU 152 (Landolt, 1992) observed on JD with the NOT. The night was later determined as photometric based on the comparison of the derived UBVRI zero-points to the instrumental zero-points reported555http://www.not.iac.es/instruments/alfosc/zpmon/ for NOT/ALFOSC and the atmospheric extinction monitoring measurements at the Carlsberg Meridian Telescope.666http://www.ast.cam.ac.uk/dwe/SRF/camc_extinction.html SN 2009kn and its comparison stars are shown in Fig. 1. The calibration of the NIR photometry used up to 20 field stars from the Two Micron All Sky Survey (2MASS)777http://www.ipac.caltech.edu/2mass/index.html (Skrutskie et al., 2006). The optical magnitudes for the field stars are reported in Table 1, and for completeness the 2MASS magnitudes are included. We carried out photometry of SN 2009kn using a point spread function (PSF) procedure based on the daophot package in iraf. A polynomial surface fit to the square background region surrounding the object position was derived and subtracted. The local stars used for photometric calibration were used to derive a PSF for each image which was then fitted to the SN. Measurement errors were estimated by simulating and fitting nine artificial PSF sources around the SN-subtracted residual image. This error usually dominated over the statistical uncertainty of the PSF fitting. The total error we report is the quadratic sum of the aforementioned measurement error and the standard error of mean of the zero-point values derived from individual local stars used for the calibration. Most of the iraf tasks were run under the quba pipeline.888Python package specifically designed by SV for SN imaging and spectra reduction. For more details on the pipeline, see Valenti et al. (2011). The optical photometry of SN 2009kn is reported in Table 2, and the NIR photometry in Table 3.
| Star | ||||||||
|---|---|---|---|---|---|---|---|---|
| # | (mag) | (mag) | (mag) | (mag) | (mag) | (mag) | (mag) | (mag) |
| 1 | 14.722(0.005) | 14.852(0.011) | 14.313(0.026) | 13.958(0.025) | 13.717(0.049) | 13.143(0.026) | 12.920(0.031) | 12.885(0.036) |
| 2 | 16.063(0.012) | 16.213(0.014) | 15.652(0.027) | 15.186(0.026) | 14.919(0.044) | 14.491(0.034) | 14.243(0.047) | 14.156(0.082) |
| 3 | 17.224(0.021) | 17.198(0.016) | 16.510(0.022) | 16.015(0.024) | 15.694(0.040) | 15.249(0.057) | 14.958(0.083) | 14.747(0.129) |
| 4 | 17.388(0.024) | 17.196(0.015) | 16.455(0.023) | 15.899(0.026) | 15.562(0.041) | 15.015(0.044) | 14.525(0.056) | 14.530(0.096) |
| 5 | 14.388(0.006) | 14.225(0.007) | 13.546(0.045) | 13.318(0.058) | 12.977(0.196) | 12.321(0.023) | 12.033(0.026) | 12.004(0.023) |
| 6 | 16.615(0.016) | 16.655(0.012) | 15.960(0.017) | 15.492(0.026) | 15.131(0.042) | 14.664(0.037) | 14.369(0.049) | 14.324(0.072) |
| 7 | 15.489(0.008) | 15.525(0.006) | 14.867(0.008) | 14.544(0.012) | 14.256(0.027) | 13.735(0.028) | 13.514(0.030) | 13.516(0.043) |
| 8 | 16.586(0.014) | 16.168(0.008) | 15.380(0.013) | 14.947(0.008) | 14.592(0.026) | 14.077(0.028) | 13.782(0.033) | 13.767(0.057) |
| 9 | 15.010(0.007) | 14.876(0.011) | 14.185(0.011) | 13.742(0.036) | 13.433(0.050) | 12.943(0.023) | 12.654(0.025) | 12.566(0.033) |
| 10 | 14.669(0.006) | 14.762(0.008) | 14.223(0.010) | 13.888(0.023) | 13.647(0.048) | 13.177(0.025) | 12.938(0.026) | 12.907(0.030) |
| 11 | 16.181(0.012) | 16.136(0.007) | 15.525(0.009) | 15.204(0.007) | 14.926(0.022) | 14.460(0.028) | 14.220(0.039) | 14.007(0.060) |
| 12 | 15.107(0.006) | 15.046(0.005) | 14.345(0.018) | 13.970(0.013) | 13.644(0.050) | 13.053(0.023) | 12.668(0.027) | 12.660(0.030) |
| 13 | 17.828(0.038) | 17.981(0.020) | 17.442(0.017) | 17.110(0.012) | 16.744(0.030) | - | - | - |
| 14 | 15.806(0.012) | 15.959(0.015) | 15.506(0.009) | 15.188(0.035) | 14.848(0.051) | 14.631(0.035) | 14.387(0.045) | 14.279(0.075) |
| 15 | 16.208(0.013) | 16.237(0.011) | 15.685(0.010) | 15.385(0.025) | 15.110(0.042) | 14.574(0.037) | 14.273(0.043) | 14.419(0.103) |
| 16 | 16.554(0.016) | 16.522(0.008) | 15.891(0.015) | 15.533(0.009) | 15.125(0.030) | 14.711(0.038) | 14.373(0.054) | 14.166(0.075) |
| 17 | 14.933(0.009) | 14.866(0.012) | 14.175(0.010) | 13.832(0.052) | 13.525(0.069) | 13.019(0.025) | 12.704(0.026) | 12.594(0.032) |
| 18 | 14.814(0.007) | 14.683(0.006) | 14.080(0.008) | 13.701(0.029) | 13.385(0.036) | 12.905(0.026) | 12.643(0.025) | 12.541(0.032) |
| 19 | 18.566(0.069) | 18.046(0.021) | 17.196(0.013) | 16.756(0.018) | 16.286(0.016) | - | - | - |
| 20 | 17.727(0.037) | 17.625(0.015) | 16.891(0.012) | 16.539(0.014) | 16.050(0.019) | - | - | - |
| 21 | 17.487(0.028) | 17.463(0.015) | 16.850(0.014) | 16.534(0.020) | 16.155(0.024) | - | - | - |
| 22 | 17.822(0.037) | 17.628(0.016) | 16.898(0.011) | 16.584(0.017) | 16.104(0.018) | - | - | - |
| 23 | 16.545(0.018) | 15.644(0.010) | 14.660(0.026) | 14.070(0.056) | 13.442(0.086) | 12.685(0.023) | 12.157(0.027) | 12.078(0.028) |
| 24 | 16.149(0.015) | 15.747(0.006) | 15.013(0.012) | 14.593(0.030) | 14.202(0.044) | 13.477(0.025) | 13.029(0.029) | 12.977(0.032) |
| 25 | 16.069(0.015) | 15.739(0.007) | 15.024(0.007) | 14.702(0.023) | 14.294(0.035) | 13.727(0.026) | 13.374(0.033) | 13.298(0.041) |
| JD | Epoch | Telescope | |||||
|---|---|---|---|---|---|---|---|
| (2400000+) | (d) | (mag) | (mag) | (mag) | (mag) | (mag) | |
| 55131.0 | 15 | - | - | - | 16.623(0.164) | - | Pucketta |
| 55140.0 | 24 | - | - | - | 16.407(0.533) | - | Puckett |
| 55153.0 | 37 | - | - | - | 16.806(0.491) | - | Puckett |
| 55161.7 | 46 | 16.612(0.018) | 17.281(0.027) | 16.995(0.009) | 16.705(0.014) | 16.494(0.015) | NOT |
| 55171.6 | 56 | 17.021(0.020) | 17.515(0.009) | 17.139(0.011) | 16.843(0.014) | 16.633(0.015) | NOT |
| 55176.6 | 61 | 17.255(0.026) | 17.616(0.013) | 17.211(0.013) | 16.911(0.015) | 16.666(0.017) | NOT |
| 55189.8 | 74 | 18.028(0.024) | 18.061(0.022) | 17.526(0.025) | 17.168(0.031) | 16.882(0.024) | NTT |
| 55193.6 | 78 | - | 18.159(0.071) | 17.566(0.053) | 17.177(0.062) | 17.004(0.077) | CA |
| 55204.6 | 89 | 18.906(0.069) | 18.551(0.059) | 17.935(0.019) | 17.550(0.022) | 17.220(0.019) | NOT |
| 55209.6 | 94 | - | 18.882(0.016) | 18.052(0.017) | 17.646(0.013) | 17.326(0.013) | LT |
| 55215.5 | 100 | 20.350(0.483) | 19.186(0.129) | 18.435(0.254) | 17.679(0.172) | 17.495(0.031) | NOT |
| 55216.6 | 101 | - | 19.314(0.055) | 18.361(0.014) | 17.882(0.015) | 17.531(0.013) | LT |
| 55219.7 | 104 | 20.860(0.100) | 19.632(0.025) | 18.549(0.022) | 18.044(0.043) | 17.671(0.045) | NTT |
| 55224.5 | 109 | - | 20.384(0.182) | 19.335(0.143) | 18.989(0.055) | 18.620(0.046) | LT |
| 55231.5 | 116 | - | 21.996(0.099) | 20.791(0.135) | 20.083(0.063) | 19.814(0.042) | NOT |
| 55237.5 | 122 | - | 21.981(0.043) | 20.940(0.033) | 20.208(0.042) | 19.895(0.029) | LT |
| 55245.7 | 130 | - | 22.135(0.081) | 21.009(0.036) | 20.307(0.036) | 19.887(0.028) | NTT |
| 55260.7 | 145 | - | 22.212(0.062) | 21.139(0.038) | 20.445(0.056) | 19.928(0.064) | NTT |
| 55273.4 | 157 | - | 22.483(0.040) | 21.244(0.040) | 20.686(0.030) | 20.153(0.027) | NOT |
| 55296.4 | 180 | - | 22.739(0.085) | 21.541(0.096) | 20.904(0.069) | 20.200(0.140) | NOT |
| 55475.9 | 360 | - | - | - | 21.974(0.102) | 21.576(0.183) | NTT |
| 55561.6 | 446 | - | - | 22.675 | 21.918 | 21.968(0.491) | NTT |
a We calibrated the Puckett Observatory unfiltered data in a similar way to the R-band photometry of SN 2009kn.
| JD | Epoch | Telescope | |||
|---|---|---|---|---|---|
| (2400000+) | (d) | (mag) | (mag) | (mag) | |
| 55191.7 | 76 | 16.425(0.026) | 16.172(0.037) | 15.961(0.049) | NTT |
| 55209.6 | 94 | 16.883(0.041) | 16.661(0.041) | - | LT |
| 55212.8 | 97 | - | - | 16.417(0.047) | LBT |
| 55219.5 | 104 | 17.107(0.039) | 16.984(0.044) | 16.481(0.049) | NOT |
| 55244.8 | 129 | - | 18.842(0.032) | 18.470(0.034) | LBT |
| 55246.7 | 131 | 19.208(0.061) | 18.871(0.131) | 18.390(0.150) | NTT |
| 55261.7 | 146 | 19.430(0.072) | 19.095(0.114) | 18.660(0.139) | NTT |
| 55305.6 | 190 | 19.665(0.202) | 19.248(0.129) | - | NTT |
| 55315.4 | 199 | 19.838(0.159) | - | - | NOT |
| 55532.9 | 417 | 21.162(0.121) | 19.633(0.102) | 18.414(0.046) | LBT |
| 55605.6 | 490 | - | 19.987(0.165) | 18.668(0.109) | NTT |
| 55646.6 | 531 | - | 20.055(0.141) | 18.904(0.120) | NTT |
The local stars were also used to derive the World Coordinate System (WCS) solution for the field. This yielded RA and Dec (J2000.0) for SN 2009kn, arcsec east and arcsec north of the R-band nucleus of the host galaxy MCG03-21-006, corresponding to a projected distance of 8 kpc. Our coordinates differ slightly from those measured by Gagliano et al. (2009). We believe that the larger discrepancy in RA is due to a typo or an error in converting angles to seconds of RA. The host galaxy has an inclination of according to HyperLeda (Paturel et al., 2003).
From the late epochs of our photometry, it is evident that the SN is projected close to a point-like source, most likely an H ii region in the host galaxy. For the photometry of these epochs, the PSF was fitted both to the SN and to the nearby source to prevent it from affecting the PSF fitting. We obtain similar magnitudes of this nearby source at different epochs: mag, mag, mag, and mag. This suggests that the source does not strongly contaminate our late time photometry. During the early plateau phase, the SN is much brighter than this source, which therefore can be ignored.
3.2 Light curves
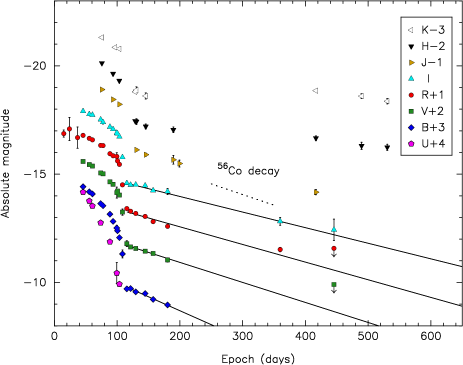
All our multiband photometric follow-up observations have been conducted after maximum light, starting from 46 d after our adopted explosion date JD . The absolute UBVRIJHK light curves are shown in Fig. 2. The light curves show a declining plateau phase extending 100 d from the explosion date. The plateau resembles those shown by Type IIP SNe, which exhibit a distinctive hydrogen recombination phase in their light curves. Assuming a continuous plateau before the day 46 multiband observations, we estimate that the SN absolute peak magnitude was roughly mag. Compared to the average peak magnitudes of Type II SNe (Richardson et al., 2002), SN 2009kn is 1 mag brighter than the Type IIP SNe and 1 mag fainter than the Type IIn SNe in their sample. Nevertheless, both Type IIP and Type IIn peak magnitude distributions show a wide spread and SN 2009kn cannot be excluded from either of the two classes based on the early photometry. SN 2009kn’s plateau was followed by a rapid drop of 2.4 mag in B and 2.0 mag in V, R, and I in just 12 d, similar to SN 1994W which faded by 3.5 mag in V in 12 d (SCL98). From day 116 onwards the decline rates, measured using least-squares fitting, were mag (100 d)-1, mag (100 d)-1, mag (100 d)-1, and mag (100 d)-1. Here we have included the measured magnitudes in R and I on day 360 and 446 in the fit, but not the upper limits in V and R. The slope in V is comparable to the slope of 0.98 mag (100 d)-1 expected from the radioactive decay of 56Co to 56Fe, assuming complete -ray and e+ trapping. The slopes in R and I, however, are not as steep. This could indicate ongoing CSM interaction which enhances the flux in the H and Ca ii triplet lines in R and I bands, respectively. For more details, see Sections 4 and 5. See Section 3.3 for an analysis of the decline of the bolometric light curve. The gradual slope after the fast drop in the light curve is one of the main differences between SN 2009kn and SN 1994W, the latter exhibiting a much steeper decline rate.
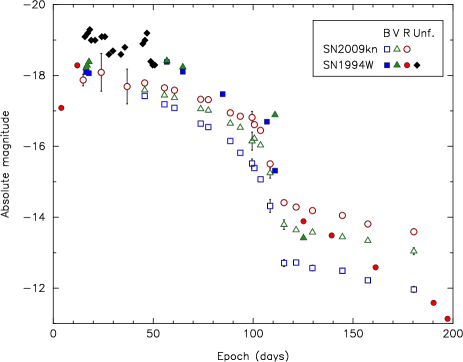
In Fig. 3, the absolute VRI light curves of SN 2009kn and SN 1994W are compared. The available photometry of SN 1994W between days 20 and 50 consists only of amateur photometry, which were converted to V-band magnitudes by SCL98. SN 1994W exhibited a peak in the light curve at around 2030 d from the date of explosion, after which the light curve remained on a plateau-like shape. For SN 2009kn, we are similarly missing early epoch photometry. We have derived R-band magnitudes from the available unfiltered amateur images of SN 2009kn, shown in Fig. 2, but no clear light-curve peak is seen.
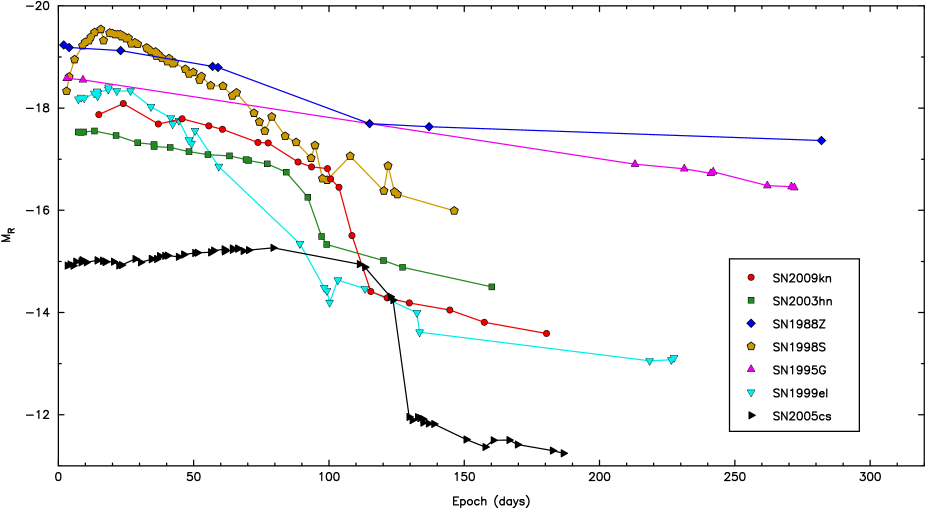
In Fig. 4, we compare the absolute R-band light curve of SN 2009kn with the light curves of a number of other SNe. The plateau-like decline, the drop at epoch 100120 d and the radioactive 56Co tail observed for SN 2009kn are very similar to those of a Type IIP SN, e.g. SN 2003hn, although other evidence points to a different powering mechanism. Compared to other spectroscopically classified Type IIn SNe (e.g. the well-followed SN 1998S), SN 2009kn is very different. It shows no sign of the fast decline at early times shown by SNe 1998S and 1999el, whose light curves more closely resemble Type IIL SNe than a Type IIP. The photometric evolution of SN 2009kn is also very much unlike some spectroscopically similar Type IIn events, e.g. SN 1995G.
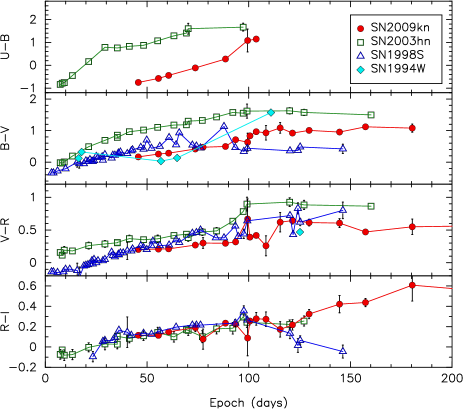
The colour curves of SN 2009kn are shown in Fig. 5, together with the colour evolution of some other SNe. The colour evolution of SN 2009kn is fairly similar to that of SN 1998S, whereas SN 2009kn is much bluer than the Type IIP SN 2003hn in all the optical colours. This is particularly apparent in UB at the early epochs. However, the UB colour of SN 2009kn shows a significant evolution and increases from 0.8 mag to 1.1 mag from 46 to 104 d. On day 46, the BV, VR, and RI colours are all 0.2 mag and increase to 1.0, 0.4, and 0.3 mag, respectively, by day 100 when the plateau phase ends. During the tail phase, the BV and VR colours do not change, while RI increases to 0.6 mag by day 180.
Taking into account the overall behaviour of the light curves, SN 2009kn bears a closer resemblance to a Type IIP SN than to SN 1998S. However, the colour curves are bluer than for a Type IIP and similar to those of SN 1998S. The drop after the plateau phase for SN 2009kn (and SN 1994W) is not particularly large compared to Type IIP SNe. Elmhamdi, Chugai & Danziger (2003) presented a sample of Type IIP SNe that showed a drop in brightness in the range of 1.53 mag. Even larger drops have been observed for subluminous Type IIP SNe. SN 2005cs dropped by 3.8 mag in V during a period of three weeks after the plateau phase (Pastorello et al., 2009). We also note that a fairly luminous Type IIP SN 2007od dropped 6 mag from the plateau to the first observed tail phase slope in roughly 200 d (Inserra et al., 2011).
3.3 Bolometric light curves
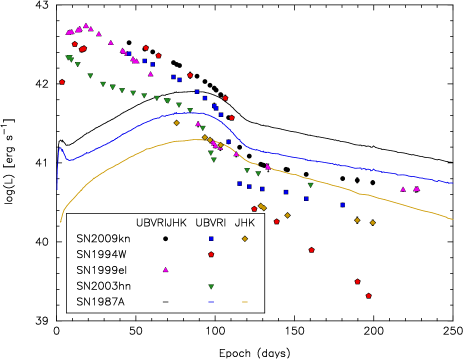
Pseudo-bolometric UBVRI, JHK and interpolated UBVRIJHK light curves were created from available photometry of the SNe included in the comparison. The extinction-corrected magnitudes were converted into fluxes and integrated over the filter range using Simpson’s rule and the integrated fluxes were converted to luminosities taking into account the distance moduli.
Both the well-sampled optical data of SN 2009kn and the less comprehensive NIR data can be extrapolated and interpolated to all the epochs of observations to derive a UBVRIJHK pseudo-bolometric light curve. This is compared to those of several other SNe in Fig. 6. When comparing with SN 1987A, we note that in the early tail phase the pseudo-bolometric light curve follows the radioactive decay fairly closely. Using least-squares fitting between days 129 and 199, the best fit for the light-curve slope is mag (100 d)-1. This is slightly slower than the pure radioactive value, and could be explained by ongoing CSM interaction in the tail phase. Epochs beyond day 199 were excluded from the tail phase fit because of limited photometric coverage. Since spectral observations seem to indicate that there is still CSM interaction ongoing in the early tail phase, the 56Ni mass we can derive from the light curve slope should be considered as an upper limit. Assuming complete -ray trapping in the tail phase, the luminosity and 56Ni mass ratio of SN 2009kn can be derived by comparison with SN 1987A. Comparing the pseudo-bolometric UBVRIJHK luminosities of SNe 2009kn and 1987A at day 146 and taking a 56Ni mass of 0.069 M⊙ for SN 1987A (Bouchet et al., 1991), we estimate a 56Ni mass 0.023 M⊙ for SN 2009kn. As a comparison, SCL98 derived a 56Ni mass 0.015 M⊙ for SN 1994W. No sign of a NIR excess is seen in the JHK pseudo-bolometric light curve of SN 2009kn during the first 200 d.
3.4 NIR evolution
Up to day 200, the NIR evolution of SN 2009kn broadly follows that of the other optical bands (see Fig. 2). Between days 200 and 400, there is no NIR coverage; nevertheless, beyond day 400, the light curves in and are relatively flat, while the optical emission continues to drop steeply. This behaviour is suggestive of dust condensation.
To examine this possibility, we first fitted a single blackbody to the NIR spectral energy distribution (SED) at day 417 for which date photometry in J, H and K bands was available. To avoid the effects of possible contamination from line emission in the J band, we also carried out the fit using only the H- and K-band points. These fits all yielded similar blackbody temperatures of 14001500 K and radii of 2.63.0 cm. The blackbody temperature is consistent with thermal emission from dust. The blackbody radius is consistent with an expansion velocity of 800 km s-1 (according to the P Cygni minima velocity during the plateau phase; see Section 4.5) assuming a small initial radius. Thus, the IR emission could be seen to originate within the same dense shell that gave rise to the optical emission from the SN. This behaviour is in line with other type IIn SNe. For SN 1998S, a strong late-time NIR excess was also observed and was at least partly attributed to newly formed dust in a cool dense shell (CDS) formed behind the reverse shock (Pozzo et al., 2004). The colour of at day 417 is comparable to that of SN 1998S ( at day 333). Meikle et al. (2006) derived a dust evaporation radius of 3 cm for the type IIP SN 2002hh, appropriate for graphite grains (for silicate grains this radius would be larger). However, SN 2009kn was 1 mag brighter at early times than SN 2002hh (Pozzo et al., 2006), which implies a larger dust evaporation radius. The dust evaporation radius of SN 2009kn is therefore at least an order of magnitude larger than the derived warm dust blackbody radius of SN 2009kn. This also supports the idea that dust formed between days 200 and 400, since the time-scales are consistent with those observed previously (see e.g. Kotak et al., 2009; Meikle et al., 2011).
Unfortunately, no spectroscopy of SN 2009kn is available beyond day 225 to confirm that new dust indeed formed. We compared the day 120 spectrum with the day 225 spectrum to search for blueshifted lines which would further support our claim. However, we do not detect any noticeable blueshift of the H emission peak; if anything, the line peak shifted slightly to the red. Our last -band spectrum (day 225) does not show a strongly rising continuum, and there is no sign of molecular emission due to CO – a commonly observed precursor to dust formation (e.g. Kotak et al., 2005). Again, this is not inconsistent with the time-scales and evolution described above. SN 1987A showed clear signatures of dust formation only as late as day 600 (Wooden et al., 1993), although it did show molecular emission at earlier epochs.
No NIR data are available for SN 1994W. Assuming that SN 1994W was a genuine SN, then partial trapping of -rays in the tail phase or dust formation already at 100 d could explain its steep -band evolution during the tail phase, leading SCL98 to underestimate the amount of 56Ni that it produced.
4 Spectroscopy
Spectroscopic observations of SN 2009kn were obtained at 13 epochs from day 35 to 225 post-explosion. NOT/ALFOSC, NTT/EFOSC2 and the 8.2-m Very Large Telescope (VLT) with Ultraviolet and Visual Echelle Spectrograph (UVES; Dekker et al., 2000) and the optical/NIR spectrograph X-Shooter (Vernet et al., 2011) were used to obtain optical spectra. The NIR spectroscopy was obtained with X-Shooter [simultaneously with ultraviolet (UV) and optical], NTT/SofI and LBT/LUCIFER.
4.1 Data reduction
The data reduction for the NOT and NTT spectra were done using standard iraf tasks and the quba pipeline. The raw data were bias subtracted and flat-field corrected. Spectroscopic flats were obtained before and after the target exposure with the same pointing as for SN 2009kn as necessary to minimize the possible fringing effects. The spectra were extracted with the iraf task apall, wavelength calibrated using arc lamp exposures and cross-correlated with the sky lines. The second-order contamination for grism #4 at the NOT (20 per cent of the U-band flux and 5 per cent of the B-band flux visible beyond 5900 Å) was corrected using the method presented by Stanishev (2007). The LBT spectrum was extracted, reduced and calibrated using the LUCIFER pipeline. The relative flux calibration of the optical spectra was done by deriving the sensitivity curve for the instrument set-up from spectroscopic standard star observations. The NIR spectra were calibrated by dividing the extracted spectrum with a spectrum of a telluric standard star observed at a similar airmass and close in time as the SN and multiplied with the same spectral type stellar library spectrum (Pickles, 1998).
UVES spectrum was pipeline reduced using the Reflex-based workflow provided by ESO. X-Shooter spectra were pre-reduced using version 1.1.0 of the dedicated ESO pipeline (Goldoni et al., 2006), with calibration frames (biases, darks, arc lamps and flatfields) taken during daytime. The 1D spectrum extractions were done using apall in a similar way to the low-resolution spectra. Relative flux calibrations were performed through spectrophotometric standards taken from the ESO list,999http://www.eso.org/sci/facilities/paranal/instruments/ xshooter/tools/specphot_list.html which includes stars with well-known emission fluxes from UV to NIR. We removed the telluric bands using telluric standards taken soon after each scientific exposures and at the same airmass as the SN.
All the spectra were absolute flux calibrated with BVRIJHK broadband photometry interpolated/extrapolated to the observation epoch. An average scaling factor was derived for each epoch and multiplied to the spectrum over the whole wavelength range. Finally, all the spectra were corrected to the heliocentric reference frame. For a complete log of spectroscopic observations, see Table 4.
| JD | Epoch | Grism | Range | Resolution | PAa | Exp. time | Telescope/instrument |
|---|---|---|---|---|---|---|---|
| (2400000+) | (d) | (Å) | (R) | (∘) | (s) | ||
| 55150.7 | 35 | Blue,red | 3300-6800 | 40000 | 0 | 2300 | VLT/UVES |
| 55161.7 | 46 | gm#4 | 3200-9100 | 270 | 12 | 900 | NOT/ALFOSC |
| 55171.6 | 56 | gm#7 | 3850-6850 | 650 | 157 | 900 | NOT/ALFOSC |
| 55177.8 | 62 | UVB,VIS,NIR | 3000-24800 | 5100,8800,5100 | 47 | 4x150,4x150,4x3x50 | VLT/X-Shooter |
| 55189.7 | 74 | gm#11,gm#16 | 3380-10320 | 340,510 | 60 | 1800,1800 | NTT/EFOSC2 |
| 55191.8 | 76 | BG,RG | 9500-25200 | 600,600 | 0 | 6x3x180,6x3x180 | NTT/SofI |
| 55212.7 | 97 | UVB,VIS,NIR | 3000-24800 | 5100,8800,5100 | 70 | 4x150,4x150,4x3x50 | VLT/X-Shooter |
| 55212.9 | 97 | 200H+K | 15000-25000 | 1900,2600 | 51 | 24x300 | LBT/LUCIFER |
| 55215.5 | 100 | gm#4 | 3200-9100 | 270 | 148 | 3x1000 | NOT/ALFOSC |
| 55231.6 | 116 | gm#4 | 3200-9100 | 270 | 27 | 3x1000 | NOT/ALFOSC |
| 55235.6 | 120 | UVB,VIS,NIR | 3000-24800 | 5100,8800,5100 | 71 | 4x650,4x650,4x3x270 | VLT/X-Shooter |
| 55245.7 | 130 | gm#16 | 6015-10320 | 510 | 80 | 2x3600 | NTT/EFOSC2 |
| 55340.5 | 225 | UVB,VIS,NIR | 3000-24800 | 5100,8800,5100 | 107 | 4x650,4x650,4x3x270 | VLT/X-Shooter |
a The position angle (PA) of the slit on the sky is measured from north to east.
4.2 Epoch of explosion and extinction
For the Galactic line-of-sight extinction, we used the value derived by Schlegel, Finkbeiner & Davis (1998) dust maps with a reddening of mag. We conclude from the early epoch spectra that the host galaxy extinction is negligible compared to the Galaxy due to the absence of redshifted Na i D 5889.95, 5895.92 lines in our data, whilst the rest wavelength Galactic lines are clearly identified [see Turatto, Benetti & Cappellaro (2003) for details but also Poznanski et al. (2011) for a caveat on the use of Na i as a reddening indicator]. Thus, using the Cardelli, Clayton & Mathis (1989) reddening law with , we adopt a total line-of-sight extinction of mag (i.e. only the Galactic reddening).
Due to the lack of observations of the SN field close in time before the discovery, we have no independent estimate of the explosion date beyond the discovery data. We take instead the simple approach of comparing SN 2009kn with SN 1994W, which has a well-defined explosion date of JD (SCL98). We used the SuperNova IDentification (snid) code (Blondin & Tonry, 2007) to cross-correlate first five optical spectra of SN 2009kn (see Table 4) against the spectra of SN 1994W presented by CBC04, along with the library of spectra included in snid (version 5.0 with template set 2.0). For the spectra included in the analysis, snid always returned spectra of SN 1994W as the best two matches. Other suggestions were mainly luminous blue variables (LBVs), active galactic nuclei, and other non-SN sources. We used the rlap value output of snid as an estimate of the quality of the best fits and calculated a weighted average for the explosion date of 15 d before the discovery. The standard deviation of the explosion dates obtained using different spectra, summed in quadrature with the error derived for the explosion date of SN 1994W, was adopted as the final error. We thus adopt an explosion date of JD , noting that it gives a very similar light curve drop epoch for SN 2009kn as for SN 1994W. The applied method assumes that the two SNe are absolutely identical. While this may not be the case, comparison with the spectral development of other SNe (see Section 5.2) supports its use for estimating the explosion date.
4.3 Spectral evolution
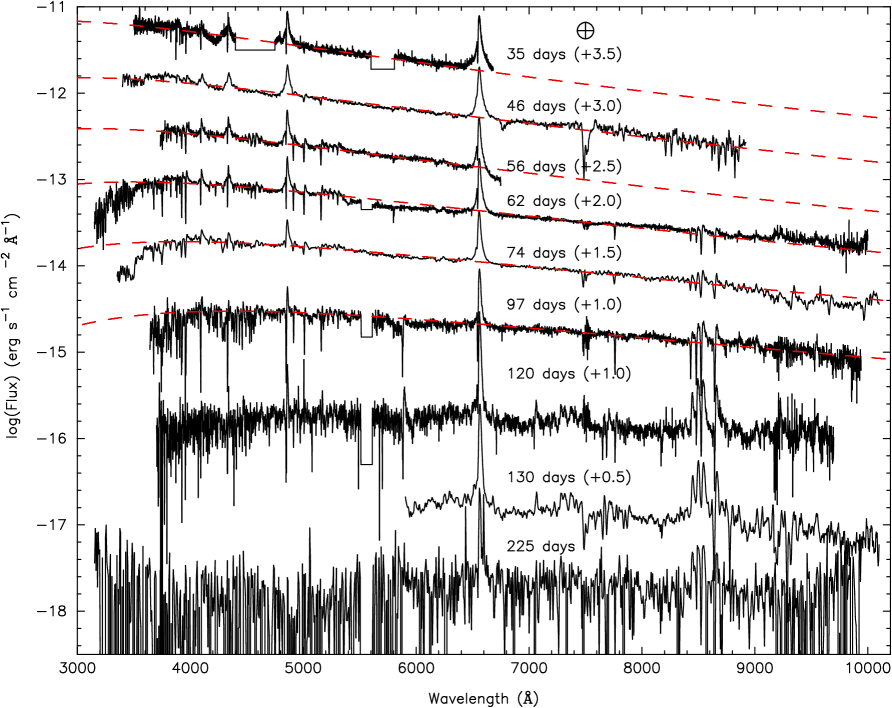
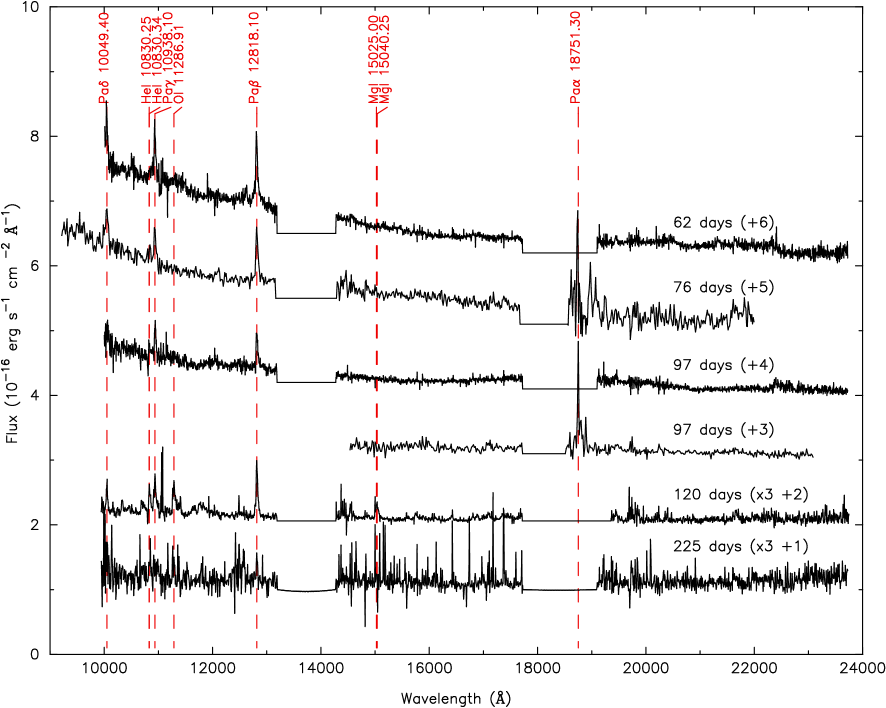
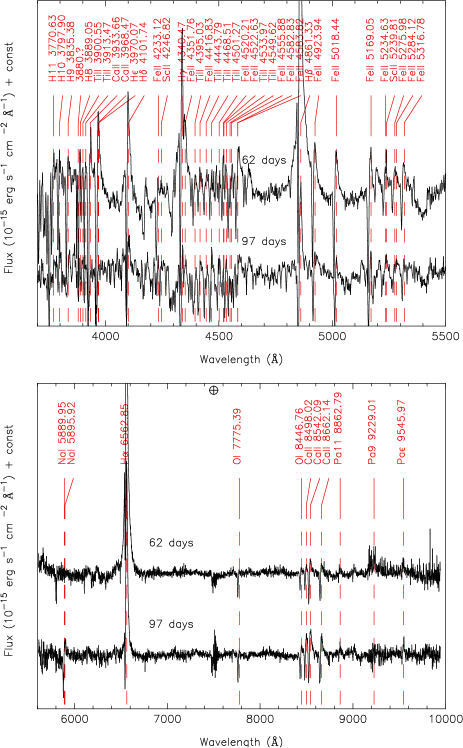
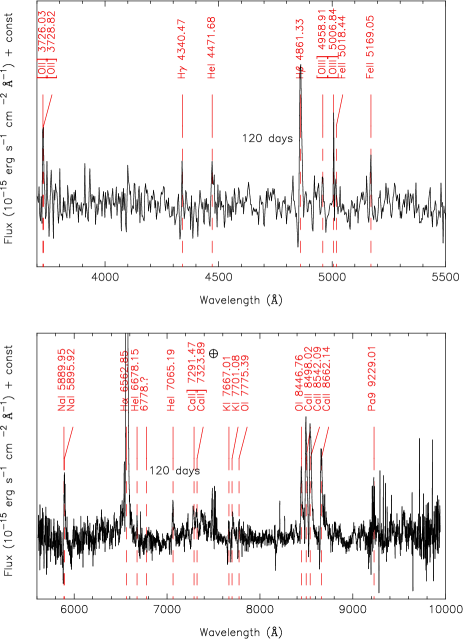
The spectral time series of SN 2009kn in the optical is shown in Fig. 7. The NIR spectral evolution is shown in Fig. 8 with the identified NIR lines overlaid. The day 62 UV-optical spectrum of SN 2009kn has already been presented in a compilation of recent observations of Type IIn SNe with X-Shooter by Pastorello et al. (2011). Following the line identifications carried out for SN 1994W initially by CBC04 and later very comprehensively by DHG09 (see also the supplementary online data in their appendix A), we performed our own line identifications for SN 2009kn to allow more detailed comparison between the two events.
For analytical line identification purposes all the 1D spectra were extracted from the 2D frames using the iraf task apall with optimal extraction enabled, producing a target spectrum and also a weight spectrum describing the pixel-to-pixel noise level. Due to the higher resolution of the X-Shooter spectra, the 2D spectra were binned before the extraction to enable apall to produce a more reliable noise spectrum. We took care that even the narrowest features were not lost in binning the spectra and that different epochs were binned similarly. A continuum level for the 1D spectrum was determined by heavily median smoothing the spectrum with a 100 Å window. Only features that differed by more than three times the wavelength-dependent noise level from the continuum were accepted as real lines, i.e. emission and absorption features with peak detections. Further rejection of features was done by inspecting closely the 2D frames to identify false detections caused by fringing effects, cosmic rays, telluric lines or failed tracing and extraction in the end regions of the spectra with intrinsically low signal-to-noise ratio. For example, no lines were identified in the K-band region of the spectra. In the low resolution spectra, only the lines that were identified also in at least one of the higher resolution X-Shooter spectra were accepted as real. We note that our method is more conservative than the approach used by CBC04. To identify most of the atomic lines, we used the National Institute of Standards and Technology (NIST) Atomic Spectral Database (Ralchenko et al., 2008), the line tables of CBC04 and DHG09, and the Fe ii line tables of Sigut & Pradhan (2003).
To assist in the line identification in the photospheric phase optical spectra, we also used a Monte Carlo atmosphere code similar to that of Mazzali & Lucy (1993) and the atomic line list from Jerkstrand, Fransson & Kozma (2011). The code treats electron and line scattering in the nebular non-local thermodynamic equilibrium approximation given density, abundances, a thermalization radius and the observed luminosity. The temperature at the thermalization radius is iterated to reproduce the observed luminosity. The values for these quantities were taken from DHG09 for the day 79 spectrum of SN 1994W. Except for the hydrogen lines, which are mainly recombination driven, the lines in the day 79 spectrum of SN 1994W are well reproduced by this procedure. Given the strong similarity between SN 1994W and SN 2009kn in the photospheric phase, we assume these identifications to apply to SN 2009kn as well. For complete lists of identified lines, see Tables A1 and A2 in the Appendix A.
In Figs. 9 and 10, the lines identified in the X-Shooter spectra are shown. The medium-resolution spectra from X-Shooter enabled us to fully resolve the narrow absorption components of multiple lines. These spectra show the main spectral evolution points of SN 2009kn in an otherwise only slowly changing time series.
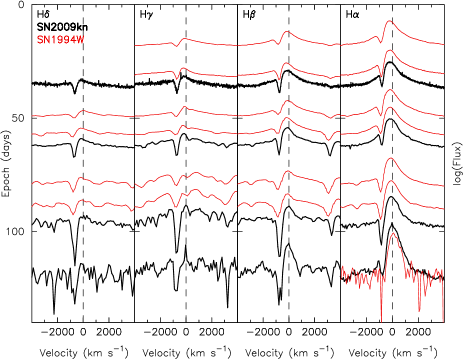
The spectrum of SN 2009kn is dominated by strong Balmer lines, especially in the early epochs, and these lines show similar evolution to that of SN 1994W (for the comparison, see Fig. 11). The slightly less prominent absorption components of SN 1994W compared to SN 2009kn can be explained by the poorer spectral resolution in the SN 1994W data. We also note the similarity in the wavelength evolution of the Balmer line peaks, gradually shifting redwards as a function of time. The flux measurements of the hydrogen lines are reported in Table 5. The H line flux was corrected for blending with Fe ii 4923.94. H is also affected by multiple faint Fe ii lines but these effects were not corrected for. The H flux on day 56 may be affected by poor flux calibration as the line lands in the blue end of the grism. The early reddening-corrected Balmer decrement H:H:H on day 46 is very similar to the reported value of by CBC04 for SN 1994W on days 46 and 56. By day 62, the Balmer decrement of SN 2009kn evolved to H:H:H. During the late plateau phase, H can no longer be measured properly. However, H/H has a value of 2.1 by day 74 and 7 by day 97, similar to SN 1994W with H/H by day 79 and 5.2 by day 89. In the day 120 tail phase spectrum, the ratio has increased to H/H for SN 2009kn. The evolution of the Balmer decrement can be qualitatively understood as a result of transition of the recombination spectrum from a regime of optically thick, almost thermalized Balmer lines towards a regime of optically thick Balmer lines but still far from complete thermalization.
| Epoch (d) | H | H | H | Pa | Pa | Pa |
|---|---|---|---|---|---|---|
| 46 | 66 | 51 | 27 | - | - | - |
| 56 | 45 | 40 | 15 | - | - | - |
| 62 | 45 | 29 | 5.6 | 6.4 | 3.2 | - |
| 74 | 35 | 17 | - | - | - | - |
| 76 | - | - | - | 4.4 | 2.7 | 3.1 |
| 97 | 17 | 2.4 | - | 2.1 | 1.6 | - |
| 120 | 5.3 | 0.32 | - | 1.2 | 0.85 | 0.55 |
In the NIR, the Paschen lines Pa and Pa are the most prominent features. Pa overlaps with the strong telluric band between H and K. Evidence of the line can be seen in the day 76 NTT spectrum and in the day 97 LBT spectrum. The Pa/Pa ratio decreases slowly from 2 at day 62 to both before and after the light curve drop at day 97 and day 120.
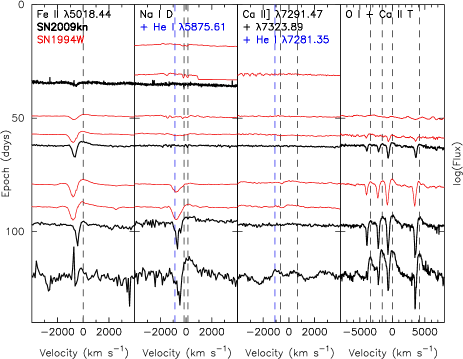
No optical He i lines were detected before the light curve drop, including the broad 5875.61 visible in the early spectra of SN 1994W and SN 2005cl (see CBC04 and Kiewe et al., 2012, respectively). In the tail phase, emission lines with a good match to He i 4471.68, 6678.15, 7065.19 emerge. There is no clear detection of He i at 5875.61. We believe that the strong P Cygni line associated with Na i D is preventing us from properly observing the underlying feature of the He i 5875.61 line. We associate the strong P Cygni line itself with Na i D rather than He i due to its convincing rest wavelength match to Na i D(see Fig. 12). A He i 5875.61 line with flux similar to the identified He i 7065.19 line could be blended with a strong absorption of the Na i D lines in the day 120 spectrum remaining undetected in the observed spectrum. Similarly, the He i 5015.68 line may be blended with Fe ii 5018.44 and the He i 7281.35 line with the Ca ii] 7291.47. Other optical He i lines such as 3888.64, 4026.19 remain absent. CBC04 did not report any detection of He i lines at late times, although in the tail phase spectra this can be explained by a low signal-to-noise ratio, limited wavelength coverage or line blending. In the NIR, the day 97 and day 120 X-Shooter spectra of SN 2009kn show an He i P Cygni line at 10830 before and after the drop; however, there is no sign of 20581 He i line in any of the NIR spectra.
The epochs at which different lines emerge and disappear are very similar between SN 1994W and SN 2009kn. For the evolution of a few selected metal line profiles of SN 2009kn compared to the time series of SN 1994W, see Fig. 12. As with the Balmer series lines, this comparison demonstrates the striking similarity in the spectral evolution between SN 1994W and SN 2009kn.
The spectra of SN 2009kn contain numerous Fe lines, many of which, such as Fe ii 4233.12, 4923.94, 5018.44, are already above the detection limit in the early spectra on day 46 or day 56 and stay prominent throughout the plateau phase. Most of the Fe ii lines exhibit a clear P Cygni component with the absorption dominating over the emission component. After the light-curve drop, the Fe ii lines essentially disappear.
The most crowded regions of lines in the optical contain not only a forest of Fe ii lines but also multiple lines which we associate with Ti ii, such as 4395.03, 4443.79. These were also identified by DHG09, and compared to CBC04 this is the major difference between our line identifications. Ti ii lines are no longer detectable after the drop.
Similar to many of the Fe ii lines, Ca ii H&K 3933.66, 3968.47 (latter blended with H) emerge on day 56 and remain through the plateau phase with the emission component fading over time leaving absorption-dominated profiles on day 97. The evolution of the Ca ii triplet 8498.02, 8542.09, 8662.14 is completely opposite to Ca ii H&K. In the first X-Shooter spectrum on day 62, the Ca ii triplet is present with strong absorption components. Over time, the Ca ii triplet becomes more prominent with a clear emission component starting to dominate the line profiles. After the light-curve drop, the Ca ii triplet lines are the most prominent after H.
The O i 8446.76 line emerges in the day 62 X-Shooter spectrum together with the Ca ii NIR triplet and O i 7775.39. Both O i lines are still visible in the tail phase spectra. The tail phase NIR spectrum on day 120 also shows the O i 11286.91 line appearing, presumably pumped by Ly.
Na i D emerges in the second X-Shooter spectrum on day 97. No clear sign of the Na i D is seen in the low resolution day 74 NTT spectrum. For comparison, Na i D emerged with a clear P Cygni profile in the day 76 spectrum of SN 1994W. After the drop, Na i D is one of the most prominent lines.
Among the other new features in the two tail phase spectra on day 120 and 130, two new P Cygni lines are detected which we associate with K i 7667.01, 7701.08. These lines were also observed in the 2009 optical transient in UGC 2773 (Smith et al., 2010b), which showed spectroscopic similarities to SN 2009kn.
In our day 120 X-Shooter multiple, very narrow forbidden lines emerge which are not associated with the SN: the clear [O ii] doublet 3726.03, 3728.82, unresolved [O iii] at 4958.91, 5006.84 and Ca ii] 7291.47, 7323.89, as well as narrow Balmer line components. For the [O ii] lines we measure a km s-1 and for H km s-1. By measuring the [O ii] line fluxes, we estimate a [O ii] 3728.82/ 3726.03 ratio of , typical of H ii regions (Osterbrock & Ferland, 2006). Using the radiative transition probabilities and from NIST and collision strengths , and from Pradhan et al. (2006) at 10000 K and using equations (2) and (4) from Seaton (1954), we derived a temperature and electron density relation for the [O ii] region. Assuming the temperature to range between 5000 and 20000 K, an electron density of 100200 cm-3 was obtained, consistent with an H ii region. In the 2D spectral frames, we see an extended emission region superimposed on the position of the SN. Unsuccessful removal during the sky subtraction process of the spectra can explain this without the need to associate the emission with the SN itself. The nearby H ii region mentioned in Section 3.1 is located roughly 1.2 arcsec from SN 2009kn at a position angle 310∘, measured from north to east, corresponding to a slit angle of 130∘. As shown in Table 4, the slit positions of most of the spectra are very different to this. In particular, the 0.9 arcsec slit of the day 120 spectrum which shows the very narrow 60 km s-1 H component for the first time does not pass through the optical centre of the nearby H ii region. However, diffuse emission from the same nearby H ii region may well extend into the line-of-sight towards the SN. The earlier spectra, even with high enough resolution, are not likely to show this line feature since the SN, with strong continuum, is much brighter than in the tail phase and any background emission is lost in the noise. To explain the linewidth of the 60 km s-1 H component as thermal broadening, the required temperature would be of the order of 80000 K, obviously too high of a temperature for an H ii region. Therefore, this velocity dispersion reflects macroscopic, rather than thermal, motions of ionized gas according to a standard interpretation of a large linewidth for luminous extragalactic H ii regions (Shields, 1990).
4.4 Evolution of the spectral energy distribution
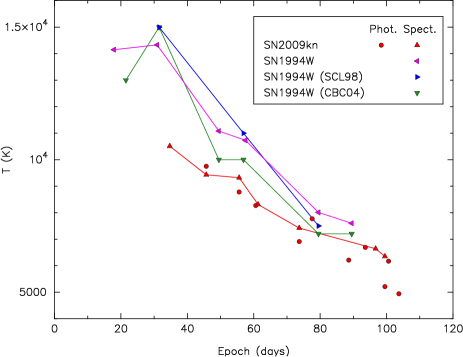
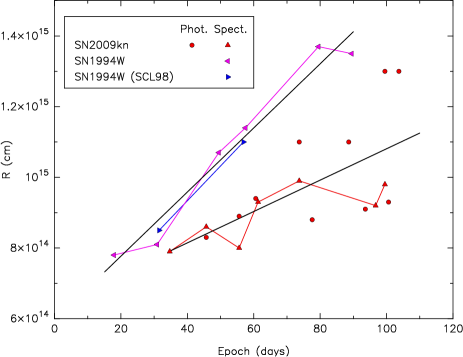
In order to compare the evolution of the SEDs between SN 2009kn and SN 1994W, we performed blackbody fits to the spectra (see Table 6). A continuum was first fitted to the dereddened and redshift-corrected optical spectra. From the continuum of the spectra, we extracted several points at every 100 Å and derived a best fit for a single blackbody by fitting. During the plateau phase, the blue end of the optical spectra is affected by severe line blanketing, similar to SN 1994W, and no single blackbody can be fitted to the continuum in this part of the spectra. For comparison, we also carried out blackbody fits solely based on the UBVRI photometry. To consistently compare SN 2009kn with SN 1994W, we carried out an absolute calibration of the observed spectra of SN 1994W using interpolated and extrapolated B- and V-band photometry (see Section 4.1) and derived blackbody properties in a similar fashion as for SN 2009kn. We adopted a distance of 25.4 Mpc and total reddening of mag for SN 1994W, the same as SCL98, CBC04 and DHG09. This distance is close to the Virgo and Great Attractor corrected luminosity distance of 23.9 Mpc (Mould et al., 2000) for the host galaxy NGC 4041. The blackbodies fitted to the early spectra of SN 2009kn are shown overlaid with the spectra in Fig. 7.
| Epoch | Data | |||
|---|---|---|---|---|
| (d) | (K) | ( cm) | (erg s-1) | |
| 35 | 10500 | 7.9 | 41.8 | Spect |
| 46 | 9750 | 8.3 | 42.6 | Phot |
| 46 | 9430 | 8.6 | 42.6 | Spect |
| 56 | 8780 | 8.9 | 42.5 | Phot |
| 56 | 9320 | 8.0 | 42.5 | Spect |
| 61 | 8270 | 9.4 | 42.5 | Phot |
| 62 | 8310 | 9.3 | 42.4 | Spect |
| 74 | 6910 | 11 | 42.3 | Phot |
| 74 | 7420 | 9.9 | 42.3 | Spect |
| 78 | 7770 | 8.8 | 42.3 | Phot |
| 89 | 6210 | 11 | 42.1 | Phot |
| 94 | 6690 | 9.1 | 42.1 | Phot |
| 100 | 5210 | 13 | 41.9 | Phot |
| 100 | 6350 | 9.8 | 42.0 | Spect |
| 101 | 6170 | 9.3 | 42.0 | Phot |
| 104 | 4940 | 13 | 41.9 | Phot |
We find that the measured blackbody temperatures decrease and radii increase during the plateau phase of SN 2009kn and SN 1994W (see Figs. 13 and 14). Using least-squares fitting, an average blackbody expansion velocity of 500 km s-1 was obtained with an initial radius of cm. In the case of SN 1994W a velocity of 1000 km s-1 with similar initial radius was found.
4.5 Line profiles of hydrogen
In Fig. 15, we show continuum-subtracted and peak-normalised Balmer line profiles for day 62. We note that the Fe ii lines have an effect on the H and H profiles. DHG09 found the broad base of the Balmer line profiles of SN 1994W increase in strength when moving to shorter wavelengths. This effect is not as clear in the case of SN 2009kn. DHG09 also simulated the behaviour of the Paschen lines for SN 1994W-like objects. However, in our NIR spectra of SN 2009kn the Pa line profile lands between the H- and K-band telluric line regions, and the signal-to-noise ratio for the rest of the Paschen lines is not high enough for a meaningful comparison.
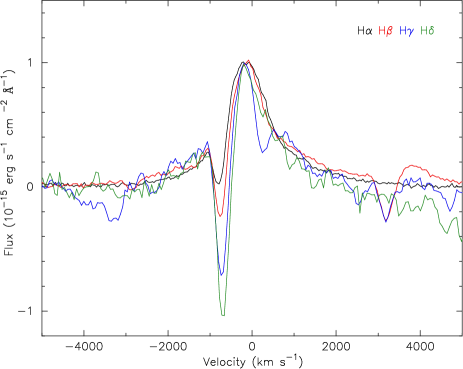
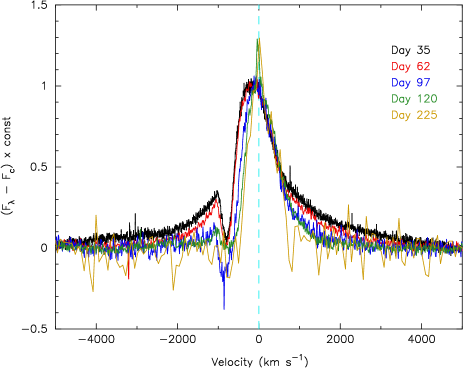
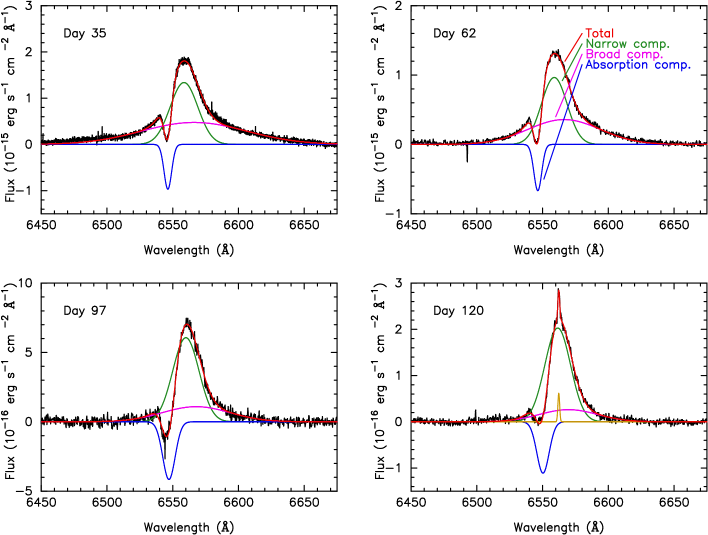
The broad base of the line profiles, shown most clearly by H, becomes weaker over time during the plateau phase and disappears after the light-curve drop. The same effect is observed also for the absorption component, whereas the narrow P Cygni emission component stays fairly constant throughout the whole observed line evolution. This indicates that the optical depth of the electron scattering is going down over time; this effect is clearly shown in Fig. 16.
To investigate the evolution of different line components, we use a simple approach to analyse the line profiles. We fitted multiple Gaussian components to the higher resolution spectra of SN 2009kn, including the VLT spectra and day 56 NOT spectrum, using the external graphical spectool task in iraf (see Fig. 17). For the time series of velocity and luminosity of different Gaussian components, see Fig. 18. Table 7 shows the measured velocities. We found a combination of a narrow P Cygni profile consisting of a Gaussian emission and absorption component and a broader Gaussian emission component to approximately describe the overall profile of H in the plateau phase of SN 2009kn. These components can be seen in all the medium-resolution spectra through the whole observed evolution of SN 2009kn, with the narrow emission component having a roughly constant FWHM velocity of 1100 km s-1. All the velocity measurements are corrected for instrumental resolution. The velocity derived from the flux minimum of the narrow Gaussian absorption component decreases as a function of time from 800 km s-1 at day 35 to 600 km s-1 at day 120. Similarly, the FWHM velocity of the broad emission component decreases from 3500 km s-1 at day 35 to 2400 km s-1 at day 120. In the case of the day 120 tail phase X-Shooter spectrum, we found it necessary to add one additional extremely narrow emission component with a resolved FWHM velocity of 60 km s-1, associated with an H ii region as mentioned in Section 4.3. The luminosities of the narrow P Cygni and the broad emission components as well as the total H luminosities were found to follow well the evolution of the R-band luminosity in the plateau phase. However, in the tail phase only the luminosity of the broad emission component follows the R-band light curve, whereas the total luminosity and narrow P Cygni component (which dominates the total luminosity) do not drop as steeply.
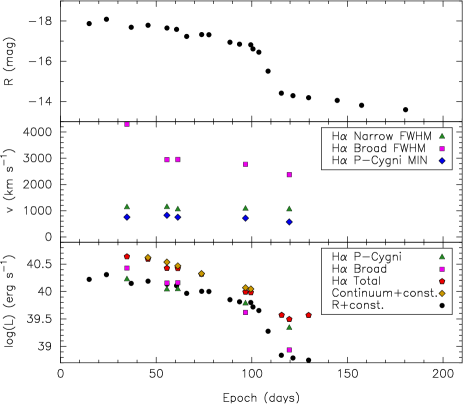
| Epoch | Narrow FWHM | Broad FWHM | P Cygni min |
|---|---|---|---|
| (d) | (km s-1) | (km s-1) | (km s-1) |
| 35 | 1133 | 4298 | 755 |
| 56 | 1140 | 2949 | 825 |
| 62 | 1050 | 2954 | 751 |
| 97 | 1075 | 2770 | 717 |
| 120 | 1051 | 2376 | 571 |
5 Discussion
5.1 Previous models for SN 1994W
Here we discuss the two models presented for SN 1994W. CBC04 conducted both radiative transfer and hydrodynamical modeling, which they compared with the observed spectra and light curves of SN 1994W. They concluded that SN 1994W was surrounded by a dense 0.4 M⊙ circumstellar (CS) envelope with an outer radius of 3 1015 cm, ejected in a violent outburst by the SN progenitor 1.5 yr before core collapsing and expanding with a velocity of 1000 km s-1. CBC04 identified three components in the observed line profiles during the plateau phase of SN 1994W. The first component is a narrow P Cygni line with km s-1 absorption minima arising from the expanding CS envelope. The second is a broad emission component with maximum blue velocity 4000 km s-1 originating from the CDS. The broad wings extending to km s-1 in the blue and km s-1 in the red make the third component, which is attributed to multiple Thomson scattering in the expanding CS envelope. Due to the high optical depth of the CDS, formed at the interface of the SN ejecta and CS envelope, only the photosphere can be observed, thus hiding any broad P Cygni emission lines arising in the hydrogen-rich ejecta. Therefore, CBC04 interpret the 4000 km s-1 velocity of the broad emission line component to correspond to the expansion velocity of the SN ejecta. The interaction of the SN ejecta with dense CSM gives rise to a higher SN luminosity than observed for typical Type IIP SNe, and the high-density medium slows down the SN ejecta. A similar model of a dense CS envelope ejected by the SN progenitor in an outburst a few years before core collapse was also suggested for SN 1995G by Chugai & Danziger (2003).
Our late tail phase observations of SN 2009kn make it difficult to understand how the narrow-line component could be associated with the CSM envelope and the broad component with the SN ejecta as presented by CBC04. With our extensive data set for SN 2009kn, we can see that coincident with the light-curve drop the broad component begins to fade rapidly, while the narrow component persists. Based on the model of CBC04, which associates the broad component with the ejecta, we would expect to continue observing this component also after the light-curve drop. Neither do the observations support the idea that the ejecta swept up and accelerated the entire CSM shell by the end of the plateau unless this took place at a much earlier epoch, before our first spectroscopic observations. Moreover, we observe no dramatic transformation of the SN 2009kn spectrum from the plateau to the tail (on day 120). This suggests that radiation transfer from the shell interior dominates. We suggest that the drop in the light curve marks not the ejecta reaching the outer edge of the entire CSM envelope, but instead the end of the cooling phase just as seen in Type IIP SNe.
DHG09 conducted a spectroscopic analysis of SN 1994W based on radiative transfer modelling, without performing any hydrodynamical modeling of the light curves. They used the model to independently produce synthetic counterparts for six epochs of observed spectra of SN 1994W. DHG09 note that their model fits poorly to the early spectra of the brightening phase of days 21 and 31. However, the following four epochs during the plateau phase reproduce the observed spectra well. DHG09 concluded that the entire line profile can be explained by a single optically thick emitting region, where the broad component results from internal multiple electron scattering in the photosphere. For comparison, in the model of CBC04, a CDS forms as a result of shock interaction between the ejecta and the CS envelope, and it behaves subsequently as a photosphere and remains optically thick throughout the plateau phase. DHG09 explain the end of the plateau phase and the drop in the light curve as the point when the photosphere becomes optically thin after receding into the fully recombined central parts of the ejecta, whereas in the model of CBC04 the drop happens when the photosphere breaks through the more slowly expanding CS envelope. DHG09 suggests reverse-shock deceleration as the reason for the lack of broad lines observed during the nebular phase. However, based on the lack of broad nebular lines and the low mass of 56Ni in SN 1994W, DHG09 also proposed that it is not necessary for the inner shell to originate from core collapse. Instead, it might have been ejected in another outburst by the progenitor star which, due to its higher velocity, catches up with the expanding outer shell. The resulting interaction would give the observed display. They propose a model where the two shells have similar masses, so that a strong enough deceleration of the inner shell could be produced.
5.2 The nature of SN 2009kn
As the bolometric tail phase luminosity of SN 2009kn is consistent with the radioactive decay tail, this supports an SN origin for SN 2009kn. This is further supported by observations of other SN 2009kn-like events. For SN 1999el, we estimate a pseudo-bolometric decline rate of mag (100 d)-1 between epochs 113 and 228 based on the UBVRIJHK light curves of Di Carlo et al. (2002) (assuming mag; see Section 3.3). For SN 1999eb, Li et al. (2002) found a late time I-band decline rate of mag (100 d)-1 using data on epochs 332, 387 and 659.
With a suitable selection of parameters, an interaction between the shells ejected in two massive and consecutive outbursts could still create a tail phase decline that mimics radioactive decay. This possibility was addressed by DHG09 in the case of SN 1994W, for which the available data (in R) showed faster decline than expected from radioactivity. This might also explain why such different light curves, resembling both Type IIP and IIL SNe, are shown by events with similar spectra (see also Dessart, Livne & Waldman, 2010). If the tail phase decline is due not to radioactive decay but to interaction between shells produced by outbursts of the progenitor, this would also mean that a similar coincidence is seen in both SN 1999eb and SN 1999el. The presence of strong forbidden nebular spectral lines, particularly the [O i] 6300.30, 6363.78 blend and Ca ii] 7291.47, 7324.89, would support a core-collapse origin for SN 2009kn, but we only see a hint of the Ca ii] blend and [O i] is absent in the late-time spectra. If SN 2009kn was indeed an SN, we associate the faintness of the forbidden lines with an effect of high density causing these lines to be collisionally de-excited (see e.g. Filippenko, 1989; Chugai & Danziger, 1994; Benetti et al., 1998; Fransson et al., 2002).
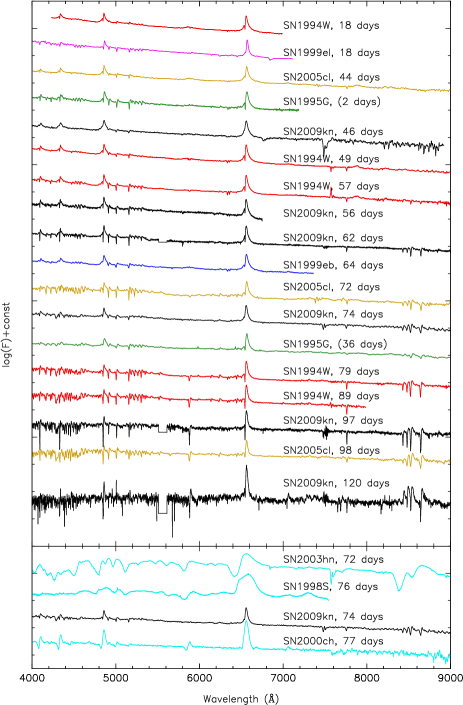
When comparing the spectral time series of SN 2009kn-like SNe, we find a striking similarity in the spectral evolution within this family of Type IIn SNe (see Fig. 19). All the SN 2009kn-like events have optical absolute peak magnitudes of to mag, which are relatively bright for being a Type II SN. CSM interaction likely explains these bright peak luminosities. A few other comparison spectra are also plotted around epoch 7080 d showing the clear difference to the Type IIn SN 1998S and the Type IIP SN 2003hn. We also compare SN 2009kn with the LBV outburst SN 2000ch, an SN impostor. The spectrum of SN 2000ch after its 2008 outburst has similar narrow-line profiles but it is much less luminous than SN 2009kn (Pastorello et al., 2010).
As shown in Section 4.5 for the H line components, the luminosity of the broad-line component seems to closely follow the luminosity of the narrow-line component during the plateau phase. This, together with the symmetry of the broad component, supports the conclusion that both the broad-line and the narrow-line components arise from the same physical region, consistent with the model of DHG09 where the narrow component is associated with the photosphere at and the broad component is due to internal electron scattering. In other words, it would require careful fine tuning of the parameters to have the narrow component arise from the CSM and the broad component from the ejecta as suggested by CBC04 for SN 1994W if their luminosities are to scale together over time. Furthermore, the velocity width of the narrow component stays fairly constant during the plateau phase, while the width of the broad component decreases. This is consistent with the temperature dropping, reducing the strength of the electron scattering. For these reasons, we favor the model of DHG09 to explain the broad base of the spectral lines with electron scattering.
As noted above, no broad spectral lines are detected in the tail phase of SN 2009kn that would indicate the higher velocities expected for typical optically thin SN ejecta. Momentum conservation argues for a CSM-ejecta mass ratio 1 if the CSM is to have a significant effect on the ejecta velocity. If we assume that SN 2009kn is a genuine SN, we suggest the following scenario. The supernova ejecta collide with a massive CS envelope, forming a swept-up shell with a velocity of km s-1. The internal energy released in the collision is converted into thermal energy, which is essentially trapped inside the optically thick swept-up shell. In many respects, the cooling of this shell is similar to what occurs during the plateau phase in Type IIP SNe. One possible explanation for the difference in this case is that, due to the large radius of the CS envelope, the trapped radiation at any particular epoch is hotter than in the corresponding Type IIP case. The recombination wave in SN 2009kn might not have formed until the very end of the plateau. The drop in the end of the plateau phase is analogous to the drop shown by genuine Type IIP SNe. The associated disappearance of the photosphere ends internal electron scattering in it and the broad H component disappears.
Subluminous, SN 2005cs-like (see Section 3.2) Type IIP SNe are particularly interesting in comparison to SN 2009kn because of their low 56Ni masses and the narrow-line profiles indicating velocities similar to SN 2009kn of the order of 1000 km s-1 at day 100. However, as shown by Pastorello et al. (2004, 2006, 2009) these low-luminosity Type IIP SNe still have higher velocities, of 4000 km s-1 on early epochs in contrast to SN 2009kn. In addition, the 56Ni masses derived for these SNe are lower than our estimate for SN 2009kn. For example Pastorello et al. (2009) gave a 56Ni mass estimate of for SN 2005cs, which is an order of magnitude below the inferred 56Ni mass for SN 2009kn. Based on direct pre-explosion progenitor observations, Maund, Smartt & Danziger (2005), Li et al. (2006) and Eldridge, Mattila & Smartt (2007) found SN 2005cs to have originated from a star with an initial mass in the range 610 M⊙. It seems unlikely that a red supergiant star of such a low mass would have experienced a massive outburst producing the CSM which SN 2009kn is interacting with; instead, SN 2009kn might have been a so-called electron-capture SN originating from a super-asymptotic giant branch (super-AGB) star close to the core-collapse limit 8M⊙. Super-AGB stars have been excluded as the progenitor of several subluminous Type IIP SNe, such as SN 2005cs (Eldridge et al. 2007), SN 2008bk (Mattila et al., 2008; Van Dyk et al., 2012), and SN 2009md (Fraser et al., 2011). However, super-AGB stars have been suggested as the progenitors of fainter () events such as SN 2008S, SN 2008ha and the 2008 optical transient in NGC 330 (see Prieto et al., 2008; Botticella et al., 2009; Pumo et al., 2009; Thompson et al., 2009; Valenti et al., 2009). Similarly, a super-AGB progenitor has also been suggested for the bright () Type IIP SN 2007od with a low derived 56Ni mass (Inserra et al., 2011). The spectra of SN 2009kn and SN 1994W are nevertheless quite unlike these events.
In the electron-capture SN model, core collapse is triggered by electron capture of 24Mg and 20Ne, which reduces the electron pressure and leads to a collapse of the oxygen-neon core, instead of an iron core (see e.g. Miyaji et al., 1980; Nomoto, 1984). The hydrogen envelope is thought to be only loosely tied to the super-AGB star and a significant amount of mass could be ejected in an outburst due to a thermal instability (Weaver & Woosley, 1979). If such major mass loss episode takes place shortly before the core collapse, it could lead to an SN showing a strong ejecta-CSM interaction. The simulations of Kitaura, Janka & Hillebrandt (2006) indicate a very low () mass of 56Ni for electron capture SNe, which is inferred in SN 2009kn. Weaver & Woosley (1979) suggest a maximum velocity of the ejected hydrogen envelope of around 100 km s-1. As shown in Section 4.3, the good resolution of our VLT spectra of SN 2009kn would have enabled us to detect and resolve any line components as narrow as this. However, we see no narrower component than the dominating P Cygni lines in our UVES and X-Shooter spectra. The original velocity of the CSM cannot have been much different from the observed 800 km s-1 P Cygni velocity unless the CSM component is an unseen rarefied wind. As already suggested in the preliminary analysis of Pastorello et al. (2011), the observed properties of SN 2009kn agree overall well with a model of an O/Ne/Mg core collapsing, preceded by a CSM envelope forming in Ne flash driven outbursts (see also the discussion by CBC04). We do point out that the 1000 km s-1 velocity we see is also consistent with a very massive LBV-like outburst (e.g. Pastorello et al., 2010). However, if SN 2009kn is considered as a core-collapse event, it is problematic to associate an LBV as the progenitor since they should not explode as SNe according to the current stellar evolution models (e.g. Langer et al., 1994).
6 Conclusions
We have shown SN 2009kn to be a twin of SN 1994W with only a few differences. The two events have similar light curves and colour evolution during a plateau phase. SN 1994W was roughly 1 mag brighter and had a few days longer plateau than SN 2009kn. The plateau phase was followed by a deep light-curve drop, slightly deeper in the case of SN 1994W, followed by a tail phase. The slope of the tail phase is the largest observed difference between the two SNe. SN 2009kn follows fairly well the radioactive decay tail of 56Co, which supports an SN nature for SN 2009kn. We infer an upper limit for the 56Ni mass of M⊙, much higher than the estimate for SN 1994W. However, given the rapid decline of the light curve of SN 1994W at the tail phase, the possibility remains that an energy source other than radioactive decay (e.g. CS interaction) could dominate in both supernovae at the tail phase. Moreover, we cannot rule out that the energy sources for the tail luminosity in these SNe are different, 56Co dominating in SN 2009kn and some other energy source dominating in SN 1994W. Therefore, the two objects, SN 2009kn and SN 1994W, could even be different kinds of transient events originating from different types of progenitors, as the CSM interaction in both the objects explains the observed similarities before the post-plateau light-curve drop. For SN 2009kn, we detect late-time NIR emission which most likely arises from newly formed dust. Unfortunately, no NIR data are available for SN 1994W for further comparison.
Our systematically obtained optical and NIR multiband photometry together with the VLT/X-Shooter spectra as late as the tail phase makes our data set the most comprehensive data set available for future detailed modelling of SN 1994W-like events. The comparison between the spectral evolution of SN 2009kn and SN 1994W also reveals striking similarity in both evolution of the line luminosities and the details of their profiles. The Ca ii] and [O i] lines which are typically strong in the nebular spectra of normal Type II SNe are faint or absent in the tail phase spectra of SN 2009kn. We attribute this to high density in the ejecta. Our spectra excludes the existence of very narrow P Cygni lines that could be associated with slow progenitor wind. Furthermore, we emphasize the similarity of the spectral evolution of other SN 2009kn- and SN 1994W-like Type IIn SNe, even though they do not necessarily show the similar Type IIP-like light curve. We have shown that the spectral line components of SN 2009kn are in a good agreement with the model of DHG09, where the broad wings in particular are caused by internal electron scattering and the whole line profile arises from the same physical region.
Acknowledgments
We thank the anonymous referee for very useful comments and suggestions. We thank Luc Dessart for very helpful comments and discussions. We thank Stefan Taubenberger for obtaining the Calar Alto observations and Irene Agnoletto for carrying out some of the NTT observations.
EK acknowledges financial support from the Finnish Academy of Science and Letters (Vilho, Yrjö and Kalle Väisälä Foundation). SM and EK acknowledge financial support from the Academy of Finland (project: 8120503). AP, SB, MT and SV are partially supported by the PRIN-INAF 2009 with the project ‘Supernovae Variety and Nucleosynthesis Yields’. GL is supported by a grant from the Carlsberg foundation. DARK is supported by the DNRF.
This paper is based on observations made with the Nordic Optical Telescope, operated on the island of La Palma jointly by Denmark, Finland, Iceland, Norway and Sweden, in the Spanish Observatorio del Roque de los Muchachos of the Instituto de Astrofisica de Canarias
The Liverpool Telescope is operated on the island of La Palma by Liverpool John Moores University in the Spanish Observatorio del Roque de los Muchachos of the Instituto de Astrofisica de Canarias with financial support from the UK Science and Technology Facilities Council.
This work is based on observations made with ESO Telescopes at the La Silla and Paranal Observatories under programme IDs 184.D-1140, 084.D-0265 and 084.D-0463.
This paper is based on observations collected at the Centro Astronómico Hispano Alemán (CAHA) at Calar Alto, operated jointly by the Max-Planck Institut für Astronomie and the Instituto de Astrofísica de Andalucía (CSIC).
The LBT is an international collaboration among institutions in the US, Italy and Germany. LBT Corporation partners are The University of Arizona on behalf of the Arizona university system, Istituto Nazionale di Astrofisica (Italy), LBT Beteiligungsgesellschaft (Germany), representing the Max-Planck Society, the Astrophysical Institute Potsdam and Heidelberg University, The Ohio State University and The Research Corporation on behalf of The University of Notre Dame, University of Minnesota and University of Virginia.
This work has been greatly facilitated and expedited by the European supernova collaboration involved in ESO-NTT large program 184.D-1140 led by Stefano Benetti.
We are grateful to the amateur astronomers from the Puckett Observatory Supernova Search for providing us their original observations.
This research has made use of the NASA/IPAC Extragalactic Database (NED) which is operated by the Jet Propulsion Laboratory, California Institute of Technology, under contract with the National Aeronautics and Space Administration.
We acknowledge the usage of the HyperLeda data base (http://leda.univ-lyon1.fr).
We have made use of the Weizmann interactive supernova data repository (www.weizmann.ac.il/astrophysics/wiserep).
References
- Aretxaga et al. (1999) Aretxaga, I., Benetti S., Terlevich R. J., Fabian A. C., Cappellaro E., Turatto M., della Valle M., 1999, MNRAS, 309, 343
- Benetti et al. (1998) Benetti S., Cappellaro E., Danziger I. J., Turatto M., Patat F., della Valle M., 1998, MNRAS, 294, 448
- Blondin & Tonry (2007) Blondin S., Tonry J. L., 2007, ApJ, 666, 1024
- Botticella et al. (2009) Botticella M. T. et al., 2009, MNRAS, 398, 1041
- Bouchet et al. (1991) Bouchet P., Phillips M. M., Suntzeff N. B., Gouiffes C., Hanuschik R. W., Wooden D. H., 1991, A&A, 245, 490
- Buzzoni et al. (1984) Buzzoni B. et al., 1984, The Messenger, 38, 9
- Cardelli, Clayton & Mathis (1989) Cardelli J. A., Clayton G. C., Mathis J. S., 1989, ApJ, 345, 245
- Chamaraux et al. (1999) Chamaraux P., Masnou J.-L., Kazés I., Saitō M., Takata T., Yamada T., 1999, MNRAS, 307, 236
- Chandra & Soderberg (2009) Chandra P., Soderberg A., 2009, The Astron. Telegram, 2335, 1
- Chugai & Danziger (1994) Chugai N. N., Danziger I. J., 1994, MNRAS, 268, 173
- Chugai & Danziger (2003) Chugai N. N., Danziger I. J., 2003, Astron. Lett., 29, 649
- Chugai et al. (2004) Chugai N. N. et al., 2004, MNRAS, 352, 1213 (CBC04)
- Dekker et al. (2000) Dekker H., D’Odorico S., Kaufer A., Delabre B., Kotzlowski H., 2000, Proc. SPIE, 4008, 534
- Dessart et al. (2009) Dessart L., Hillier D. J., Gezari S., Basa S., Matheson T., 2009, MNRAS, 394, 21 (DHG09)
- Dessart, Livne & Waldman (2010) Dessart L., Livne E., Waldman R., 2010, MNRAS, 405, 2113
- Di Carlo et al. (2002) Di Carlo E. et al., 2002, ApJ, 573, 144
- Djupvik & Andersen (2010) Djupvik A. A., Andersen J., 2010, in Diego J. M., Goicoecha L. J., González-Serrano J. I., Gorgas J., eds, Astrophys. Space Sci. Proc., Highlights of Spanish Astrophysics V. Springer-Verlag, Berlin, p. 211
- Eldridge, Mattila & Smartt (2007) Eldridge J. J., Mattila S., Smartt S. J., 2007, MNRAS, 376, L52
- Elmhamdi, Chugai & Danziger (2003) Elmhamdi A., Chugai N. N., Danziger I. J., 2003, A&A, 404, 1077
- Fassia et al. (2000) Fassia A. et al., 2000, MNRAS, 318, 1093
- Fassia et al. (2001) Fassia A. et al., 2001, MNRAS, 325, 907
- Filippenko (1989) Filippenko A. V., 1989, AJ, 97, 726
- Filippenko (1997) Filippenko A. V., 1997, ARA&A, 35, 309
- Fransson et al. (2002) Fransson C. et al., 2002, ApJ, 572, 350
- Fraser et al. (2011) Fraser M. et al., 2011, MNRAS, 417, 1417
- Gagliano et al. (2009) Gagliano R., Newton J., Puckett T., Orff T., 2009, Cent. Bureau Electron. Telegrams, 1997, 1
- Goldoni et al. (2006) Goldoni P., Royer F., François P., Horrobin M., Blanc G., Vernet J., Modigliani A., Larsen J., 2006, Proc. SPIE, 6269, 62692K
- Inserra et al. (2011) Inserra C. et al., 2011, MNRAS, 417, 261
- Jerkstrand, Fransson & Kozma (2011) Jerkstrand A., Fransson C., Kozma C., 2011, A&A, 530, A45
- Kiewe et al. (2012) Kiewe M. et al., 2012, ApJ, 744, 10
- Kitaura, Janka & Hillebrandt (2006) Kitaura F. S., Janka H.-T., Hillebrandt W., 2006, A&A, 450, 345
- Kotak et al. (2005) Kotak R., Meikle P., van Dyk S. D., Höflich P. A., Mattila S., 2005, ApJ, 628, L123
- Kotak et al. (2009) Kotak R. et al., 2009, ApJ, 704, 306
- Krisciunas et al. (2009) Krisciunas K. et al., 2009, AJ, 137, 34
- Landolt (1992) Landolt A. U., 1992, AJ, 104, 340
- Langer et al. (1994) Langer N., Hamann W.-R., Lennon M., Najarro F., Pauldrach A. W. A., Puls J., 1994, A&A, 290, 819
- Li et al. (2002) Li W., Filippenko A. V., Van Dyk S. D., Hu J., Qiu Y., Modjaz M., Leonard D. C., 2002, PASP, 114, 403
- Li et al. (2006) Li W., Van Dyk S. D., Filippenko A. V., Cuillandre J.-C., Jha S., Bloom J. S., Riess A. G., Livio M., 2006, ApJ, 641, 1060
- Li et al. (2011) Li W. et al., 2011, MNRAS, 412, 1441
- Liu et al. (2000) Liu Q.-Z., Hu J.-Y., Hang H.-R., Qiu Y.-L., Zhu Z.-X., Qiao Q.-Y., 2000, A&AS, 144, 219
- Mandel et al. (2000) Mandel H. et al., 2000, Proc. SPIE, 4008, 767
- Mattila et al. (2008) Mattila S., Smartt S. J., Eldridge J. J., Maund J. R., Crockett R. M., Danziger I. J., 2008, ApJ, 688, L91
- Maund, Smartt & Danziger (2005) Maund J. R., Smartt S. J., Danziger I. J., 2005, MNRAS, 364, L33
- Mazzali & Lucy (1993) Mazzali P. A., Lucy L. B., 1993, A&A, 279, 447
- Meikle et al. (2006) Meikle W. P. S. et al., 2006, ApJ, 649, 332
- Meikle et al. (2011) Meikle W. P. S. et al., 2011, ApJ, 732, 109
- Meisenheimer (1998) Meisenheimer K., 1998, User Guide to the CAFOS 2.2
- Miyaji et al. (1980) Miyaji S., Nomoto K., Yokoi K., Sugimoto D., 1980, PASJ, 32, 303
- Moorwood, Cuby & Lidman (1998) Moorwood A., Cuby J.-G., Lidman C., 1998, The Messenger, 91, 9
- Mould et al. (2000) Mould J. R. et al., 2000, ApJ, 529, 786
- Nomoto (1984) Nomoto K., 1984, ApJ, 277, 791
- Osterbrock & Ferland (2006) Osterbrock D. E., Ferland G. J., 2006, Astrophysics of gaseous nebulae and active galactic nuclei, 2nd edn. University Science Books, Sausalito, CA
- Pastorello et al. (2002) Pastorello A. et al., 2002, MNRAS, 333, 27
- Pastorello et al. (2004) Pastorello A. et al., 2004, MNRAS, 347, 74
- Pastorello et al. (2006) Pastorello A. et al., 2006, MNRAS, 370, 1752
- Pastorello et al. (2009) Pastorello A. et al., 2009, MNRAS, 394, 2266
- Pastorello et al. (2010) Pastorello A. et al., 2010, MNRAS, 408, 181
- Pastorello et al. (2011) Pastorello A., Benetti S., Bufano F., Kankare E., Mattila S., Turatto M., Cupani G., 2011, Astron. Nachr., 332, 266
- Paturel et al. (2003) Paturel G., Petit C., Prugniel P., Theureau G., Rousseau J., Brouty M., Dubois P., Cambrésy L., 2003, A&A, 412, 45
- Pickles (1998) Pickles A. J., 1998, PASP, 110, 863
- Pignata et al. (2011) Pignata G. et al., 2011, Cent. Bureau Electron. Telegrams, 2623, 1
- Poznanski et al. (2011) Poznanski D., Ganeshalingam M., Silverman J. M., Filippenko A. V., 2011, MNRAS, 415, L81
- Pozzo et al. (2004) Pozzo M., Meikle W. P. S., Fassia A., Geballe T., Lundqvist P., Chugai N. N., Sollerman J., 2004, MNRAS, 352, 457
- Pozzo et al. (2006) Pozzo M. et al., 2006, MNRAS, 368, 1169
- Pradhan et al. (2006) Pradhan A. K., Montenegro M., Nahar S. N., Eissner W., 2006, MNRAS, 366, L6
- Prieto et al. (2008) Prieto J. L. et al., 2008, ApJ, 681, L9
- Pumo et al. (2009) Pumo M. L. et al., 2009, ApJ, 705, L138
- Ralchenko et al. (2008) Ralchenko Yu., Kramida A. E., Reader J., NIST ASD Team, 2008, NIST Atomic Spectra Database (version 3.1.5). National Institute of Standards and Technology, Gaithersburg, MD (available online at: http://physics.nist.gov/asd, accessed on 2010 September 1)
- Richardson et al. (2002) Richardson D., Branch D., Casebeer D., Millard J., Thomas R. C., Baron E., 2002, AJ, 123, 745
- Roming et al. (2012) Roming P. W. A. et al., 2012, preprint (arXiv:1202.4840)
- Schlegel, Finkbeiner & Davis (1998) Schlegel D. J., Finkbeiner D. P., Davis M., 1998, ApJ, 500, 525
- Seaton (1954) Seaton M. J., 1954, Ann, Astrophys., 17, 74
- Shields (1990) Shields G. A., 1990, ARA&A, 28, 525
- Sigut & Pradhan (2003) Sigut T. A. A., Pradhan A. K., 2003, ApJS, 145, 15
- Skrutskie et al. (2006) Skrutskie M. F. et al., 2006, AJ, 131, 1163
- Smith et al. (2010a) Smith N., Chornock R., Silverman J. M., Filippenko A. V., Foley R. J., 2010a, ApJ, 709, 856
- Smith et al. (2010b) Smith N. et al., 2010b, AJ, 139, 1451
- Sollerman, Cumming & Lundqvist (1998) Sollerman J., Cumming R. J., Lundqvist P., 1998, ApJ, 493, 933 (SCL98)
- Stanishev (2007) Stanishev V., 2007, Astron. Nachr., 328, 948
- Stathakis & Sadler (1991) Stathakis R. A., Sadler E. M., 1991, MNRAS, 250, 786
- Steele et al. (2004) Steele I. A. et al., 2004, Proc. SPIE, 5489, 679
- Steele, Cobb & Filippenko (2009) Steele T. N., Cobb B., Filippenko A. V., 2009, Cent. Bureau Electron. Telegrams, 2011, 1
- Thompson et al. (2009) Thompson T. A., Prieto J. L., Stanek K. Z., Kistler M. D., Beacom J. F., Kochanek C. S., 2009, ApJ, 705, 1364
- Turatto et al. (1993) Turatto M., Cappellaro E., Danziger I. J., Benetti S., Gouiffes C., della Valle M., 1993, MNRAS, 262, 128
- Turatto, Benetti & Cappellaro (2003) Turatto M., Benetti S., Cappellaro E., 2003, in Hillebrandt W., Leibundgut B., eds, Proc. ESO/MPA/MPE Workshop, From Twilight to Highlight: The Physics of Supernovae. Springer-Verlag, Berlin, p. 200
- Valenti et al. (2009) Valenti S. et al., 2009, Nat, 459, 674
- Valenti et al. (2011) Valenti S. et al., 2011, MNRAS, 416, 3138
- Van Dyk et al. (2012) Van Dyk S. D. et al., 2012, AJ, 143, 19
- Vernet et al. (2011) Vernet J. et al., 2011, A&A, 536, A105
- Weaver & Woosley (1979) Weaver T. A., Woosley S. E., 1979, BAAS, 11, 724
- Wooden et al. (1993) Wooden D. H., Rank D. M., Bregman J. D., Witteborn F. C., Tielens A. G. G. M., Cohen M., Pinto P. A., Axelrod T. S., 1993, ApJS, 88, 477
- Yaron & Gal-Yam (2012) Yaron O., Gal-Yam A., 2012, preprint (arXiv:1204.1891)
Appendix A Tables
Identified lines in the spectra of SN 2009kn.
| Epoch (d) | |||||||
|---|---|---|---|---|---|---|---|
| Line (Å) | 46 | 56 | 62 | 74 | 97 | 120 | 130 |
| O ii 3726.03 + O ii 3728.82 | - | - | - | - | - | e | |
| H11 3770.63 | p | - | p | p | - | - | |
| H10 3797.90 | - | p | p | p | - | - | |
| H9 3835.38 | - | - | p | p | p | - | |
| 3880.? | - | - | p | - | - | - | |
| H8 3889.05 | p | p | p | p | p | - | |
| Ti ii 3900.55 | - | - | p | - | - | - | |
| Ti ii 3913.47 | - | - | p | - | - | - | |
| Ca ii 3933.66 | - | p | p | p | p | - | |
| Ca ii 3968.47 + H 3970.07 | - | p | p | p | p | - | |
| H 4101.74 | e | p | p | p | p | - | |
| Fe ii 4178.85 | - | p | - | p | - | - | |
| Fe ii 4233.12 | e | e | p | p | p | - | |
| Sc ii 4246.82 | - | - | - | - | p | - | |
| H 4340.47 | e | p | p | p | p | p | |
| Fe ii 4351.76 | - | e | e | - | - | - | |
| Ti ii 4395.03 | - | - | p | p | p | - | |
| Fe ii 4416.83 | - | - | - | p | p | - | |
| Ti ii 4443.79 | - | - | - | p | p | - | |
| Ti ii 4468.51 | - | - | - | p | p | - | |
| He i 4471.68 | - | - | - | - | - | e | |
| Ti ii 4501.27 | - | - | - | - | p | - | |
| Fe ii 4520.21 + Fe ii 4522.63 | - | p | p | - | - | - | |
| Ti ii 4533.97 | - | - | - | - | p | - | |
| Ti ii 4549.62 | - | - | - | - | p | - | |
| Fe ii 4555.88 | - | p | p | - | - | - | |
| Fe ii 4582.83 + Fe ii 4583.82 | - | p | p | p | - | - | |
| Fe ii 4629.34 | - | p | - | e | - | - | |
| H 4861.33 | e | p | p | p | p | p | |
| Fe ii 4923.94 | p | p | p | p | p | - | |
| O iii 4958.91 | - | - | - | - | - | e | |
| O iii 5006.84 | - | - | - | - | - | e | |
| Fe ii 5018.44 | p | p | p | p | p | e | |
| Fe ii 5169.05 | p | p | p | p | p | p | |
| Fe ii 5234.63 + Sc ii 5239.81 | - | p | p | p | p | - | |
| Fe ii 5275.98 + Fe ii 5284.12 | - | p | p | e | p | - | |
| Fe ii 5316.78 | - | p | p | p | p | - | |
| Na i 5889.95 + Na i 5895.92 | - | - | - | - | p | p | |
| H 6562.85 | e | p | p | p | p | p | e |
| He i 6678.15 | - | - | - | - | - | e | e |
| 6778.? | - | - | - | - | - | p | - |
| He i 7065.19 | - | - | - | - | e | e | |
| Ca ii 7291.47 | - | - | - | - | e | e | |
| Ca ii 7323.89 | - | - | - | - | e | e | |
| K i 7667.01 | - | - | - | - | p | p | |
| K i 7701.08 | - | - | - | - | p | p | |
| O i 7775.39 | - | p | p | p | p | p | |
| O i 8446.76 | - | p | p | p | e | e | |
| Ca ii 8498.02 | - | p | p | p | p | e | |
| Ca ii 8542.09 | - | p | p | p | p | e | |
| Ca ii 8662.14 | - | p | p | p | p | p | |
| Pa11 8862.79 | - | - | - | p | - | - | |
| Pa9 9229.01 | - | - | - | p | p | - | |
| Pa 9545.97 | - | - | - | p | - | - | |
| Epoch (d) | ||||
|---|---|---|---|---|
| Line (Å) | 62 | 76 | 97 | 120a |
| Pa 10049.40 | - | e | - | e |
| He i 10830.25 + He i 10830.34 | - | - | p | p |
| Pa 10938.10 | p | e | p | p |
| O i 11286.91 | - | - | - | e |
| Pa 12818.10 | p | e | p | e |
| Mg i 15025.00 + Mg i 15040.25 | - | - | - | e |
a On epoch 123, our automatic method described in Section 4.3 recognizes additional faint features roughly at 10236, 12707 and 15321Å as lines. However, we do not identify them and associate their detection as lines arising most likely from problems in the used method.