Effects of Thomson-Scattering Geometry on White-Light Imaging of an Interplanetary Shock: Synthetic Observations from Forward Magnetohydrodynamic Modelling
Abstract
Stereoscopic white-light imaging of a large portion of the inner heliosphere has been used to track interplanetary coronal mass ejections. At large elongations from the Sun, the white-light brightness depends on both the local electron density and the efficiency of the Thomson-scattering process. To quantify the effects of the Thomson-scattering geometry, we study an interplanetary shock using forward magnetohydrodynamic simulation and synthetic white-light imaging. Identifiable as an inclined streak of enhanced brightness in a time-elongation map, the travelling shock can be readily imaged by an observer located within a wide range of longitudes in the ecliptic. Different parts of the shock front contribute to the imaged brightness pattern viewed by observers at different longitudes. Moreover, even for an observer located at a fixed longitude, a different part of the shock front will contribute to the imaged brightness at any given time. The observed brightness within each imaging pixel results from a weighted integral along its corresponding ray-path. It is possible to infer the longitudinal location of the shock from the brightness pattern in an optical sky map, based on the east-west asymmetry in its brightness and degree of polarization. Therefore, measurement of the interplanetary polarized brightness could significantly reduce the ambiguity in performing three-dimensional reconstruction of local electron density from white-light imaging.
keywords:
white-light imaging, Thomson scattering, polarization brightness, interplanetary shock1 Introduction
Interplanetary space is permeated with the supersonic solar wind flow from the Sun. The ubiquitous solar wind not only carries large-amplitude Alfvén waves [Belcher and Davis (1971), Li and Li (2007)] but also is a transmission medium for interplanetary coronal mass ejections (CMEs) [Dryer (1994)]. CMEs, firstly discovered by white-light coronagraphs in the 1970s, are large-scale expulsions of plasma and magnetic field from the solar atmosphere. A typical CME carries a magnetic flux of Maxwells and a plasma mass of grams [Forbes et al. (2006)]. During interplanetary propagation, a CME may interact with the background structures in the ambient solar wind, such as the heliospheric current sheet (HCS) and corotating interaction regions (CIRs). Moreover, at solar maximum, multiple CMEs successively launched from the Sun are likely to interact with each other. The interaction is generally significant, nonlinear, and irreversible. The resultant complex travelling structures, sampled later at high temporal resolution by in situ instrumentation at 1 AU, are identified as magnetic cloud boundary layers [Wei et al. (2003)], CME-CIR events [Dal Lago et al. (2006)], CME-shock events [Lepping et al. (1997)], CME-CME events [Burlaga, Behannon, and Klein (1987), Dasso et al. (2009)], and so on. Interplanetary CMEs have been widely recognized as the primary driver of interplanetary disturbances and large geomagnetic storms (e.g., \openciteBurlaga1987; \openciteGosling1991; \openciteLepping1997; \openciteDalLago2006).
Optical heliospheric imagers (HIs) enable continuous monitoring of the evolution of such solar eruptions as they propagate through interplanetary space. Heliospheric imaging fills the observation gap between near-Sun coronagraph imaging and in situ measurements. Interplanetary structures are viewed by means of Thomson-scattered sunlight. The scattered light retains the same spectral characteristics as the incident sunlight on the basis of Thomson-scattering theory [Billings (1966), Howard and Tappin (2009)]. The effects of multiple scattering are negligible, because the solar wind is optically thin. The angle between the Sun and a target, such as a CME, as viewed from an observer, is termed elongation . The brightness difference between the Sun and a target (to be observed) at a large elongation is many orders of magnitude. More specifically, large CMEs at have optical intensities that are of order [DeForest et al. (2011)], where , the solar brightness unit, is the intensity of the Sun as a power per unit area (of the photosphere) per unit solid angle. To map interplanetary structures at large elongations, the Thomson-scattered signals must be separated from many other sources of diffuse light: background light from the Sun, zodiacal light, and starlight (c.f., Figure 3 from \openciteHarrison2005; Figures 5 from \openciteEyles2009; Figure 1 from \openciteJackson2010). The Thomson-scattering signals are faint and transient, whereas the other signals are intense but, fortunately, stable [Leinert and Pitz (1989)]. So by successfully subtracting the background brightness, an optical sky map taken by an HI easily reveals interplanetary transients irradiated by direct sunlight (e.g., \openciteDeForest2011). \openciteDeForest2011 proposed an image processing procedure consisting of five major steps: stationary background removal, celestial background removal (including cross-image distortion measurement), residual F corona removal, moving feature filtration in the Fourier plane, and conversion back to focal plane coordinates. Using this procedure, the solar wind at 1 AU can be imaged with a sensitivity of a few , compared to a background signal of a few . Instrument specifications for an HI require careful design that incorporates the stray-light impacts of the HI bus, HI appendages, and other instruments onboard the spacecraft [Harrison, Davis, and Eyles (2005), Eyles et al. (2009), Jackson et al. (2010)]. Historic milestones in terms of spaceborne white-light imaging were achieved by the zodiacal-light photometers [Leinert et al. (1981)] onboard the Helios spacecraft, the Large Angle and Spectrometric COronagraph (LASCO) [Brueckner et al. (1995)] onboard the Solar and Heliospheric Observatory (SOHO), the Solar Mass Ejection Imager (SMEI) [Eyles et al. (2003)] onboard the Coriolis spacecraft, and the HIs [Howard et al. (2008), Harrison et al. (2008), Eyles et al. (2009)] onboard the twin Solar-TErrestrial RElations Observatory (STEREO) [Kaiser et al. (2008)]. The STEREO mission is comprised of two spacecraft, with one leading the Earth in its orbit (STEREO A) and the other trailing behind the Earth (STEREO B). Both STEREO A and B separate from the Earth by per year. The HI instrument on each STEREO spacecraft consists of two cameras, HI-1 and HI-2, whose optical axes lie in the ecliptic. Elongation coverage in the ecliptic is – for HI-1 and – for HI-2; The field-of-view (FOV) is for HI-1 and for HI-2; The cadence is 40 minutes for HI-1 and 2 hours for HI-2 [Eyles et al. (2009), Harrison, Davies, and Rouillard (2009)]. With the launch of STEREO, a CME can be imaged from its nascent stage in the corona all the way out to 1 AU and beyond, including those that are Earth-directed [Harrison et al. (2008), Davies et al. (2009), Liu et al. (2010), Lugaz et al. (2010), DeForest et al. (2011)]. Moreover, images from the STEREO/HI-2 have revealed detailed spatial structures within CMEs, including leading-edge pileup, interior voids, filamentary structure, and rear cusps [DeForest et al. (2011)]. The leading-edge pileup of solar wind material is observed as a bright arc in optical imaging and revealed as a shock sheath from in situ sampling. With the launch of the STEREO mission, the interaction between CMEs in the inner heliosphere can be simultaneously imaged from multiple vantage points [Liu et al. (2012)]. HIs are planned as part of the payload on a number of future missions, including the Solar Orbiter and the Solar Probe Plus.
White-light images from HIs are more difficult to interpret than those from coronagraphs. CMEs imaged by the STEREO/HIs are often faint and diffuse. By stacking a time series of running difference brightness along a fixed spatial slice, often corresponding to the ecliptic, a time-elongation map (commonly called a J-map) is produced. In such a J-map, the signatures of faint propagating transients are highlighted, and the transient can be tracked. However, the interpretation of the leading edge of the transient track in a J-map can be quite controversial. By fitting its time-elongation profile extracted from the J-map created from single-spacecraft observations [Sheeley et al. (2008), Rouillard et al. (2008)], the radial velocity and direction of a CME can be estimated, assuming that the CME moves radially at a constant velocity. Such a fit can be performed independently for the two STEREO spacecraft, if the CME is observed by both. Moreover, if it is observed by both spacecraft, the CME’s position (and hence its velocity) and its propagation direction can be inferred as a function of time throughout its observation by direct triangulation [Liu et al. (2010)] or a “tangent to a sphere” method [Lugaz et al. (2010)]. The determination of CME kinematics, in particular the propagation direction, can be ambiguous. The assumptions that one is always observing the same part of a CME can lead to large errors in the estimated height of the CME’s leading edge. The structure of a CME affects the derivation of its kinematic properties, particularly at large elongations. As a CME propagates to increasingly large elongations, the location of its leading edge changes. As stated by \openciteHoward-T-A2009a, the interpretation of observations of the leading edge of a CME can be fraught with difficulties, especially at large elongations. Scattered sunlight in the inner heliosphere is not only determined by the local electron density, but also by Thomson-scattering theory. The Thomson-scattering geometry is defined by a sphere, on which the Sun and the observer are located on opposite ends of the diameter. The classical theory of Thomson-scattering, by \openciteBillings1966, was revisited by \openciteHoward-T-A2009a. \openciteHoward-T-A2009a concluded that: (1) The result of the scattering efficiency contribution is to somewhat de-emphasize the importance of the Thomson-scattering surface; (2) The Observed intensity is distributed out to large distances from the Thomson-scattering surface; (3) Such a spread of observed intensity is more significant at larger elongations. A CME can, therefore, be readily imaged at large elongations. Using SMEI observations, \openciteHoward2007 demonstrated that limb CMEs could be detected out to at least 0.5 AU. Furthermore, \openciteTappin2009 showed that CMEs could be phenomenologically modelled as a modified bubble or shell structure. However, inferring the three-dimensional location of a CME becomes more difficult with increasing elongation. In optical imaging, the observed intensity is traditionally assumed to come from a so-called plane-of-sky (POS). The POS is defined as the plane containing the Sun and being perpendicular to the line-of-sight (LOS) from an observer. While such a simple assumption is reasonable for coronagraph imaging, it is invalid for heliospheric imaging [Howard and Tappin (2009), Jackson et al. (2010)]. An inappropriate application of the POS assumption to heliospheric imaging would result in a significant underestimation of CME mass. A CME is inherently three-dimensional in nature, and imaging observations only provide two-dimensional information as a result of LOS integration through the three-dimensional structure. Effects of the projection and the Thomson-scattering are likely to affect brightness tracks in time-elongation maps. Uncertainties resulting from such effects can be assessed and disentangled quantitatively using a magnetohydrodynamic (MHD) modelling as a digital laboratory. For instance, CMEs on 24 – 25 January 2007 were modelled, and synthetic optical images compared in detail with observations from the STEREO/HIs, by \openciteLugaz2009. Moreover, by forward modelling of a travelling shock, \openciteXiong2011 demonstrated that remote-sensing signatures in coordinated white light and interplanetary scintillation (IPS) observations can be theoretically simulated. Numerical models are useful in interpreting the brightness patterns of CMEs tracked in optical sky maps, and hence aiding our understanding of heliospheric processes such as the propagation, evolution, and possible interactions of CMEs.
In this paper, we simulate a shock propagating through the inner heliosphere using an MHD model. Subsequently, we synthesize and investigate the corresponding white light images that would be observed from 1 AU. We present the numerical MHD model and the optical Thomson-scattering formulation in Section \irefSec:Method. In Section \irefSec:LOS, we describe tracking of the shock front from different perspectives, and present profiles of the scattered sunlight intensity along various LOSs. Subsequently, we analyze the brightness patterns observed in synthetic time-elongation maps and longitude-elongation maps (Section \irefSec:Pattern). Finally, we discuss remote sensing of much more complex interplanetary phenomena in both white light and radio in Section \irefSec:Summary.
2 Method
Sec:Method A numerical model of the heliosphere [Xiong et al. (2006a)] is used to associate interplanetary dynamics with corresponding observed signatures. Such a self-consistent link is summarized in the flow chart for synthetic remote-sensing in white light and radio shown in Figure 8 from \openciteXiong2011. Here, we investigate only white-light imaging for a travelling fast shock. The procedure consists of two steps, described in Sections \irefSec-sub:MHD and \irefSec-sub:TS.
2.1 Numerical MHD Model
Sec-sub:MHD Large-scale dynamics of the inner heliosphere can be physically described by MHD processes. Using a sophisticated numerical MHD model [Xiong et al. (2006a)], a blast shock wave travelling through interplanetary space is numerically simulated in this paper. We describe our model in Table \irefTab:model, establish the background solar wind in Table \irefTab:BG, and prescribe the shock injection in Table \irefTab:Shock. The simulated electron density is used to generate synthetic white-light images.
2.2 Thomson-Scattering Calculations
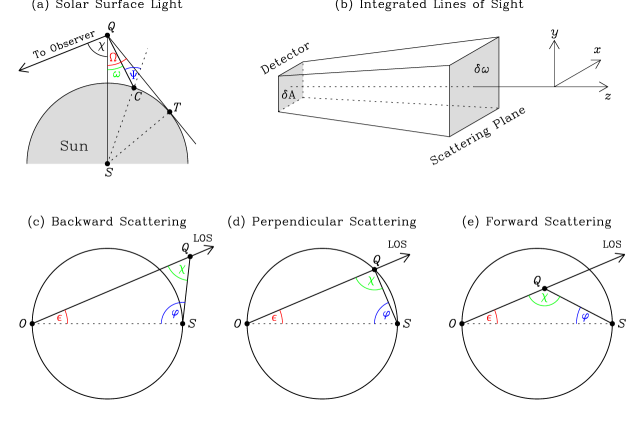
Sec-sub:TS White-light imaging is performed on the basis of the well-established Thomson-scattering theory. Interplanetary free electrons scatter white-light photons from the photosphere, so the inner heliosphere is visible as a brightness sky map. In this paper, we adopt the formulation of Thomson-scattering theory in interplanetary imaging given by \openciteHoward-T-A2009a. This is demonstrated schematically in Figure \irefCartoon. At a scattering point , the solar surface is only visible within a cone where and . The Sun looks like a limb-darkened luminous disk. All straight rays of direct sunlight intercepted at point are scattered into a full solid angle of , with part of the sunlight being scattered toward an observer at point . The observer , scattering point , and Sun center all lie in an emergent plane. At the observation site , received sunlight is direct and unpolarized along the LOS , and scattered and polarized along the LOS . The luminous magnitude of the Sun (LOS ) is dramatically higher than that of interplanetary space (LOS ) [Harrison, Davis, and Eyles (2005), Eyles et al. (2009), Jackson et al. (2010), DeForest et al. (2011)]. A series of baffles onboard the STEREO/HIs [Eyles et al. (2009)] attenuates the intense solar radiation to such a degree that the much fainter interplanetary brightness is revealed. Scattered by a single electron at point , the optical intensity , measured at point as a power per unit solid angle, can be expressed in units of . The intensity is polarized along the LOS , and can be expressed in terms of two orthogonal components and . The radial component is in the previously defined emergent plane (the –plane) and is perpendicular to the LOS . The tangent component is perpendicular to the –plane. Mathematical expressions for the luminous intensity and its constituent components ( and ) are formulated in terms of van de Hulst coefficients , , , and [Howard and Tappin (2009)]:
| (1) | |||
Here is an auxiliary parameter. , defined as the differential cross section for perpendicular scattering, is a constant of m2 Sr-1 [Howard and Tappin (2009)]. , defined as a limb-darkened coefficient, is a function of wavelength. A value for of 0.63, for a wavelength of 5500 Å is adopted in this paper. is the distance from the scattering point to the observer. The coefficients , , , and [Billings (1966)] are given as:
| (2) | |||
As the scattering point increases in heliocentric distance , becomes smaller and the Sun tends toward a point source. Accordingly, the coefficients , , , and fall off as a function of , and the differences given by and reduce. As a result, the incident sunlight becomes fainter and more collimated (c.f., Figure 4 from \openciteHoward-T-A2009a).
An imaging detector collects photons that fall within its FOV, and the brightness within a pixel will comprise contributions from all scattering sites along its LOS. \openciteHoward-T-A2009a pointed out, however, that “When interpreting real observations, it is crucial to note that although the scattering is presented as a line-of-sight integral this is not strictly true. It is in fact an integral though the cone of the instrument’s point spread function.”. The configuration for the LOS integral calculation is demonstrated schematically in Figure \irefCartoonb. The scattering plane is at a distance from the detector. The detector itself has an area of , and its FOV at distance has an area given by . The solid angle subtended by the detector at the scattering area at is given by . The brightness contribution from distance to along the LOS, where the electron number density is given by , can be expressed as follows:
| (3) |
If we let
| (4) |
Equation (\irefEqu:LOS-orig) can be further simplified to
| (5) |
Within each pixel of the detector, the optical brightness that is recorded is the LOS integral of Equation (\irefEqu:LOS-dot):
| (6) |
Hence it can be seen that the electron density and Thomson-scattering geometry factors (, , ) jointly determine the observed brightness. In terms of the electric field oscillations and , polarization is defined as:
| (7) |
Sunlight is scattered backward for (Figure \irefCartoonc), perpendicular for (Figure \irefCartoond), and forward for (Figure \irefCartoone). Perpendicular scattering toward a fixed observer comes from the so-called Thomson-scattering sphere, which is centered between the Sun and the observer (Figure \irefCartoond). On the Thomson-scattering surface itself, Thomson-scattering is actually minimized due to perpendicular scattering. However, both incident sunlight intensity and local electron density are maximized on the Thomson-scattering surface, that being where any LOS is closest to the Sun. These three competing effects determine the scattered sunlight intensity. Although maximized on the Thomson-scattering surface itself, the scattered intensity is distributed with distance away from the surface [Howard and Tappin (2009)]. Owing to the weakest scattering efficiency being on the Thomson-scattering sphere, the importance of the Thomson-scattering sphere is de-emphasized, particulary at large elongations. On the Thomson-scattering sphere, the radial component of scattering is the smallest and tangent component is the largest. Thus, the polarization of scattered sunlight is largest on the Thomson-scattering sphere, according to Equation (\irefEqu:Polarization). If it can be measured at large elongations, the polarization of scattered sunlight can provide an important clue to identifying corresponding major scattering location.
3 Line-of-Sight Profiles of Scattered Sunlight
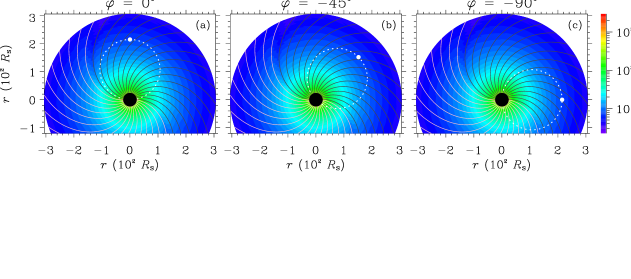
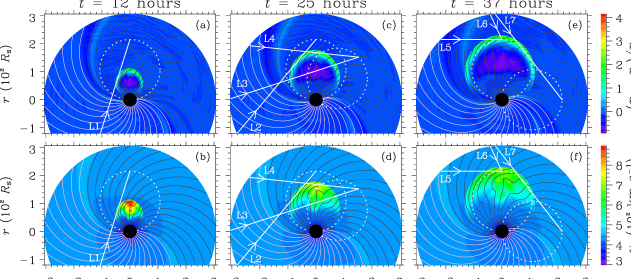
Sec:LOS The position of an interplanetary shock can be identified from a white-light imaging map as a locally enhanced brightness pattern. Sunlight scattered from a travelling shock is more intense than that scattered by the ambient solar wind, as the electrons are significantly compressed just downstream of the shock front. For the purposes of this paper, we consider an interplanetary shock viewed simultaneously by three observers that are located at fixed longitudes of , , . The observers and their corresponding Thomson-scattering spheres are depicted in Figure \irefinit. The observed brightness pattern looks different when viewed from the three different sites, and its leading edge corresponds to different sections of the shock. As shown in Figure \irefContour, the nose, left flank, and right flank of the shock are penetrated by LOSs L1, L4, and L7, respectively. Ray-paths L1, L4, and L7 are directed toward different observers, at longitudes of , , , respectively. Each of the ray-paths L1, L4, and L7 corresponds to the largest elongation at which enhanced brightness is observed in a full sky map. Even for a fixed observer, the leading edge of the brightness pattern actually corresponds to a different section of the shock at a given time. This can be demonstrated by considering an observer-directed shock travelling along the longitude (Figure \irefContour). The travelling shock front is intersected by LOS L1 at 12 hours, L2 at 25 hours, and L6 at 37 hours, respectively. The shock flank contributes to the brightness pattern observed at 12 hours, and the shock nose at 37 hours. Such a transition from the flank to the nose is smooth in time. With respect to the observer, plasma packets along a single LOS generally have different spatial speeds (where a spatial speed is expressed in an observer-centered polar coordinate system). Different spatial speeds generally correspond to different observer-centered angular speeds. So, plasma packets temporarily aligned along one LOS will spread over adjoining LOSs later (c.f., Figure 6 from \openciteXiong2011). It should be remembered that when one visualizes optical signatures of an interplanetary CME in a time-elongation map, he/she is not always observing the same part of the structure. Interpretations of brightness patterns at large elongations are usually ambiguous.
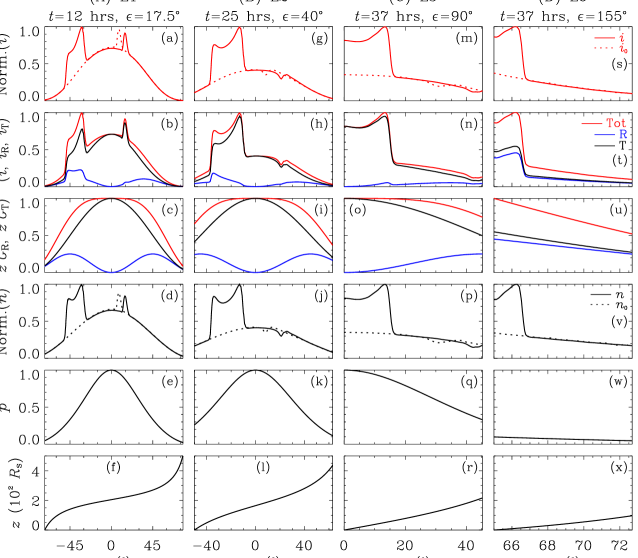
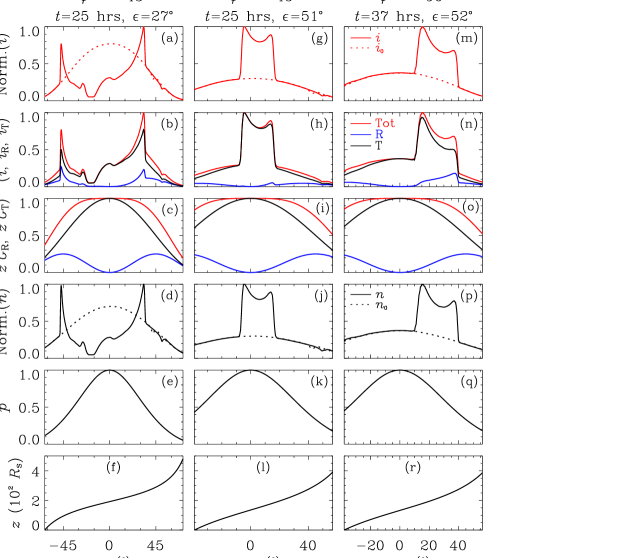
Sunlight scattered along an LOS is collected in the corresponding pixel and recorded in terms of optical brightness. The brightness in the pixel results from an integral along the LOS, as expressed in Equation (\irefEqu:LOS). Thus, the LOS distributions of localized intensities (, , ) and Thomson-scattering geometry factors (, , ) will determine which part of the LOS contributes most significantly to the total intensities observed (, , ). Such analysis of an interplanetary shock is performed for LOSs L1–L7 in Figure \irefContour, and the salient parameters are presented as a function of modified scattering angle in Figures \irefLOS-a and \irefLOS-b. Note that Figures \irefLOS-a and \irefLOS-b present normalized values of the intensities, Thomson-scattering factors, and electron density. The normalization factors are given in Table \irefTab:LOS. The Thomson-scattering factors depend on the relative geometry between the Sun, a scattering site, and the receiving observer. More specifically, the elongation and scattering angle determine the Thomson-scattering factors. The dependence of Thomson-scattering factors on and is explored by \openciteHoward-T-A2009a. For a fixed , the distribution of the Thomson-scattering factors is symmetric around (Figures \irefLOS-ac, \irefLOS-ai, \irefLOS-bc, \irefLOS-bi, and \irefLOS-bo). corresponds to perpendicular scattering, i.e., , and the scattering site lies on the Thomson-scattering sphere itself (Figure \irefCartoond). For , an observer views the hemisphere opposite the Sun, and all optical paths toward the observer are backward with . One such example is LOS L6 in Figure \irefLOS-a. The profiles of the Thomson-scattering factors are convex around for and concave around for (Figures \irefLOS-ac, \irefLOS-ai, \irefLOS-bc, \irefLOS-bi, and \irefLOS-bo). At large elongations, is negligible at . Moreover, at , the scattered sunlight is nearly linearly polarized, and its polarization is almost 1. As elongation increases, the profile of flattens. Along the nearly anti-sunward LOS L6, where , the scattered sunlight is almost unpolarized with and (Figures \irefLOS-au and \irefLOS-aw). The Thomson-scattering factors remain fairly constant within that region delimited by . In Figure \irefContour, an incident shock compresses plasma at its front, leaving a low density void behind. The distributions along LOS L3, which cuts across the density void and the shock flanks (Figures \irefContourc and \irefContourd), are presented in Figures \irefLOS-ba-f. Figure \irefLOS-bd reveals density spikes within and , and a density void within . The locally scattered intensity is jointly determined by the electron density and the Thomson-scattering factors, with , , and . The LOS profile of scattered intensity (Figure \irefLOS-ba) is similar to that of electron density (Figure \irefLOS-bd); this is not the case for the background signals. As it is , the integral of along the LOS that is recorded by a corresponding pixel, the two density spikes in Figure \irefLOS-bd would be essentially undetectable, based on measurements along LOS L3. Other LOSs in Figure \irefContour are, however, tangent to the shock front. For an observer situated at a longitude , the travelling shock can be continuously tracked as a moving brightness pattern. At 12 hours, when the leading edge of the pattern is observed at an elongation of , the shock front is bounded between along this LOS, L1 (Figure \irefLOS-ad). Simultaneously, a spike-like density enhancement exists at ; This spike, which is the signature of the heliospheric plasma sheet (HPS), has shifted from its initial location of . The HPS, initially located at and with a longitudinal width of only , co-rotates with the Sun. The density of HPS reduces with increasing heliocentric distances, so its optical brightness is negligible at large elongations. Thus the travelling shock contributes most significantly to the observed transient brightness enhancement. As time elapses, the observer-directed shock is viewed at increasingly larger elongations, and moves nearer to the corresponding Thomson-scattering sphere. Accordingly, region in a plot that corresponds to the shock compression gradually shifts toward (Figures \irefLOS-ad, \irefLOS-aj, and \irefLOS-ap). Once the observer-directed shock front has passed over the observer at 1 AU (Figures \irefContoure and \irefContourf), it scatters sunlight back toward the observer. For such backward scattering, the Thomson-scattering factors decrease monotonically with an increase in LOS depth, (Figures \irefLOS-ao and \irefLOS-au). For an observer viewing along elongations , electrons in the vicinity of the observer contribute to the majority of observed total brightness, . Hence optical imaging at elongations can provide measurements of electron number density in a similar manner to in situ observations made by a spaceborne electron detector. For an observer situated at , the shock is propagating off the Sun-observer line. However, the shock front is very likely to cross the observer’s corresponding Thomson-scattering surface. In this case, the most favorable configuration for white-light imaging is when the nose of the shock is on the Thomson-scattering surface, as can be seen from LOS L4 in Figures \irefContourc and \irefLOS-bg-l. The wide flank of the shock wave is readily imaged, even if the shock is propagating perpendicularly to the Sun-observer line. Imaged from (Figures \irefContoure and \irefContourf), the nose and left flank of the shock are too far away to be detected whereas the right flank of the shock can be detected along LOS L7 (Figures \irefLOS-bm-r). At large elongations, both the Thomson-scattering sphere and the CME volume must, therefore, be considered when interpreting optical imaging of the inner heliosphere.
4 Optical Brightness Patterns
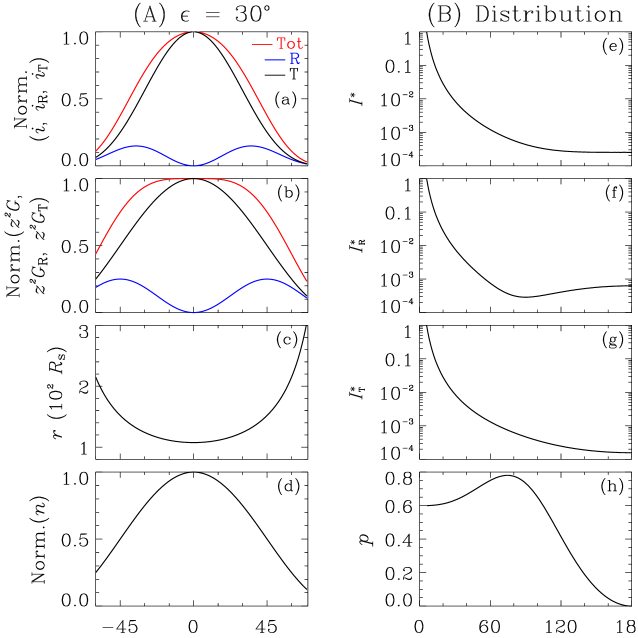
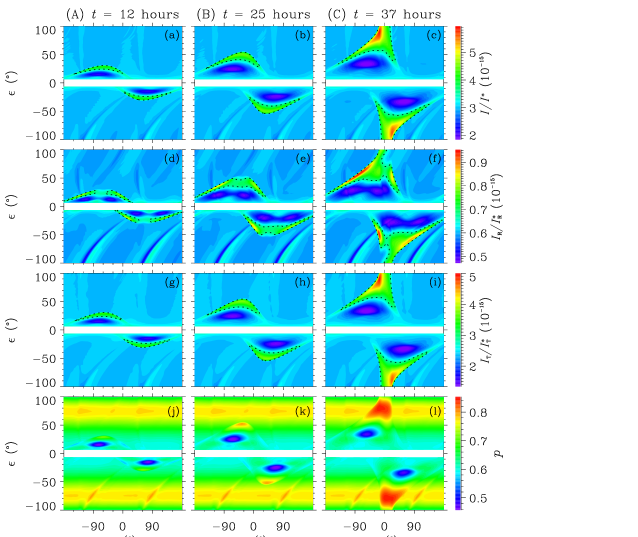
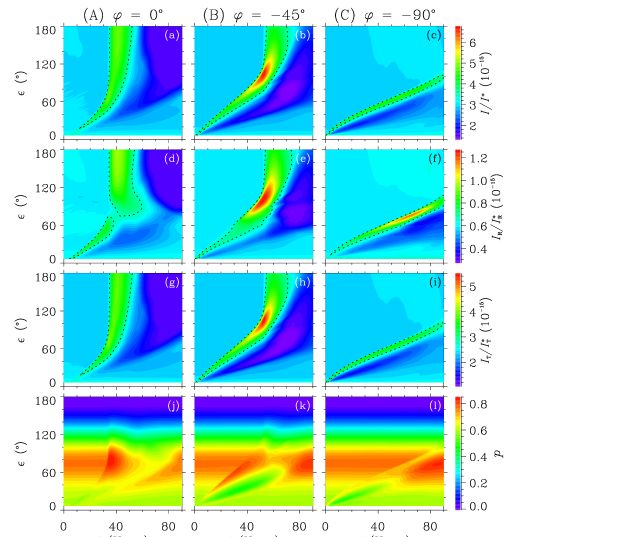
Sec:Pattern Moving brightness patterns in optical sky maps provide observational evidence of interplanetary transient disturbances such as travelling CMEs. CMEs often travel faster than the ambient solar wind, resulting in compression. Thus CMEs are often associated with dense plasma, such that sunlight scattered within the CME volume is intense. The wide FOVs of the new generation of HI instruments encompass a wide range of elongations. Transient brightness dramatically reduces with an increasing elongation . However, the observed brightness over the entire FOV can be rescaled to be within the same order of magnitude, using the normalization factors shown in Figure \irefcalibration. In the generation of Figures \irefcalibrationa-d, the electron number density is assumed to vary with heliocentric distance according to . Intensity profiles (, , ) are then calculated using the same method as for Figures \irefLOS-a and \irefLOS-b. Assuming that , and using the known values of the Thomson-scattering geometry factors (, , ), integrated intensities (, , ) within are derived; These are presented in Figures \irefcalibratione-g. , , and , which are linearly scaled to be 1 at , are used to normalize the intensity , , and shown in Figures \irefLongitude and \irefTime. CMEs cause significant derivations in heliospheric electron density away from the equilibrium situation dictated by . These normalized intensities, , , and , can be used to identify transient features in brightness sky maps. In this paper, we present such normalized intensities, for the case of a travelling shock (Figure \irefContour), as longitude-elongation () maps (Figure \irefLongitude) and time-elongation () maps (Figure \irefTime). In Figures \irefLongitudea-i and \irefTimea-i, regions with , , and are delimited by dotted lines, and are identified as corresponding to the shock front. The mapped brightness pattern significantly depends on the longitudinal position of the observer (Figure \irefLongitude). An observer at a location within the range is nearly opposite to the direction of shock propagation, so optical signals of the shock are too faint to be detected. An observer at cannot detect the shock until hours. The patterns of brightness within the longitude-elongation maps are symmetrical with respect to elongation for and unsymmetrical elsewhere (Figure \irefLongitude). The propagating shock, as observed from a fixed longitude, is manifested as an inclined streak in a time-elongation map (Figure \irefTime). The slope of this feature is steepest for (Figure \irefTime), as its arrival time at is 35 hours at compared with 50 hours at and 90 hours at . The most intense optical signatures of the shock are those observed from at a time of 12 hours (Figure \irefLongitudea) and from at 25 hours (Figure \irefLongitudeb). From these vantage points, the brightness patterns corresponding to the shock cover the widest elongation extent and exhibit the largest relative brightness enhancement due to the close proximity of the shock nose to the Thomson-scattering surface at these times (see, for example, L4 in Figure \irefContourc). When the shock front crosses 1 AU, the optical brightness is enhanced over the entire range of elongations , simultaneously. Such a crossing occurs at around hours for an observer at (Figures \irefLongitudec and \irefTimea), and near hours for an observer at (Figure \irefTimeb). The brightness enhancement, which results from backward scattering of sunlight, lasts for between 15 and 20 hours (Figures \irefTimea-b). These figures demonstrate how easily an interplanetary shock, with its wide front, can be optically imaged.
Polarization measurements of scattered sunlight are very useful in locating the three-dimensional position of a volume of dense plasma. Viewed along any elongation, the polarized intensities (, , ) are an LOS integral of the local electron density, weighted by Thomson-scattering geometry factors. The Thomson-scattering factors are different for the different polarized components, i.e., for a radial component and for a tangent component in Equation (\irefEqu:LOS). Near the Thomson-scattering surface (where ), is much larger than (Figures \irefLOS-ac, \irefLOS-ai, \irefLOS-ao, \irefLOS-bc, \irefLOS-bi, and \irefLOS-bo), and the locally scattered sunlight is nearly linearly polarized. When the heliospheric electron density is in equilibrium, the distribution of depends only on heliocentric distance , according to the expression , and the integrated scattered sunlight along elongation has the largest polarization, with a value of almost 0.8 (Figure \irefcalibrationh). An observer viewing sunlight scattered by a dense parcel of plasma will detect an increase in , an increase in , a decrease in , and an increase in polarization as the parcel of plasma approaches the Thomson-scattering surface. Polarization measurements for the shock studied in this paper are presented as longitude-elongation maps in Figure \irefLongitude and as time-elongation maps in Figure \irefTime. LOSs L2, L4, L5, and L7 (in Figure \irefContour) have polarizations of 0.68, 0.8, 0.81, 0.7, respectively. Obviously, when the shock nose lies on the Thomson-scattering surface itself, the polarization of scattered sunlight is significantly enhanced. In the longitude-elongation () maps shown in Figures \irefLongitudej-l, two localized and symmetrical patches of enhanced polarization are evident. At an elapsed time of 25 hours, one of these patches lies within the region defined by and (Figure \irefLongitudek). Inferring the three-dimensional location of an interplanetary CME at large elongations using a total intensity measurement is fraught with uncertainties [Howard and Tappin (2009)], which could be significantly reduced through the use of additional polarization measurements. Locating a CME using measurements of polarization would require the theoretical calculation of the Thomson-scattering geometry factors within the CME volume. However, once the inherent effects of Thomson-scattering are removed, the total optical intensity can be used to reliably estimate the mass of the CME. A full sky imager observing polarized light would not only be capable of monitoring the inner heliosphere, but would also enable the three dimensional location of interplanetary disturbances to be established.
The characteristic signature of a large-scale interplanetary transient in a brightness sky map is a bright arc, followed by a dark void. The bright arc corresponds to an interplanetary shock. Such a shock can be further classified either as a blast shock or a piston-driven shock. A blast shock is generated in response to an impulsive release of energy in the low corona such as a solar flare; a piston-driven shock is usually formed ahead of a fast CME. Coronagraph observations of loop-like transients are inconsistent with theoretical models of a blast shock wave [Sime, MacQueen, and Hundhausen (1984)]. Here, we consider only the white-light signatures of the interplanetary shock; the exact nature of the shock is not of relevance. In practice, features in a brightness sky map need to be detectable in absolute intensity and exhibit a sharp gradient along their boundary. Satisfying the criteria of detectability indicates that an interplanetary disturbance should be relatively close to the Thomson-scattering sphere, i.e., usually within (Figures \irefCartoonc-e). However, the shock studied in this paper is very strong, described by initial parameters given in Table \irefTab:Shock. If the shock was much weaker, the angular extent of its front would be less. In the case of a weak shock, for an observer at , the shock front would lie well inside the Thomson-scattering sphere and would be completely invisible before arriving at 1 AU. A bright arc observed by an optical imaging device may correspond to the shock forerunning a CME. During their propagation, CMEs continuously change their position relative to the Thomson-scattering surface of a corresponding observer. Therefore, the white light signature of a travelling CME will evolve continuously.
5 Discussions and Summary
Sec:Summary In this paper, we present the results of a forward modelling study of an incident shock in the inner heliosphere. Through combining a numerical MHD model [Xiong et al. (2006a)] and Thomson-scattering theory [Howard and Tappin (2009)], we are able to investigate the causal link between interplanetary dynamics and observable signatures. By synthesizing white-light observations, we confirm the significant role played by the Thomson-scattering geometry in determining the brightness of sky maps at large elongations. Furthermore, we suggest the use of interplanetary polarization measurements to help locate interplanetary CMEs; No such interplanetary observations are currently made. In contrast, the STEREO/COR and LASCO coronagraphs do have polarizers, and have been used successfully to investigate CME orientations, close to the Sun, using a polarimetric reconstruction technique (e.g., \openciteMoran2010). As demonstrated by the proof-of-concept study presented here, however, interplanetary polarization measurements made possible by future technological advances would be of significant benefit in the study of interplanetary transients such as CMEs.
Optical brightness maps contain imprints of various large-scale interplanetary processes. These processes are usually much more complex than a simple case of a travelling shock, as studied in this paper. The use of numerical models is crucial in uncovering the physics that underlies white-light observations, such that optical imaging technology can be exploited to its fullest. To our knowledge, We list some examples below:
-
1.
Interplanetary coupling of multiple CMEs/shocks.
Successive CMEs can interact with each other during their propagation, and form compound ejecta within 1 AU. A high-speed CME can drive a fast shock ahead of itself, which is wide in angular extent than the CME body itself. So CME-shock interaction is much more likely than CME-CME coupling. Both CME-shock interaction [Xiong et al. (2006a), Xiong et al. (2006b)] and CME-CME coupling [Xiong et al. (2007), Xiong et al. (2009)] were theoretically simulated in terms of interplanetary dynamics and ensuing geoeffectiveness; These theoretical modelling results are observationally confirmed by a recent work based on STEREO/HI imaging of the interaction of multiple interplanetary CMEs [Liu et al. (2012)]. The most compelling evidence for CME-CME interaction in an optical sky map is the formation of an intensely bright arc as the CME-driven shocks completely merge. This bright arc corresponds to the merged shock front, a region in which the plasma is greatly compressed. Photospheric data can be used as a driver for numerical MHD models of the inner heliosphere, to enable realistic simulations of multiple CMEs to be performed. Following the same method as used in this paper, optical sky maps can be synthesized and then compared with observed sky maps. Such a comparison helps validate the numerical MHD modelling. The use of validated numerical modelling enables individual CMEs and interaction regions to be identified within the complex brightness patterns that can be present in optical sky maps. -
2.
Interplanetary coupling of a CIR with CMEs/blobs.
CIRs are periodic spiral-like structures formed in the inner heliosphere as a result of compression at the interface between fast and slow streams. CIRs form where the fast solar wind is emitted from the rotating Sun, behind the slow solar wind, along the same solar radial. Like CMEs, although smaller in scale, plasma blobs contribute to the more transient nature of the inner heliosphere. Coronagraph observations show that plasma blobs are intermittently released from the cusps of coronal helmet streamers, and propagate at the typical slow solar wind speed [Wang et al. (1998)]. A CIR can sweep up slow blobs in front, or can impede the propagation of a following fast CME; Such blobs and/or CMEs are entrained by the CIR. Plasma blobs that become entrained within the CIR undergo strong compression such that they are highly visible in optical sky maps. Blobs entrained at the stream interface can be identified as recurring patterns of inclined streaks in time-elongation maps. In the case of CIR-CME interaction, a CIR could be warped by the entrained CME. CIR-CME interaction is generally much more disruptive than interaction between CIRs and blobs. Optical observations of blobs that have become entrained at the stream interface have been presented by \openciteSheeley2008 and \openciteRouillard2008. CIRs are inferred to have the spatial morphology of a garden-hose density spiral, based on their signatures in time-elongation maps. Interplanetary interaction between CIRs and CMEs/blobs can result in complex brightness patterns in optical sky maps. The observed brightness is dictated by multiple factors such as the Thomson-scattering geometry, the alignment of the spiral CIR along the LOSs, and local compression within interacting sites. Numerical models can aid our understanding of these CIR-related phenomena. -
3.
Coordinated observations from multiple optical and radio telescopes.
Simultaneous heliospheric imaging from multiple vantage points was successfully realized with the launch of the twin STEREO spacecraft. With stereoscopic imaging, multiple viewing ray-paths from one observer intersect with those from the other observer. Thus the three-dimensional distribution of electrons in the inner heliosphere can be reconstructed using a time-dependent tomography algorithm (c.f., \openciteJackson2003; \openciteBisi2010). At times, several IPS ray-paths lie within the imaging FOV such that CMEs can be simultaneously observed in IPS and white light [Dorrian et al. (2008), Manoharan (2010)]. The IPS technique can be used to estimate the location and speed of micro-scale electron density irregularities [Hewish, Scott, and Willis (1964), Coles and Harmon (1989)]. If such irregularities exist within a CME and some assumptions are made about the CME kinematics, the IPS signals can be used to predict the appearance of the CME in later optical sky maps [Xiong et al. (2011)]. It should be noted that newly constructed low-frequency radio interferometers such as the LOw Frequency ARray (LOFAR) [de Vos, Gunst, and Nijboer (2009)] and the Murchison Widefield Array (MWA) [Lonsdale et al. (2009)] are proving a major milestone in IPS technology. Coordinated remote sensing observations in the optical and radio regimes enable the inner heliosphere to be mapped in fine detail; Numerical models can guide such endeavors by suggesting synthesized results beforehand (e.g., \openciteXiong2011).
In closing, white-light imaging is a mainstream technology for remotely sensing the inner heliosphere. However, owing to inherent geometry effects of Thomson-scattering, deriving the kinematic properties of interplanetary transients from optical sky maps is ambiguous at large elongations. The ambiguities arising due to the Thomson-scattering geometry can be rigorously constrained, if optical imaging is complemented by other observational techniques, such as radio imaging and in situ sampling, and/or by numerical modelling. More theoretical modelling will be done as a natural extension to the preliminary results presented in this paper.
Acknowledgements
This research was supported by a rolling grant from the Science & Technology Facilities Council (STFC) to the Aberystwyth University, UK. Ming Xiong was also partially supported by Research Fund for Recipient of Excellent Award of the Chinese Academy of Sciences President’s Scholarship.
References
- Belcher and Davis (1971) Belcher, J. W., Davis, L. Jr.: 1971, Large-Amplitude Alfvén Waves in the Interplanetary Medium, 2. J. Geophys. Res., 76, 3534–3563.
- Billings (1966) Billings, D. E.: 1966, A Guide to the Solar Corona. Academic Press, San Diego.
- Bisi et al. (2010) Bisi, M. M., Jackson, B. V., Breen, A. R., Dorrian, G. D., Fallows, R. A., Clover, J. M., Hick, P. P.: 2010, Three-dimensional (3-D) reconstructions of EISCAT IPS velocity data in the declining phase of solar cycle 23. Solar Phys. 265, 233–244.
- Brueckner et al. (1995) Brueckner, G., Howard, R., Koomen, M., Korendyke, C., Michels, D., Moses, J., et al.: 1995, The Large Angle Spectroscopic Coronagraph (LASCO). Solar Phys. 162, 357–402.
- Burlaga, Behannon, and Klein (1987) Burlaga, L. F., Behannon, K. W., Klein, L. W.: 1987, Compound streams, magnetic clouds, and major geomagnetic storms. J. Geophys. Res., 92, 5725–5734.
- Coles and Harmon (1989) Coles, W. A., Harmon, J. K.: 1989, Propagation observations of the solar wind near the Sun. Astrophys. J. 337, 1023–1034.
- Dal Lago et al. (2006) Dal Lago, A., Gonzalez, W. D., Balmaceda, L. A., Vieira, L. E. A., Echer, E., Guarnieri, F. L., et al.: 2006, The 17-22 October (1999) solar-interplanetary-geomagnetic event: Very intense geomagnetic storm associated with a pressure balance between interplanetary coronal mass ejection and a high-speed stream. J. Geophys. Res. 111, A07S14.
- Dasso et al. (2009) Dasso, S., Mandrini, C. H., Schmieder, B., Cremades, H., Cid, C., Cerrato, Y., et al.: 2009, Linking two consecutive nonmerging magnetic clouds with their solar sources. J. Geophys. Res. 114, A02109.
- Davies et al. (2009) Davies, J. A., Harrison, R. A., Rouillard, A. P., Jr., N. R. S., Perry, C. H., Bewsher, D., et al.: 2009, A synoptic view of solar transient evolution in the inner heliosphere using the Heliospheric Imagers on STEREO. Geophys. Res. Lett. 36, L02102.
- DeForest et al. (2011) DeForest, C. E., Howard, T. A., Tappin, S. J.: 2011, Observations of detailed structure in the solar wind at 1 AU with STEREO/HI-2. Astrophys. J. 738, 103.
- de Vos, Gunst, and Nijboer (2009) de Vos, M., Gunst, A. W., Nijboer, R.: 2009, The LOFAR telescope: system architecture and signal processing. IEEE Proc. 97, 1431–1437.
- Dorrian et al. (2008) Dorrian, G. D., Breen, A. R., Brown, D. S., Davies, J. A., Fallows, R. A., Rouillard, A. P.: 2008, Simultaneous interplanetary scintillation and heliospheric imager observations of a coronal mass ejection. Geophys. Res. Lett. 35, L24104.
- Dryer (1994) Dryer, M.: 1994, Interplanetary studies: Propagation of disturbances between the Sun and the magnetosphere. Space Sci. Rev. 67, 363–419.
- Eyles et al. (2003) Eyles, C. J., Simnett, G. M., Cooke, M. P., Jackson, B. V., Buffington, A., Hick, P. P., et al.: 2003, The Solar Mass Ejection Imager (SMEI). Solar Phys. 217, 319–347.
- Eyles et al. (2009) Eyles, C. J., Harrison, R. A., Davis, C. J., Waltham, N. R., Shaughnessy, B. M., Mapson-Menard, H. C. A., et al.: 2009, The Heliospheric Imagers onboard the STEREO mission. Solar Phys. 254, 387–445.
- Forbes et al. (2006) Forbes, T. G., Linker, J. A., Chen, J., Cid, C., Kota, J., Lee, M. A., et al.: 2006, CME theory and models. Space Sci. Rev. 123, 251–302.
- Gosling et al. (1991) Gosling, J. T., McComas, D. J., Phillips, J. L., Bame, S. J.: 1991, Geomagnetic activity associated with Earth passage of interplanetary shock disturbances and coronal mass ejections. J. Geophys. Res. 96, 731.
- Harrison et al. (2008) Harrison, R. A., Davis, C. J., Eyles, C. J., Bewsher, D., Crothers, S. R., Davies, J. A., et al.: 2008, First imaging of coronal mass ejections in the heliosphere viewed from outside the Sun-Earth line. Solar Phys. 247, 171–193.
- Harrison, Davis, and Eyles (2005) Harrison, R. A., Davis, C. J., Eyles, C. J.: 2005, The STEREO heliospheric imager: How to detect CMEs in the heliosphere. Adv. Space Res. 36, 1512–1523.
- Harrison, Davies, and Rouillard (2009) Harrison, R. A., Davies, J. A., Rouillard, A. P., Davis, C. J., Eyles, C. J., Bewsher, D., et al.: 2009, Two years of the STEREO heliospheric imagers: Invited review. Solar Phys. 256, 219–237.
- Hewish, Scott, and Willis (1964) Hewish, A., Scott, P. F., Willis, D.: 1964, Interplanetary scintillation of small diameter radio sources. Nature 203, 1214-1217.
- Howard and Tappin (2009) Howard, T. A., Tappin, S. J.: 2009, Interplanetary coronal mass ejections observed in the heliosphere: 1. Review of theory. Space Sci. Rev. 147, 31–54.
- Howard et al. (2007) Howard, T. A., Fry, C. D., Johnston, J. C., Webb, D. F.: 2007, On the evolution of coronal mass ejections in the interplanetary medium. Astrophys. J. 667, 610–625.
- Howard et al. (2008) Howard, R. A., Moses, J. D., Vourlidas, A., Newmark, J. S., Socker, D. G., Plunkett, S. P., et al.: 2008, Sun earth connection coronal and heliospheric investigation (SECCHI), Space Sci. Rev. 136, 67–115.
- Jackson et al. (2010) Jackson, B., Buffington, A., Hick, P., Bisi, M., Clover, J.: 2010, A heliospheric imager for deep space: Lessons learned from Helios, SMEI, and STEREO. Solar Phys. 265, 257–275.
- Jackson et al. (2003) Jackson, B. V., Hick, P. P., Buffington, A., Kojima, M., Tokumaru, M., Fujiki, K., et al.: 2003, Time-dependent tomography of hemispheric features using interplanetary scintillation (IPS) remote-sensing observations. In: Velli, M., Bruno, R., Malara, F., Bucci, B. (eds.) Solar Wind Ten, AIP Conference Proceedings 679, 75–78.
- Kaiser et al. (2008) Kaiser, M. L., Kucera, T. A., Davila, J. M., St Cyr, O. C., Guhathakurta, M., Christian, E.: 2008, The STEREO mission: An introduction. Space Sci. Rev. 136, 5–16.
- Leinert and Pitz (1989) Leinert, C., Pitz, E.: 1989, Zodiacal light observed by HELIOS throughout solar cycle No. 21 - Stable dust and varying plasma. Astron. Astrophys. 210, 399–402.
- Leinert et al. (1981) Leinert, C., Pitz, E., Link, H., Salm, N.: 1981, Calibration and in-flight performance of the zodiacal light experiment on HELIOS. Space Science Instrummentation 5, 257–270.
- Lepping et al. (1997) Lepping, R. P., Burlaga, L. F., Szabo, A., Ogilvie, K. W., Mish, W. H., Vassiliadis, D., et al.: 1997, The Wind magnetic cloud and events of October 18-20, 1995: Interplanetary properties and as triggers for geomagnetic activity. J. Geophys. Res. 102, 14049–14063.
- Li and Li (2007) Li, B., Li, X.: 2007, Propagation of non-Wentzel-Kramers-Brillouin Alfvén waves in a multi-component solar wind with differential ion flow. Astrophys. J. 661, 1222–1233.
- Liu et al. (2010) Liu, Y., Davies, J. A., Luhmann, J. G., Vourlidas, A., Bale, S. D., Lin, R. P.: 2010, Geometric triangulation of imaging observations to track coronal mass ejections continuously out to 1 AU. Astrophys. J. 710, L82–L87.
- Liu et al. (2012) Liu, Y., Luhmann, J. G., Mostl, C., Martinez-Oliveros, J. C., Bale, S. D., Lin, R. P., et al.: 2012, Interactions between coronal mass ejections viewed in coordinated imaging and in situ observations. Astrophys. J. Lett. 746, L15.
- Lonsdale et al. (2009) Lonsdale, C. J., Cappallo, R. J., Morales, M. F., Briggs, F. H., Benkevitch, L., Bowman, J. D., et al.: 2009, The Murchison Widefield Array: Design overview. IEEE Proc. 97, 1497–1506.
- Lugaz et al. (2009) Lugaz, N., Vourlidas, A., Roussev, I. I., Morgan, H.: 2009, Solar-terrestrial simulation in the STEREO era: The January 2007 eruptions. Solar Phys. 256, 269–284.
- Lugaz et al. (2010) Lugaz, N., Hernandez-Charpak, J. N., Roussev, I. I., Davis, C. J., Vourlidas, A., Davies, J. A.: 2010, Determining the azimuthal properties of coronal mass ejections from multi-spacecraft remote-sensing observations with STEREO SECCHI. Astrophys. J. 715, 493–499.
- Manoharan (2010) Manoharan, P. K.: 2010, Ooty interplanetary scintillation – Remote-sensing observations and analysis of coronal mass ejections in the heliosphere. Solar Phys. 265, 137–157.
- Moran et al. (2010) Moran, T. G., Davila, J. M., Thompson, W. T.: 2010, Three-dimensional polarimetric coronal mass ejection localization tested through triangulation. Astrophys. J. 712, 453–458.
- Rouillard et al. (2008) Rouillard, A. P., Davies, J. A., Forsyth, R. J., Rees, A., Davis, C. J., Harrison, R. A., et al.: 2008, First imaging of corotating interaction regions using the STEREO spacecraft, Geophys. Res. Lett. 35, L10110.
- Sheeley et al. (2008) Sheeley, N. R. Jr., Herbst, A. D., Palatchi, C. A., Wang, Y. M., Howard, R. A., Moses, J. D., et al.: 2008, SECCHI observations of the Sun’s garden-hose density spiral. Astrophys. J. 674, 109–112.
- Sime, MacQueen, and Hundhausen (1984) Sime, D. G., MacQueen, R. M., Hundhausen, A. J.: 1984, Density distribution in looplike coronal transients: a comparison of observations and a theorietical model. J. Geophys. Res. 89, 2113–2121.
- Tappin and Howard (2009) Tappin, S. J., Howard, T. A.: 2009, Interplanetary coronal mass ejections observed in the heliosphere: 2. Model and data comparison. Space Sci. Rev. 147, 55–87.
- Wang et al. (1998) Wang, Y. M., Sheeley, N. R. Jr., Walters, J. H., Brueckner, G. E., Howard, R. A., Michels, D. J., et al.: 1998, Origin of streamer material in the outer corona. Astrophys. J. 498, L165–L168.
- Wei et al. (2003) Wei, F. S., Liu, R., Fan, Q., Feng, X. S.: 2003, Identification of the magnetic cloud boundary layers. J. Geophys. Res. 108, 1263.
- Xiong et al. (2006a) Xiong, M., Zheng, H. N., Wang, Y. M., Wang, S.: 2006a, Magnetohydrodynamic simulation of the interaction between interplanetary strong shock and magnetic cloud and its consequent geoeffectiveness. J. Geophys. Res. 111, A08105.
- Xiong et al. (2006b) Xiong, M., Zheng, H. N., Wang, Y. M., Wang, S.: 2006b, Magnetohydrodynamic simulation of the interaction between interplanetary strong shock and magnetic cloud and its consequent geoeffectiveness: 2. Oblique collision. J. Geophys. Res. 111, A11102.
- Xiong et al. (2007) Xiong, M., Zheng, H. N., Wu, S. T., Wang, Y. M., Wang, S.: 2007, Magnetohydrodynamic simulation of the interaction between two interplanetary magnetic clouds and its consequent geoeffectiveness. J. Geophys. Res. 112, A11103.
- Xiong et al. (2009) Xiong, M., Zheng, H. N., Wang, S.: 2009, Magnetohydrodynamic simulation of the interaction between two interplanetary magnetic clouds and its consequent geoeffectiveness: 2. Oblique collision. J. Geophys. Res. 114, A11101.
- Xiong et al. (2011) Xiong, M., Breen, A., Bisi, M., Owens, M., Fallows, R., Dorrian, G., Davies, J., Thomasson, P.: 2011, Forward modelling to determine the observational signatures of white-light imaging and interplanetary scintillation for the propagation of an interplanetary shock in the ecliptic plane. J. Atmos. Solar-Terr. Phys. 73, 1270–1280.
| Mathematical description | MHD equation set |
|---|---|
| scheme | Total Variation Diminishing (TVD) + |
| Weighted Essentially Non-Oscillation (WENO) | |
| type | 2.5 dimensional |
| domain | the ecliptic |
| coordinate | radial distance , longitude |
| boundary | solar radii, |
| mesh size | solar radii, |
| type | slow solar wind |
|---|---|
| structures | spiral interplanetary magnetic field, |
| a heliospheric plasma sheet astride | |
| a heliospheric current sheet (HCS) | |
| initial longitude of the HCS | |
| species | proton , electron |
| number density | cm-3 |
| radial speed | km s-1 |
| magnetic field strength | nT |
| temperature | K |
| plasma beta | |
| alignment condition |
| type | slow solar wind |
|---|---|
| location of shock nose | |
| width of shock front | |
| temporal duration | 1 hour |
| shock speed | 1630 km s-1 |
| ratio of total pressure | 24 |
| LOS | time | longitude | elongation | intensity | Thomson-scattering | electron |
|---|---|---|---|---|---|---|
| , , | geometry | number | ||||
| (hour) | (∘) | (∘) | factors | density | ||
| , , | (cm-3) | |||||
| L1 | 12 | 104.8 | ||||
| L2 | 25 | 35.7 | ||||
| L5 | 37 | 17.3 | ||||
| L6 | 37 | 17.7 | ||||
| L3 | 25 | 41.5 | ||||
| L4 | 25 | 32.7 | ||||
| L7 | 37 | 25.6 |
Figure Captions
- Figure 1
-
(a) The Sun as a surface light source, (b) configuration for the line-of-sight (LOS) integral calculations, and (c, d, e) typical Thomson-scattering geometries. In panels (a, c, d, e), points , , and indicate the Sun center, a scattering point, and an observer, respectively. The solar surface is denoted by a grey semi-circle in panel (a). The is defined as elongation , as longitude , and as scattering angle . , , and correspond to backward, perpendicular, and forward Thomson-scattering, respectively. The Thomson sphere is the locus of points corresponding to perpendicular scattering. Point is the tangent point on the solar surface from point , such that . As viewed from point , the Sun has an angular half-width of , and appears as a luminous disk. As shown in panel (b), for an idealized detector with a surface area and a beam size , the recorded brightness in each pixel of the detector is an integral through a cone determined by the size of the pixel’s point spread function. In panel (b), a local coordinate system is defined such that its –axis is along the LOS and its –plane is in the plane of sky. All diagrams in this figure are modified from Figures 3, 6, and 8 of \openciteHoward-T-A2009a. The nose of the interplanetary shock studied in this paper is initially at longitude . The longitude of an observer situated to the west (east) of the shock nose is defined to be positive (negative). Elongations west and east of the observer’s LOS are positive and negative, respectively.
- Figure 2
-
Thomson-scattering geometry for three observers at fixed longitudes in the ecliptic. The three observing sites, shown as white solid tiny circles, are at (panel (a)), at (panel (b)), and at (panel (c)), respectively. In each panel, the ecliptic cross-section of the corresponding Thomson-scattering sphere is depicted as a dotted circle. The background image shows the initial distribution of electron number density . Pink and black solid lines represent the sunward and anti-sunward interplanetary magnetic field lines, respectively.
- Figure 3
-
Relative electron density enhancement (a, c, e) and radial velocity (b, d, f) for an interplanetary shock propagating in the ecliptic at three fixed times, corresponding to 12, 25, and 37 hours. A solid arrow denotes the LOS from an observer located at a specific longitude at a radial distance of 1 AU. Four LOSs (L1, L2, L5, and L6) are viewed from , two LOS (L3 and L4) from , and one LOS (L7) from . For each of the three observers, the corresponding Thomson-scattering sphere is indicated as a dotted circle. Here, the elongations corresponding to LOSs L1–L7 are , , , , , , and , respectively.
- Figure 4
-
Intensities (, , ), Thomson-scattering geometry factors (, , ), electron number density , polarization , depth plotted as a function of modified scattering angle along L1 (Column (A)), L2 (Column (B)), L5 (Column (C)), and L6 (Column (D)). These are the LOSs that correspond to an observer at , so the shock is heading toward the observer. , , , , , , and are all normalized to their respective maximum values along each LOS, as given in Table \irefTab:LOS. Note that , , . For and , initial and disturbed profiles are depicted as solid and dashed lines, respectively.
- Figure 5
-
Intensities (, , ), Thomson-scattering geometry factors (, , ), electron number density , polarization , depth plotted as a function of scattering angle along L3 (Column (A)), L4 (Column (B)), and L7 (Column (C)). LOSs L3, L4, and L7 correspond to , , and , respectively, so the shock is propagating off the Sun-observer line. , , , , , , and are normalized to their respective maximum values, as given in Table \irefTab:LOS.
- Figure 6
-
The normalization factors , , and for Figures \irefLongitude and \irefTime. The electron number density is assumed to be dependent on heliocentric distance according to the expression . Assuming that and using the known values of the Thomson-scattering geometry factors (, , ), intensity profiles (, , ), calculated along an elongation of , are presented in column (A). Integrated intensities (, , ) as a function of elongation between and are presented in column (B). , , and are linearly scaled such that they are unity at . In addition, the polarization distribution is given in panel (h).
- Figure 7
-
Patterns of brightness , , and polarization , as viewed by observers at 1 AU and at times of 12, 25, and 37 hours, are presented in the longitude-elongation () parameter space. The dotted lines correspond to in panels (a–c), in panels (d–f), and in panels (g–i). Note that the normalization factors, , , and , are shown in Figure \irefcalibration.
- Figure 8
-
Patterns of brightness , , , and polarization , as viewed over the elongation range – by observers at 1 AU and at longitudes of , , and , are continuously recorded during the time interval of 0 – 90 hours. The dotted lines correspond to in panels (a–c), in panels (d–f), and in panels (g–i). These dotted lines bound the brightness patterns associated with the white-light imaging of the travelling shock in the parameter space. Note that the normalization factors, , , and , are shown in Figure \irefcalibration.