Characterisation of Low Frequency Gravitational Waves from Dual RF Coaxial-Cable Detector: Fractal Textured Dynamical 3-Space
Reginald T. Cahill
Progress in Physics 3, 3-10, 2012
School of Chemical and Physical Sciences, Flinders University,
Adelaide 5001, Australia
E-mail: Reg.Cahill@flinders.edu.au
Experiments have revealed that the Fresnel drag effect is not present in RF coaxial cables, contrary to a previous report. This enables a very sensitive, robust and compact detector, that is 1st order in v/c and using one clock, to detect the dynamical space passing the earth, revealing the sidereal rotation of the earth, together with significant wave/turbulence effects. These are “gravitational waves”, and previously detected by Cahill 2006, using an Optical-Fibre - RF Coaxial Cable Detector, and Cahill 2009, using a preliminary version of the Dual RF Coaxial Cable Detector. The gravitational waves have a 1/f spectrum, implying a fractal textured structure to dynamical 3-space.
1 Introduction
Data from a new gravitational wave experiment is reported111This report is from the Gravitational Wave Detector Project at Flinders University., revealing a fractal textured 3-space, flowing past the earth at 500 km/s. The wave/turbulence or “gravitational waves” have a significant magnitude, and are now known to have been detected numerous times over the last 125 years. The detector uses a single clock with RF EM waves propagating through dual coaxial cables, and is 1st order in . The detector is sensitive, simple to operate, robust and compact. It uses the surprising discovery that there is no Fresnel drag effect in coaxial cables, whereas there is in gases, optical fibres, liquids etc. Data from an analogous detector using optical fibres and single coaxial cables was reported in 2006 [1, 2]. Because of the discovery reported herein that detector calibration has now been correctly redetermined. Results from Michelson-Morley [3, 4], Miller [5], Torr and Kolen [6] and DeWitte [7], are now in remarkable agreement with the velocity of absolute motion of the earth determined from NASA spacecraft earth-flyby Doppler shift data [8, 9], all revealing a light/EM speed anisotropy of some 486km/s in the direction RA=4.29h, Dec=-75.0∘: that speed is 300,000-500 km/s for radiation travelling in that direction, and 300,000+500 km/s travelling in the opposite, northerly, direction: a significant observed anisotropy that physics has ignored. The actual daily average velocity varies with days of the year because of the orbital motion of the earth - the aberration effect discovered by Miller, but shows fluctuations over all time scales.
In 2002 it was discovered that the Michelson-Morley 1887 light-speed anisotropy experiment, using the interferometer in gas mode, had indeed detected anisotropy, by taking account of both the Lorentz length contraction effect for the interferometer arms, and the refractive index effect of the air in the light paths [3, 4]. These gas-mode interferometer experiments show the difference between Lorentzian Relativity (LR) and Special Relativity (SR). In LR the length contraction effect is caused by motion of a rod, say, through the dynamical 3-space, whereas in SR the length contraction is only a perspective effect, supposedly occurring only when the rod is moving relative to an observer. This was further clarified when an exact mapping between Galilean space and time coordinates and the Minkowski-Einstein spacetime coordinates was recently discovered [10].
The Michelson interferometer, having the calibration constant where is the refractive index of the light-path medium, has zero sensitivity to EM anisotropy and gravitational waves when operated in vacuum-mode (). Fortunately the early experiments had air present in the light paths222Michelson and Morley implicitly assumed that , which considerably overestimated the sensitivity of their detector by a factor of (air has ). This error lead to the invention of “spacetime” in 1905. Miller avoided any assumptions about the sensitivity of his detector, and used the earth orbit effect to estimate the calibration factor from his data, although even that is now known to be incorrect: the sun 3-space inflow component was unknown to Miller. It was only in 2002 that the design flaw in the Michelson interferometer was finally understood [3, 4].. A very compact and cheap Michelson interferometric anisotropy and gravitational wave detector may be constructed using optical fibres [11], but for most fibres near room temperature, and so needs to be operated at say 0∘C. The factor is caused by the Fresnel drag[12]. The detection of light speed anisotropy - revealing a flow of space past the detector, is now entering an era of precision measurements, as reported herein. These are particularly important because experiments have shown large turbulence effects in the flow, and are beginning to characterise this turbulence. Such turbulence can be shown to correspond to what are, conventionally, known as gravitational waves, although not those implied by General Relativity, but more precisely are revealing a fractal structure to dynamical 3-space.
2 Fresnel Drag
The detection and characterisation of these wave/turbulence effects requires only the development of small and cheap detectors, as these effects are large. However in all detectors the EM signals travel through a dielectric, either in bulk or optical fibre or through RF coaxial cables. For this reason it is important to understand the so-called Fresnel drag effect. In optical fibres the Fresnel drag effect has been established, as this is important in the operation of Sagnac optical fibre gyroscopes, for only then is the calibration independent of the fibre refractive index, as observed. The Fresnel drag effect is a phenomenological formalism that characterises the effect of the absolute motion of the propagation medium, say a dielectric, upon the speed of the EM radiation relative to that medium.
The Fresnel drag expression is that a dielectric in absolute motion through space at speed , relative to space itself, causes the EM radiation to travel at speed
| (1) |
wrt the dielectric, when and have the same direction. Here is the dielectric refractive index. The 2nd term is known as the Fresnel drag, appearing to show that the moving dielectric “drags” the EM radiation, although this is a misleading interpretation; see [13] for a derivation333The Fresnel Drag in (1) can be “derived” from the Special Relativity velocity-addition formula, but there is the speed of the dielectric wrt to the observer, and as well common to both dielectrics and coaxial cables.. If the Fresnel drag is always applicable then, as shown herein, a 1st order in detector requires two clocks, though not necessarily synchronised, but requiring a rotation of the detector arm to extract the -dependent term. However, as we show herein, if the Fresnel drag is not present in RF coaxial cables, then a detector 1st order in and using one clock, can detect and characterise the dynamical space. In [13] it was incorrectly concluded that the Fresnel effect was present in RF coaxial cables, for reasons related to the temperature effects, and discussed later.
3 Dynamical 3-Space
We briefly outline the dynamical modelling of 3-space. It involves the space velocity field , defined relative to an observer’s frame of reference.
| (2) |
and . The velocity field describes classically the time evolution of the substratum quantum foam. The bore hole anomaly data has revealed , the fine structure constant. The matter acceleration is found by determining the trajectory of a quantum matter wavepacket. This is most easily done by maximising the proper travel time :
| (3) |
where is the velocity of the wave packet, at position , wrt the local space - a neo-Lorentzian Relativity effect. This ensures that quantum waves propagating along neighbouring paths are in phase, and so interfere constructively. This maximisation gives the quantum matter geodesic equation for
| (4) |
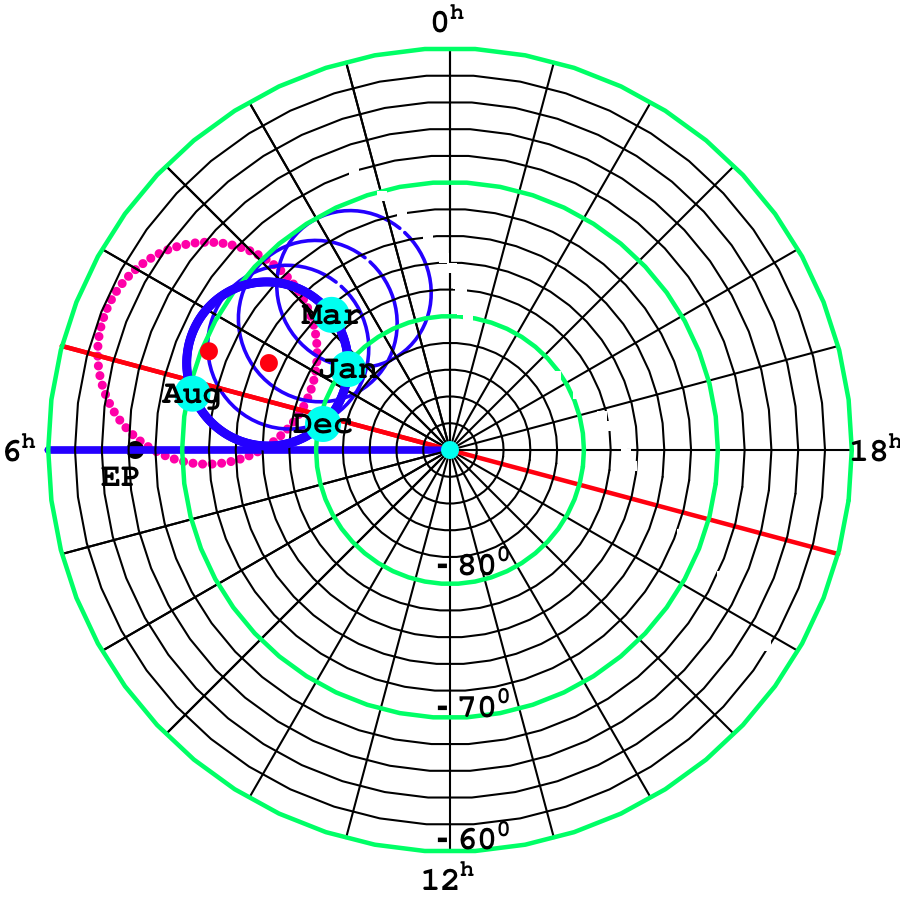
with . The 1st term in is the Euler space acceleration , the 2nd term explains the Lense-Thirring effect, when the vorticity is non-zero, and the last term explains the precession of orbits. While the velocity field has been repeatedly detected since the Michelson-Morley 1887 experiment, the best detection has been using the spacecraft earth-flyby Doppler shift data [9], see Fig.1. The above reveals gravity to be an emergent phenomenon where quantum matter waves are refracted by the time dependent and inhomogeneous 3-space velocity field. The -term in (2) explains the so-called “dark matter” effects: if and we derive Newtonian gravity, for then [12]. Note that the relativistic term in (4) arises from the quantum matter dynamics - not from the space dynamics.
4 Gravitational Waves: Dynamical Fractal 3-Space
Eqn.(3) for the elapsed proper time maybe written in differential form as
| (5) |
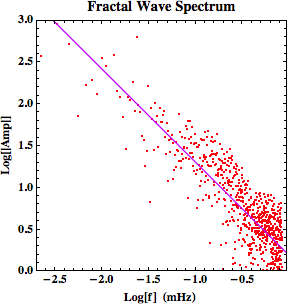
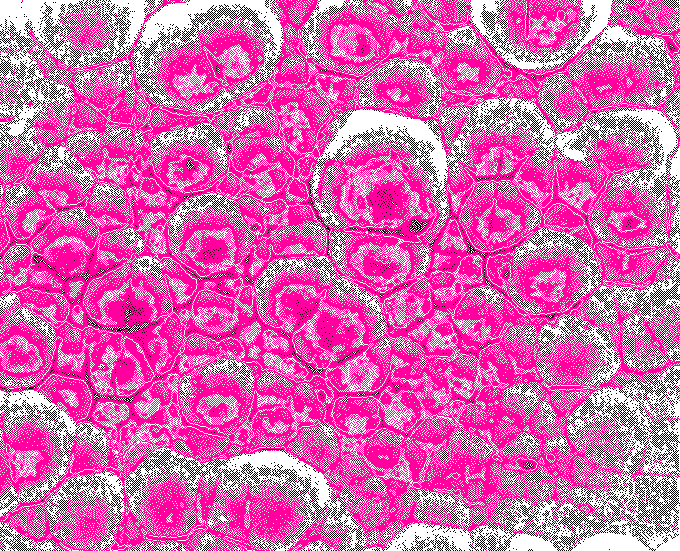
which introduces a curved spacetime metric for which the geodesics are the quantum matter trajectories when freely propagating through the dynamical 3-space. Gravitational wave are traditionally thought of as “ripples” in the space-time metric . But the discovery of the dynamical 3-space means that they are more appropriately understood to be turbulence effects of the dynamical 3-space vector , because it is that is directly detectable, whereas is merely an induced mathematical artefact. When the matter density , (2) will have a time-dependent fractal structure solutions, as there is no length scale. The wave/turbulence effects reported herein confirm that prediction, see Fig.9.
5 First Order in Speed of EMR Experiments
Fig.2 shows the arrangement for measuring the one-way speed of light, either in vacuum, a dielectric, or RF coaxial cable. It is usually argued that one-way speed of light measurements are not possible because the clocks and cannot be synchronised. However this is false, and at the same time shows an important consequence of (1). In the upper part of Fig.2 the actual travel time from to is determined by
| (6) |
where the 2nd term comes from the end moving an additional distance during time interval . Then
| (7) |
| (8) |
on using (1), i.e. assuming the validity of the Fresnel effect, and expanding to 1st oder in . However if there is no Fresnel drag effect then we obtain
| (9) |
| (10) |
The important observation is that the terms are independent of the dielectric refractive index in (7) and (8), but have an dependence in (9) and (10), in the absence of the Fresnel drag effect.
If the clocks are not synchronised then is not known, but by changing direction of the light path, that is varying , the magnitude of the 2nd term may be separated from the magnitude of the 1st term, and and its direction determined. The clocks may then be synchronised. For a small detector the change in can be achieved by a direct rotation. Results (7) and (8), or (9) and (10), have been exploited in various detector designs.
6 DeWitte 1st Order in Detector
The DeWitte km RF coaxial cable experiment, Brussels 1991, was a double 1st order in detector, using the scheme in Fig.2, and employing 3 Caesium atomic clocks at each end, and overall measuring . The orientation was NS and rotation was achieved by that of the earth [7].
| (11) |
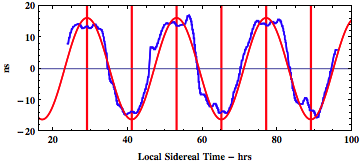
The dynamic range of is , caused by the earth rotation, where is the latitude of the detector location, is the local inclination to the horizontal, here , and is the declination of . The data shows remarkable agreement with the velocity vector from the flyby Doppler shift data, see Fig.3. However if there is Fresnel drag in the coaxial cables, there would be no factor in (11), and the DeWitte data would give a much larger speed km/s, in strong disagreement with the flyby data.
7 Torr and Kolen 1st Order in Detector
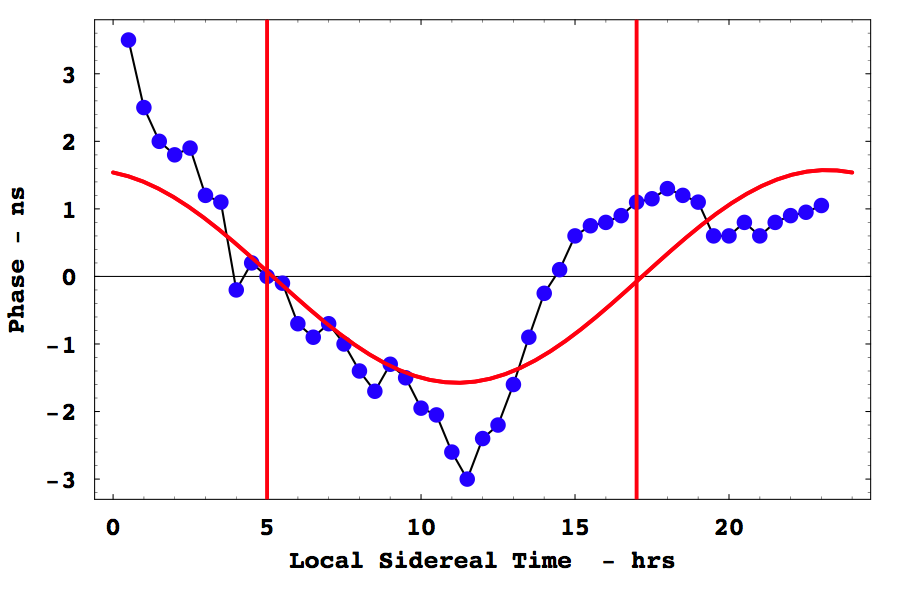
A one-way coaxial cable experiment was performed at the Utah University in 1981 by Torr and Kolen [6]. This involved two Rb clocks placed approximately m apart with a 5 MHz sinewave RF signal propagating between the clocks via a nitrogen filled coaxial cable buried in the ground and maintained at a constant pressure of 2 psi. Torr and Kolen observed variations in the one-way travel time, as shown in Fig.4 by the data points. The theoretical predictions for the Torr-Kolen experiment for a cosmic speed of km/s from the direction, RA=, Dec=-, as shown in Fig.4. The maximum/minimum effects occurred, typically, at the predicted times. Torr and Kolen reported fluctuations in both the magnitude, from 1 - 3 ns, and time of the maximum variations in travel time, just as observed in all later experiments, namely wave effects.

8 Dual RF Coaxial Cable Detector
The Dual RF Coaxial Cable Detector exploits the Fresnel drag anomaly, in that there is no Fresnel drag effect in RF coaxial cables. Then from (9) and (10) the round trip travel time is, see Fig.6,
| (12) |
where and are the effective refractive indices for the two different RF coaxial cables, with two separate circuits to reduce temperature effects. Shown in Fig.5 is a photograph. The Andrews Phase Stabilised FSJ1-50A has , while the HJ4-50 has . One measures the travel time difference of two RF signals from a Rubidium frequency standard (Rb) with a Digital Storage Oscilloscope (DSO). In each circuit the RF signal travels one-way in one type of coaxial cable, and returns via a different kind of coaxial cable. Two circuits are used so that temperature effects cancel - if a temperature change alters the speed in one type of cable, and so the travel time, that travel time change is the same in both circuits, and cancels in the difference. The travel time difference of the two circuits at the DSO is
| (13) |
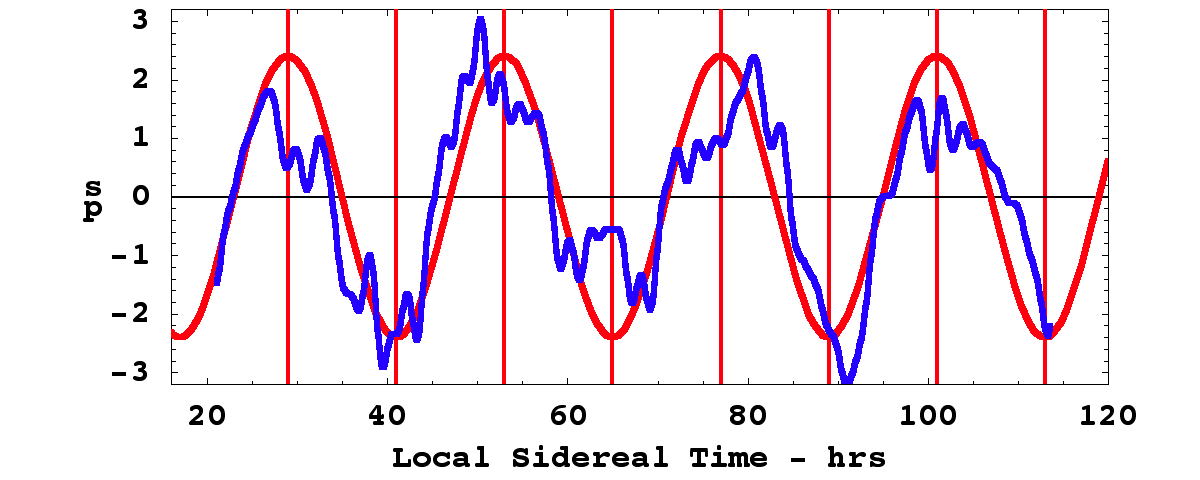
If the Fresnel drag effect occurred in RF coaxial cables, we would use (7) and (8) instead, and then the term is replaced by , i.e. there is no 1st order term in . That is contrary to the actual data in Figs.3 and 7.
The preliminary layout for this detector used cables laid out as in Fig.6, and the data is shown in Fig.3. In the compact design the Andrew HJ4-50 cables are cut into 8 1.85m shorter lengths in each circuit, corresponding to a net length of m, and the Andrew FSJ1-50A cables are also cut, but into longer lengths to enable joining. However the curved parts of the Andrew FSJ1-50A cables contribute only at 2nd order in . The apparatus was horizontal, , and orientated NS, and used the rotation of the earth to change the angle . The dynamic range of , caused by the earth rotation only, is again , where is the latitude of Adelaide. Inclining the detector at angle removes the earth rotation effect, as now the detector arm is parallel to the earth’s spin axis, permitting a more accurate characterisation of the wave effects.
9 Temperature Effects
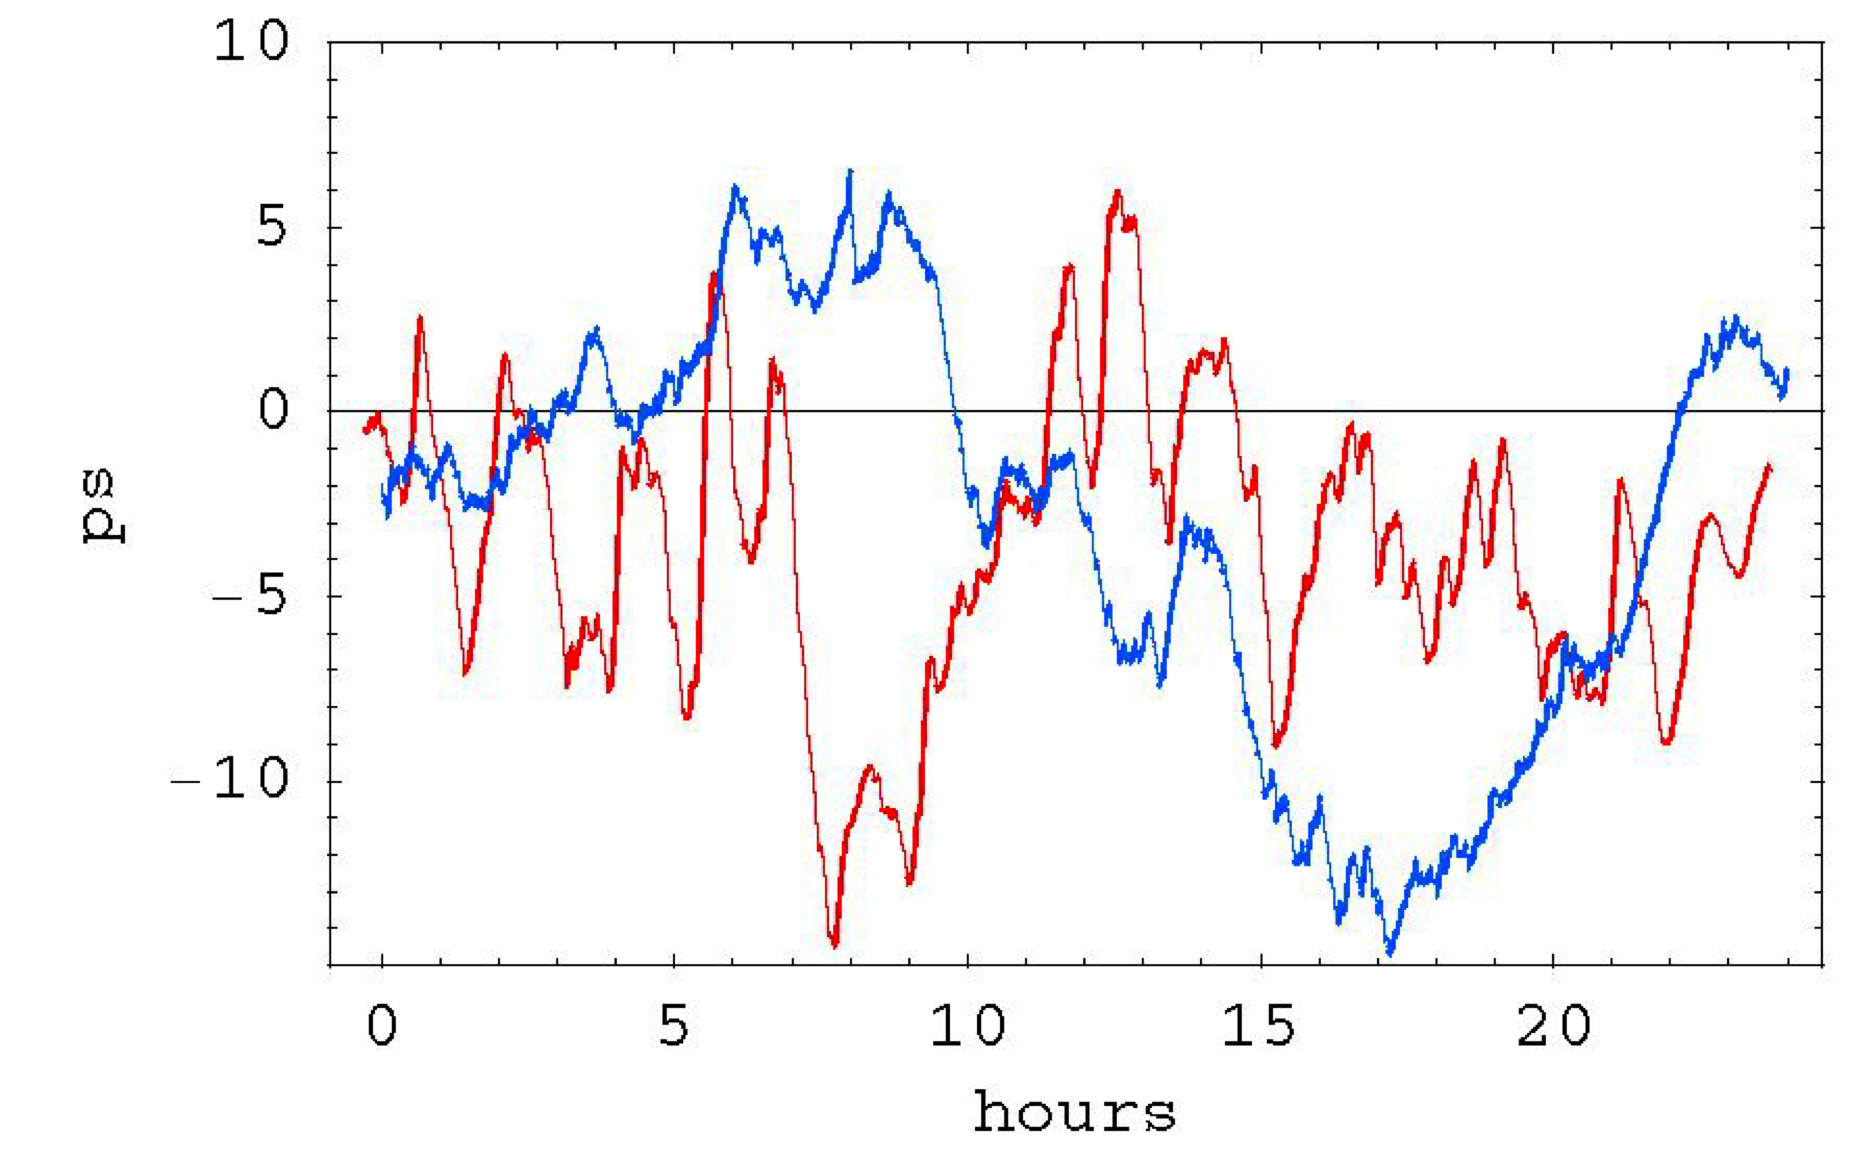
The cable travel times and the DSO phase measurements are temperature dependent, and these effects are removed from the data, rather than attempt to maintain a constant temperature, which is impractical because of the heat output of the Rb clock and DSO. The detector was located in a closed room in which the temperature changed slowly over many days, with variations originating from changing external weather driven temperature changes. The temperature of the detector was measured, and it was assumed that the timing errors were proportional to changes in that one measured temperature. These timing errors were some 30ps, compared to the true signal of some 8ps. Because the temperature timing errors are much larger, the temperature induced was fitted to the timing data, and the coefficients and determined. Then this time series was subtracted from the data, leaving the actual required phase data. This is particularly effective as the temperature variations had a distinctive time signature. The resulting data is shown in Fig.8. In an earlier test for the Fresnel drag effect in RF coaxial cables [13] the technique for removing the temperature induced timing errors was inadequate, resulting in the wrong conclusion that there was Fresnel drag in RF coaxial cables.
10 Dual RF Coaxial Cable Detector: Data
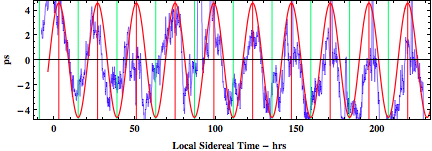
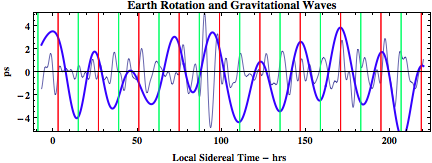
The phase data, after removing the temperature effects, is shown in Fig.8 (top), with the data compared with predictions for the sidereal effect only from the flyby Doppler shift data. As well that data is separated into two frequency bands (bottom), so that the sidereal effect is partially separated from the gravitational wave effect, viz 3-space wave/turbulence. Being 1st order in it is easily determined that the space flow is from the southerly direction, as also reported in [1]. Miller reported the same sense, i.e. the flow is essentially from S to N, though using a 2nd order detector that is more difficult to determine. The frequency spectrum of this data is shown in Fig.7, revealing a fractal form. This implies the fractal structure of the 3-space indicated in Fig.9.
11 Optical Fibre RF Coaxial Cable Detector
An earlier 1st order in gravitational wave detector design is shown in Fig.11, with some data shown in Fig.10. Only now is it known why that detector also worked, namely that there is a Fresnel drag effect in the optical fibres, but not in the RF coaxial cable. Then the travel time difference, measured at the DSO, is given by
| (14) |
where is the effective refractive index of the RF coaxial cable. Again the data is in remarkable agreement with the flyby determined .
12 2nd Order in Gas-Mode Detectors
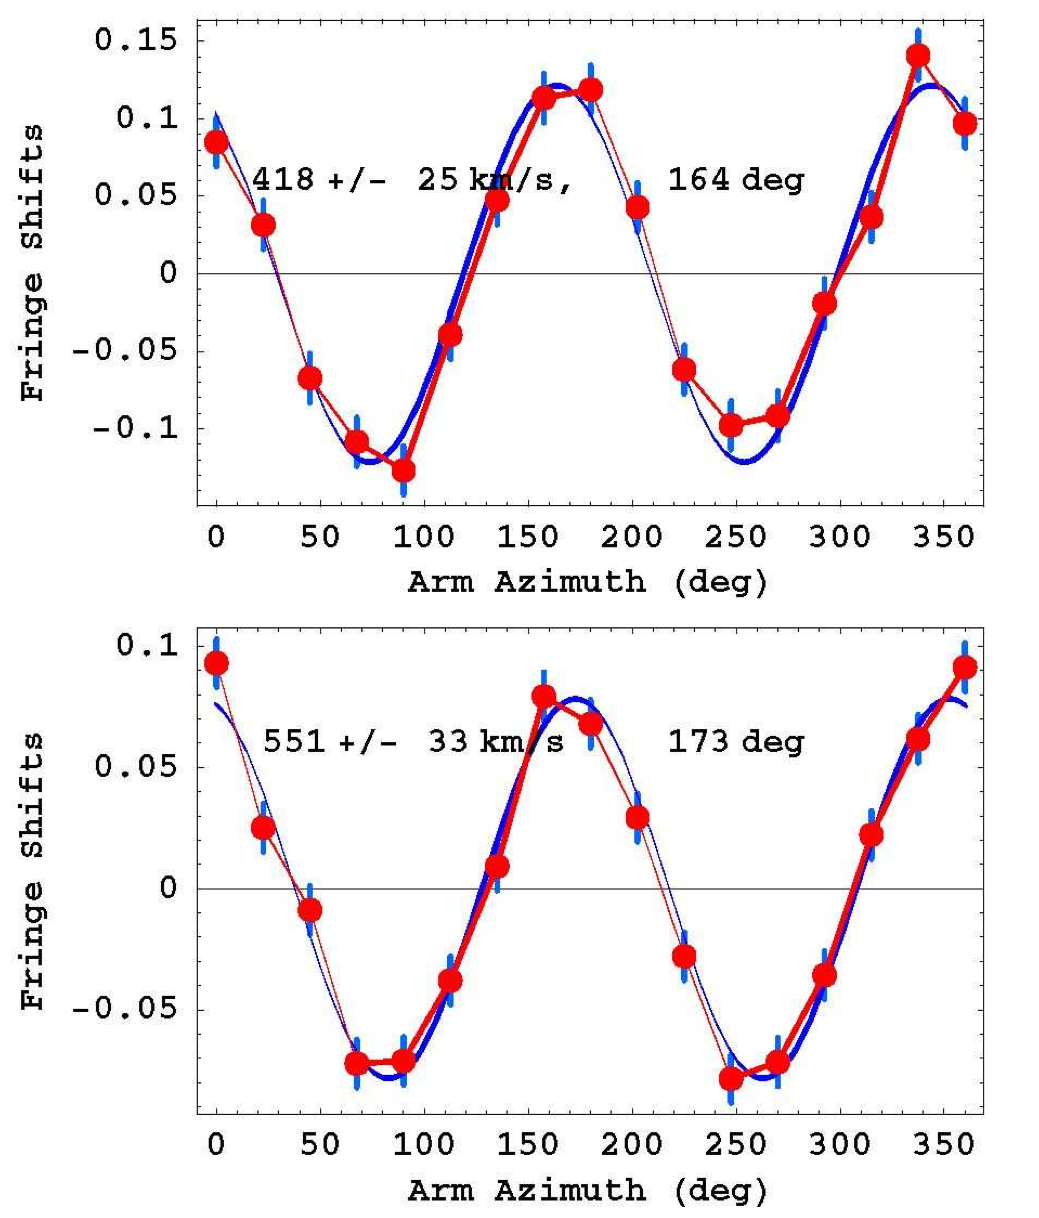
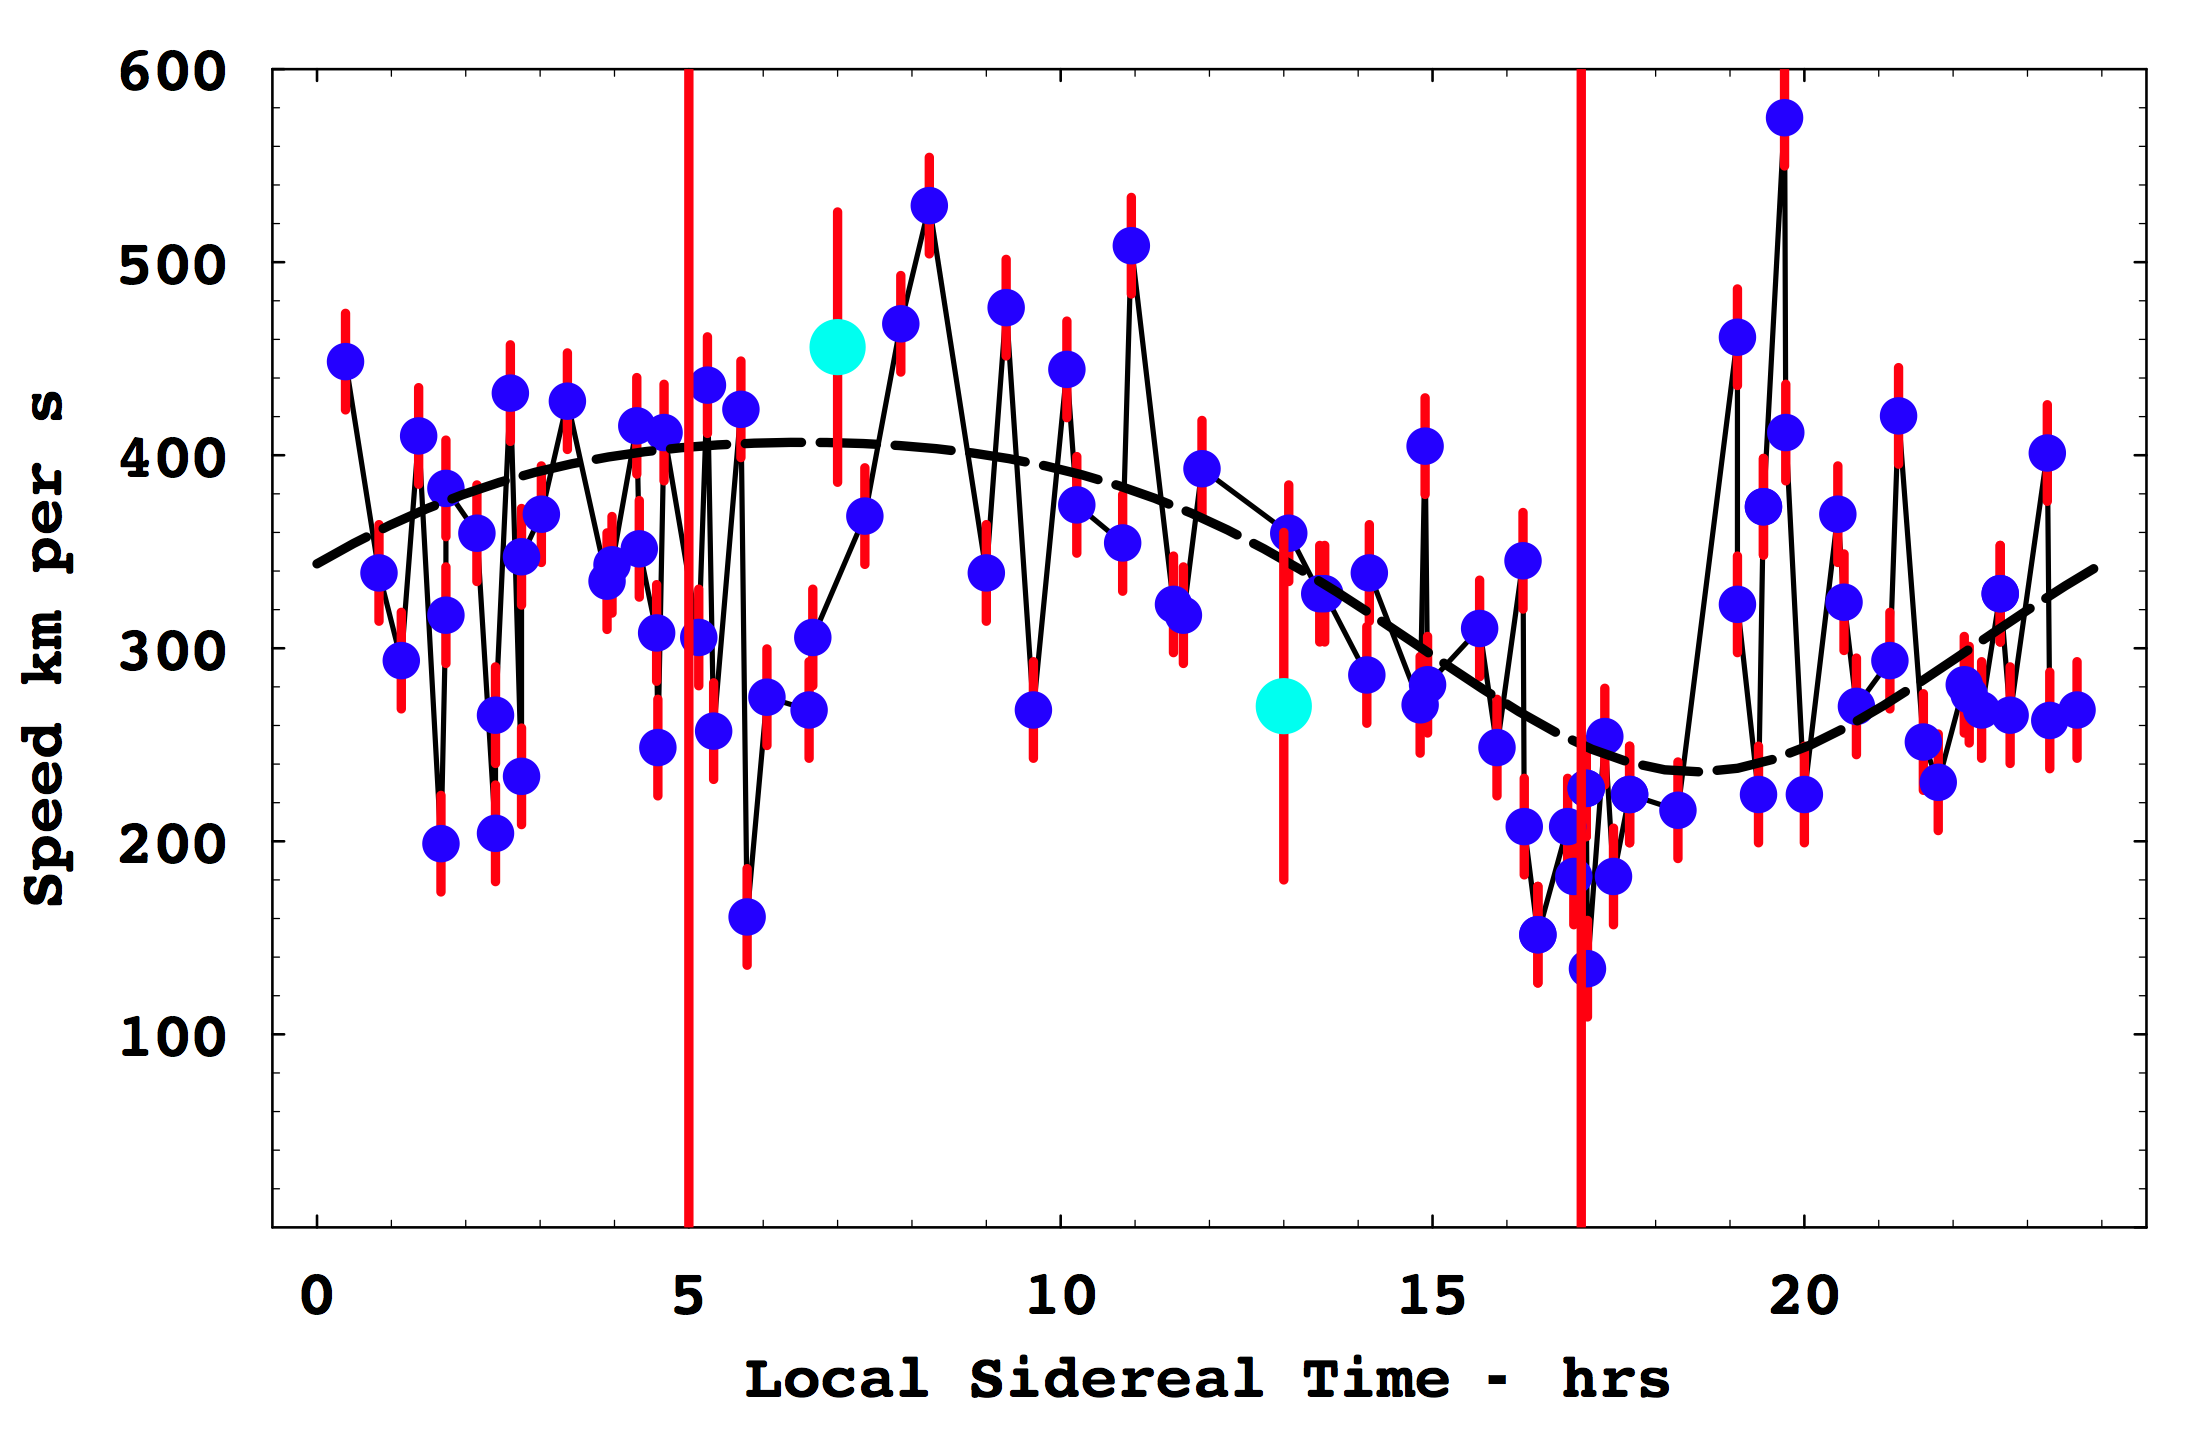
It is important that the gas-mode 2nd order in data from Michelson and Morley, 1887, and from Miller, 1925/26, be reviewed in the light of the recent experiments and flyby data. Shown in Fig.12 (top) is Miller data from September 16, 1925, Local Sidereal Time (LST) - an average of data from 20 turns of the gas-mode Michelson interferometer. Plot and data after fitting and then subtracting both the temperature drift and Hicks effects from both, leaving the expected sinusoidal form. The error bars are determined as the rms error in this fitting procedure, and show how exceptionally small were the errors, and which agree with Miller’s claim for the errors. Best result from the Michelson-Morley 1887 data - an average of 6 turns, at LST on July 11, 1887, is shown in Fig.12 (bottom). Again the rms error is remarkably small. In both cases the indicated speed is - the 3-space speed projected onto the plane of the interferometer. The angle is the azimuth of the 3-space speed projection at the particular LST. Fig.13 shows speed fluctuations from day to day significantly exceed these errors, and reveal the existence of 3-space flow turbulence - i.e gravitational waves. The data shows considerable fluctuations, from hour to hour, and also day to day, as this is a composite day. The dashed curve shows the non-fluctuating best-fit sidereal effect variation over one day, as the earth rotates, causing the projection onto the plane of the interferometer of the velocity of the average direction of the space flow to change. The predicted projected sidereal speed variation for Mt Wilson is 251 to 415 km/s, using the Casinni flyby data and the STP air refractive index of appropriate atop Mt. Wilson, and the min/max occur at approximately 5hrs and 17hrs local sidereal time (Right Ascension). For the Michelson-Morley experiment in Cleveland the predicted projected sidereal speed variation is 239 to 465 km/s. Note that the Cassini flyby in August gives a RA, close to the RA apparent in the above plot. The green data points, showing daily fluctuation bars, at and , are from the Michelson-Morley 1887 data, from averaging (excluding only the July 8 data for 7h because it has poor S/N), and with same rms error analysis. The fiducial time lines are at and . The data indicates the presence of turbulence in the 3-space flow, i.e gravitational waves, being first seen in the Michelson-Morley experiment.
13 Conclusions
The Dual RF Coaxial Cable Detector exploits the Fresnel drag anomaly in RF coaxial cables, viz the drag effect is absent in such cables, for reasons unknown, and this 1st order in detector is compact, robust and uses one clock. This anomaly now explains the operation of the Optical-Fibre - Coaxial Cable Detector, and permits a new calibration. These detectors have confirmed the absolute motion of the solar system and the gravitational wave effects seen in the earlier experiments of Michelson-Morley, Miller, DeWitte and Torr and Kolen. Most significantly these experiments agree with one another, and with the absolute motion velocity vector determined from spacecraft earth-flyby Doppler shifts. The observed significant wave/ turbulence effects reveal that the so-called “gravitational waves” are easily detectable in small-scale laboratory detectors, and are considerably larger than those predicted by GR. These effects are not detectable in vacuum-mode Michelson terrestrial interferometers, nor by their analogue vacuum-mode resonant cavity experiments.
The new Dual RF Coaxial Cable Detector permits a detailed study and characterisation of the wave effects, and with the detector having the inclination equal to the local latitude the earth rotation effect may be removed, as the detector is then parallel to the earth’s spin axis, enabling a more accurate characterisation of the wave effects. The major discovery arising from these various results is that 3-space is directly detectable and has a fractal textured structure. This and numerous other effects are consistent with the dynamical theory for this 3-space. We are seeing the emergence of fundamentally new physics, with space being a a non-geometrical dynamical system, and fractal down to the smallest scales describable by a classical velocity field, and below that by quantum foam dynamics [12]. Imperfect and incomplete is the geometrical model of space.
14 Acknowledgements
The Dual RF Coaxial Cable Detector is part of the Flinders University Gravitational Wave Detector Project. The DSO, Rb RF frequency source and coaxial cables were funded by an Australian Research Council Discovery Grant: Development and Study of a New Theory of Gravity. Special thanks to CERN for donating the phase stabilised optical fibre, and to Fiber-Span for donating the optical-electrical converters. Thanks for support to Professor Warren Lawrance, Bill Drury, Professor Igor Bray, Finn Stokes and Dr David Brotherton.
References
- [1] Cahill R.T. A New Light-Speed Anisotropy Experiment: Absolute Motion and Gravitational Waves, Progress in Physics, v. 4, 73-92, 2006.
- [2] Cahill R.T. Absolute Motion and Gravitational Wave Experiment Results, Contribution to Australian Institute of Physics National Congress, Brisbane, Paper No. 202, 2006.
- [3] Cahill R.T. and Kitto K. Michelson-Morley Experiments Revisited, Apeiron, v. 10(2), 104-117, 2003.
- [4] Cahill R.T. The Michelson and Morley 1887 Experiment and the Discovery of Absolute Motion, Progress in Physics, v. 3, 25-29, 2005.
- [5] Miller D.C. The Ether-Drift Experiment and the Determination of the Absolute Motion of the Earth, Rev. Mod. Phys., v. 5, 203-242, 1933.
- [6] Torr D.G. and Kolen P. An Experiment to Measure Relative Variations in the One-Way Velocity of Light, in Precision Measurements and Fundamental Constants II, Taylor B.N. and Phillips W.D. eds. Natl. Bur. Stand. (U.S.), Spec. Pub., 617, 675-679, 1984.
- [7] Cahill R.T. The Roland De Witte 1991 Experiment, Progress in Physics, v. 3, 60-65, 2006.
- [8] Anderson J.D., Campbell J.K., Ekelund J.E., Ellis J. and Jordan J.F. Anomalous Orbital-Energy Changes Observed during Spacecraft Flybys of Earth, Phys. Rev. Lett., v. 100, 091102, 2008.
- [9] Cahill R.T. Combining NASA/JPL One-Way Optical-fibre Light-Speed Data with Spacecraft Earth-Flyby Doppler-Shift Data to Characterise 3-Space Flow, Progress in Physics, v. 4, 50-64, 2009.
- [10] Cahill R.T. Unravelling Lorentz Covariance and the Spacetime Formalism, Progress in Physics, v. 4, 19-24, 2008.
- [11] Cahill R.T. and Stokes F. Correlated Detection of sub-mHz Gravitational Waves by Two Optical-fibre Interferometers, Progress in Physics, v. 2, 103-110, 2008.
- [12] Cahill R.T. Process Physics: From Information Theory to Quantum Space and Matter, Nova Science Pub., New York, 2005.
- [13] Cahill R.T. and Brotherton D., Experimental Investigation of the Fresnel Drag Effect in RF Coaxial Cables, Progress in Physics, v. 1, 43-48, 2011.