Post-starburst Tidal Tails in the Archetypical Ultra Luminous Infrared Galaxy Arp 22011affiliation: Based on data collected at the Subaru Telescope, which is operated by the National Astronomical Observatory of Japan.
Abstract
We present our new deep optical imaging and long-slit spectroscopy for Arp 220 that is the archetypical ULIRG in the local universe. Our sensitive H imaging has newly revealed large-scale, H absorption, i.e., post-starburst regions in this merger; one is found in the eastern superbubble and the other is in the two tidal tails that are clearly reveled in our deep optical imaging. The size of H absorption region in the eastern bubble is 5 kpc 7.5 kpc and the observed H equivalent widths are 2 Å 0.2 Å. The sizes of the northern and southern H-absorption tidal tails are 5 kpc 10 kpc and 6 kpc 20 kpc, respectively. The observed H equivalent widths range from 4 Å to 7 Å. In order to explain the presence of the two post-starburst tails, we suggest a possible multiple-merger scenario for Arp 220 in which two post-starburst disk-like structures merged into one, and then caused the two tails. This favors that Arp 220 is a multiple merging system composed of four or more galaxies, arising from a compact group of galaxies. Taking our new results into account, we discuss a star formation history in the last 1 Gyr in Arp 220.
Subject headings:
galaxies: individual (Arp 220) — galaxies: interactions — galaxies: starburst1. INTRODUCTION
Ultra luminous infrared galaxies (ULIRGs) whose infrared (8–1000 m) luminosity exceeds 1012 are the sites where extraordinarily active star formation occurs in their central regions, triggered by galaxy mergers (Sanders et al., 1988). Since such galaxies have been also found as massive, dusty galaxies at high redshift, providing substantial star formation in early universe (Le Floc’h et al., 2005), it is important to understand their physical origins unambiguously.
Originally, Sanders et al. (1988) proposed that ULIRGs come from a merger between two (gas-rich) galaxies. On one hand, multiple merger scenarios have also been proposed for the formation of ULIRGs based on their morphological and dynamical properties (Taniguchi & Shioya, 1998; Borne et al., 2000; Haan et al., 2011). Unlike well-defined, on-going merging systems such as the Antennae (NGC 4038 + NGC 4039), most of ULIRGs appear to have complicated morphological properties of so-called advanced mergers (e.g., Sanders & Mirabel 1996).
Namely, the following questions have not yet been unsettled unambiguously for the origin of ULIRGs. (1) How many galaxies were merged into one? (2) Which types of galaxies were merged into one? (3) How were their orbital parameters? Since the merging of galaxies can smear out morphological properties of original galaxies that take part in the merger, it is generally difficult to give firm answers to the above questions (e.g., Weil & Hernquist 1996; Bournald et al. 2007).
It is worthwhile noting that a major merger between two galaxies may be a site of multiple mergers because any galaxies have their satellite galaxies (Wang & White 2012 and references therein). For example, let us imagine a case of the merger between our Galaxy and M 31. Since both galaxies have two significant satellite galaxies (LMC and SMC for our Galaxy and M32 and NGC 205 for M31), this major merger includes six galaxies. Since a minor merger also gives dynamical disturbance to its host disk galaxy (e.g., Mihos & Hernquist 1996; Taniguchi et al. 1996; Bournald et al. 2007; Villabos & Helmi 2008), it seems to have a unambiguous discrimination between a major merger between two galaxies and a multiple merger. It is also worthwhile noting that numerical simulations of multiple mergers can make an Arp 220-like morphology during the course of mergers among six galaxies (Weil & Hernquist, 1996). A one-sided long tidal tail structure (e.g., Mrk 273) can also be generated by a multiple merger model (Bekki, 2001).
Among the ULIRGs in the local universe, Arp 220 is the archetypical advanced merger (Sanders et al., 1988; Joseph & Wright, 1985). Arp 220 shows two starburst events at least; one is the central super star clusters (i.e., the on-going starburst; Shaya et al. 1994; Taniguchi, Trentahm & Shioya 1998), and the other is the figure “8” shaped structure of ionized gas driven by a superwind (Heckman et al., 1987, 1990, 1996). It is also suggested that there is a hidden starburst core in the central region of Arp 220 that is obscured seriously, – 50 mag (e.g., Anantharamaiah et al. 2000; Shioya, Trentham, & Taniguchi 2001). Indeed, multi-phase star formation events in Arp 220 and other ULIRGs have been identified in more recent imaging and spectroscopic investigations (e.g., Wilson et al. 2006; Rodríguez Zaurín et al. 2008, 2009; Soto & Martin 2010). Accordingly, Arp 220 appears to have experienced a long history of episodic starbursts during the course of merging within last 1 Gyr.
This complicated star formation history in Arp 220 may come from a multiple mergers including more than two galaxies (e.g, Taniguchi & Shioya 1998; Borne et al. 2000). It is generally difficult to explore the history of such multiple mergers in an advanced merger phase. However, since Arp 220 shows the evident on-going and past starburst events noted above together with a faint pair of tidal tails, it is worthwhile investigating its star formation history in more details. For this purpose, we have carried out deep H imaging using the Subaru Telescope and a long-slit spectroscopic observation with the Keck II Telescope. Based on our new observations, we discuss a possible scenario for the star formation history in Arp 220 and re-visit a multiple merger scenario.
We use the distance of 77.6 Mpc toward Arp 220 that is estimated with both the systemic velocity of 5434 km s-1 (de Vaucouleurs et al., 1991) and a Hubble constant = 70 km s-1 Mpc-1. At this distance, 1″ corresponds to 376 pc.
2. OBSERVATIONS
2.1. Optical Imaging
In order to understand the whole star formation history in Arp 220, one efficient method is to reveal post-starburst regions (their characteristic ages are 0.2 – 1 Gyr) as well as the on-going active star forming regions (their characteristic ages are 10 Myr). For this purpose, we obtained deep H on-band and off-band frames using the Faint Object Camera And Spectrograph (FOCAS) on the Subaru Telescope on 2002 September 15 (UT). Total integration time for the on and off bands were 8400 seconds and 2400 seconds, respectively. The center wavelengths and bandwidths were 6709 Å and 85 Å and 6588 Å and 73 Å for the on and off bands, respectively. The on-band frames include stellar continuum emission and H+[N II]6548,6583 line emission, while the off-band frames include stellar continuum only.
Bias subtraction, flat-fielding, and sky subtraction were performed. Flux calibration was carried out by using SDSS spectrum (Abazajian et al., 2009) of a galaxy in the same field of view. In continuum subtraction, we took consideration into the continuum slope between the H on and off wavelengths estimated from Keck spectrum around eastern H absorption region (see Section 3). This correction was applied to the whole region of the off-band image, and reduced continuum intensity by 2 % or H equivalent width by 1.5 Å than if we assume no continuum slope correction, or flat continuum. Since the eastern H absorption region and the two tidal tails have the same color indices (Section 3), this continuum correction is reasonable. The spatial resolution of FOCAS images was 0″.7.
Deep -band frames of Arp 220 were also obtained by Subaru Prime Focus Camera (Suprime-Cam) on 2004 February 18 (UT). Bias subtraction, flat-fielding, and sky subtraction were performed. Total integration time was 4200 seconds, and the spatial resolution was 1″.0. This -band image was used to find faint tidal features around Arp 220 (see also, Koda et al. 2009).
2.2. Optical Spectroscopy
A new optical spectrum was obtained by the Low Resolution Imaging Spectrometer (LRIS: Oke et al., 1995) with the Keck II Telescope on 1997 April 16 (UT). A 900-second exposure was taken with the 600 line mm-1 grating, with a central wavelength setting of 6024 Å. The grating is blazed at 5000 Å and the dispersion is 1.28 Å pixel-1. The observed wavelength range and the spectral resolution were 4670 – 7210 Å and 6.9 Å, respectively. The 1″ slit with a length of 66″ was oriented at the position angle (PA) of 130 degree to observe both the nucleus of Arp 220 and its visual companion D (seen at SE of Arp 220) simultaneously. The spectrum was reduced by using IRAF with the standard manner, i.e., wavelength calibration, flat-fielding, and flux calibration (see Ohyama et al. 1999 for detail).
3. RESULTS
3.1. Imaging Data
In post starburst regions, massive OB stars already ceased and thus intermediate-mass stars such as A-type stars are dominant populations. Such regions are probed by strong hydrogen Balmer absorption lines (e.g., Taniguchi et al. 1996).
Figure 1 shows the continuum-subtracted, smoothed H+[N II]6548,6583 image, and the H equivalent width maps obtained by FOCAS, respectively. We detect strong H emission from the central region of Arp 220 and shell-like structures in both SE and NW directions, as already reported in the literature (Heckman et al., 1987, 1990, 1996). The strong H emission from the central region is considered to be attributed to the on-going starburst activity there. On the other hand, the shell-like structures is due to the recent-past superwind, which is a galactic-scale outflow caused by many supernovae.
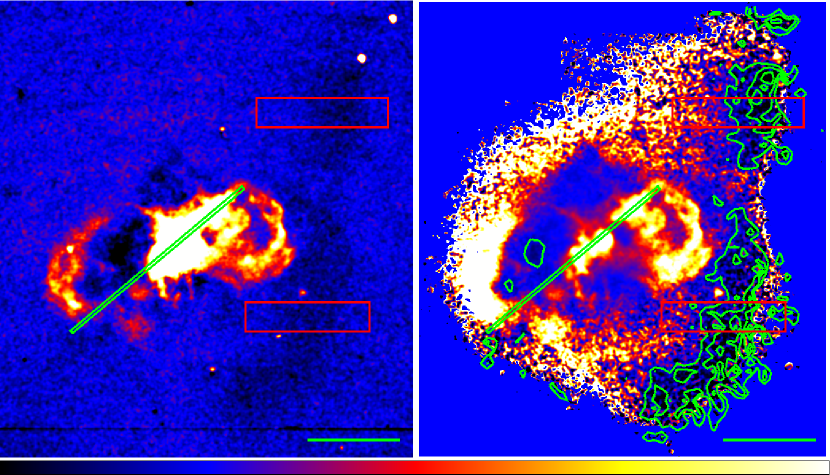
On closer inspection, we find three H absorption regions. One H absorption region is detected about 20″ east from the center, inside the eastern H bubble. The observed equivalent width of H in the center 3″ 3″ is 2.3 Å 0.15 Å (1). The size of this region is approximately 5 kpc 7.5 kpc. The other two spectacular H absorption regions appear to be associated with the two optically-faint tidal tails found in our deep -band image (see also Figure 2). The observed equivalent width of H amounts to 5 0.4 Å in total; 4 1.1 Å at the continuum flux peak, and 7 1.7 Å at the outer side of the tails (Figure 3). The sizes of the northern and southern H absorption regions are 5 kpc 10 kpc and 6 kpc 20 kpc, respectively. Since these three regions show the H absorption feature, A-type stars, or post-starburst populations, are dominant in the optical continuum without H emission sources such as OB stars.
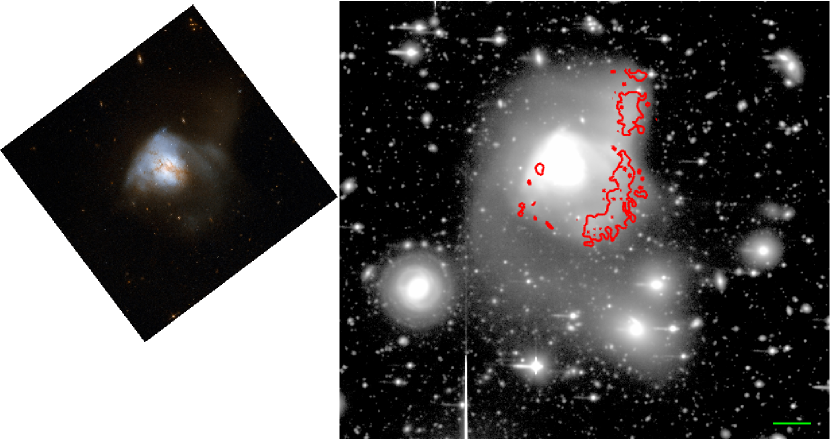
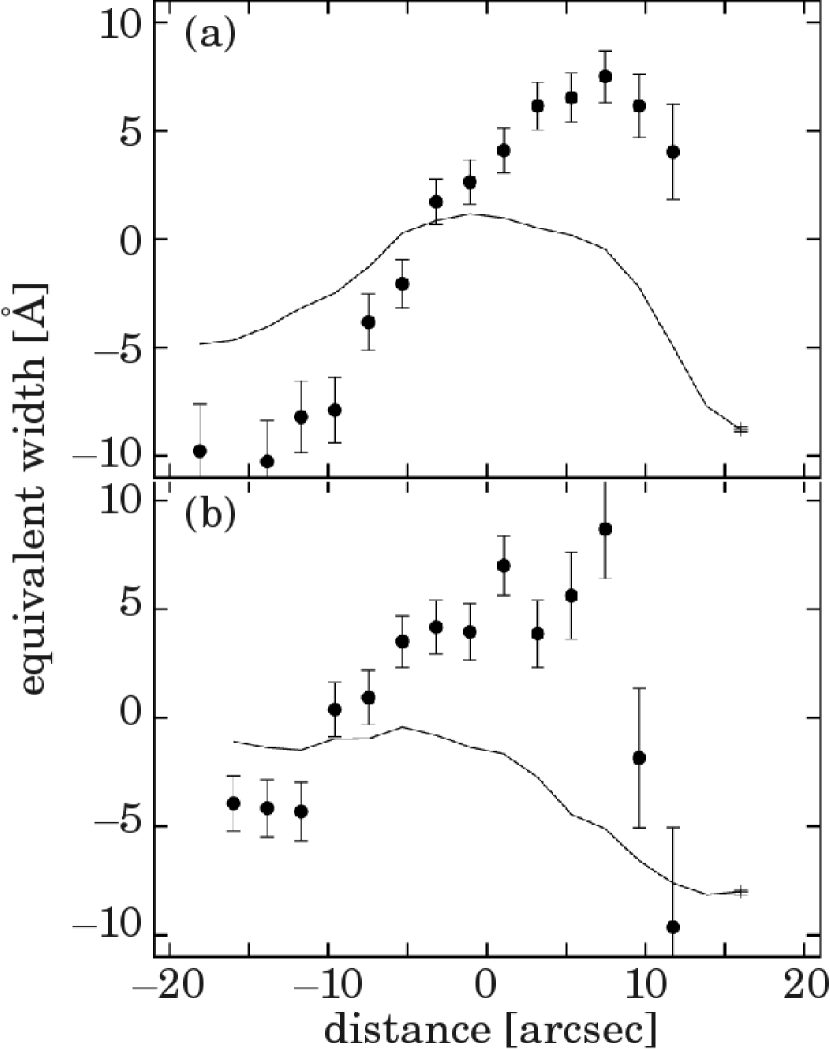
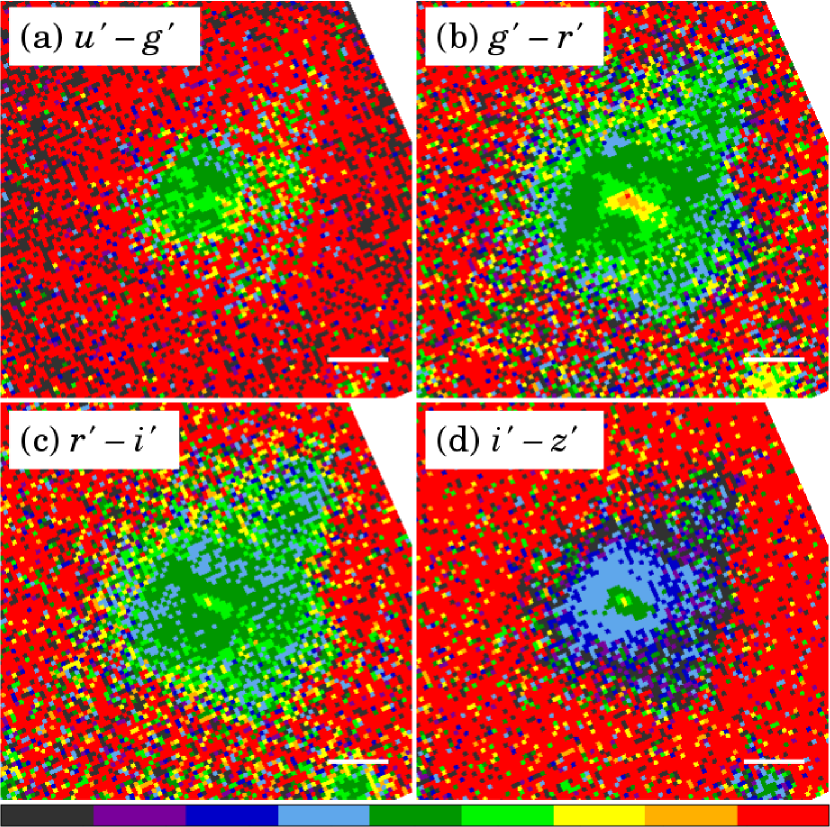
Figure 4 displays Arp 220 color index maps obtained from SDSS images (Abazajian et al., 2009). We find that the three H absorption regions have almost the same color indices. Furthermore, their color indices within several kpc except for the nuclear region are similar to those of the H absorption regions. These facts suggest that the dominant stellar population at these regions are the same, i.e., post-starburst, which is consistent with Rodríguez Zaurín et al. (2008) and Soto & Martin (2010) results.
Finally, we comment on an alternative interpretation that H absorption in the two tidal tails could be caused by the high extinction found in a number of ULIRGs (e.g., Rodríguez Zaurín et al. 2009). If the extinction is very high enough to hide on-going massive star formation, the observed optical light might be dominated by intermediate-type stars, resulting in strong H absorption with little emission line. Although such situations may occur in the central parts of ULIRGs including Arp 220 (Shioya, Trentham, & Taniguchi, 2001), it seems unlikely that such very dusty starbursts occurred in the entire regions of both the eastern bubble and the two tidal tails. Therefore, we consider that the post-starburst interpretation is a more robust idea for the observed H absorption regions in Arp 220.
3.2. Spectroscopic Data
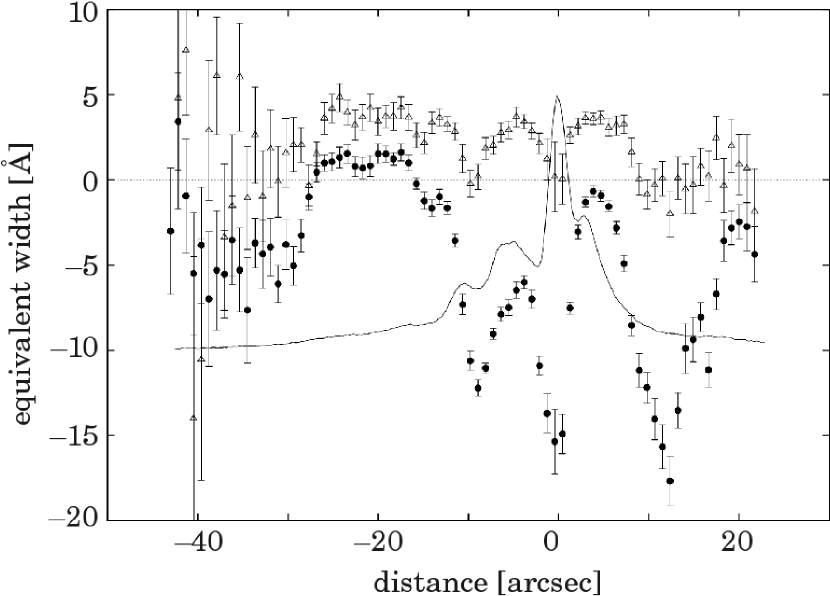
The so-called Lick index (Worthey & Ottaviani, 1997) provides a common method for calculating an equivalent width. We therefore calculated the H Lick index as a function of slit position. H equivalent width was also calculated in the same way as that of Lick index. Note that we adopt the following wavelength coverage; 6552.4 – 6564.6 Å for the on-H region, 6505.9 – 6525.44 Å and 6603.7 – 6664.9 Å for the off-H region. We chose these ranges in order to avoid the effects from [N II]6548,6583 emission from the object, other absorption lines, and sky emission.
Figure 5 represents continuum flux density and equivalent width profiles along the slit position displayed in Figure 1. The H equivalent width at the southern part of the eastern bubble is 1.5 Å, i.e., H absorption, which is consistent with FOCAS equivalent width map (Figure 3). The H equivalent width is more sensitive to post-starburst population than that of H, because the flux of the H emission line is generally about 3 times smaller than the H flux (e.g., Osterbrock & Ferland 2006). The observed H Lick index of the eastern H absorption region is 3 – 4 Å. H absorption is detected not only around eastern bubble but also in the central region of Arp 220, ″ and ″ from the center (Figure 5). This fact suggests that post-starburst populations spread to several kpc in diameter, which is consistent with the results of both Rodríguez Zaurín et al. (2008) and Soto & Martin (2010). Unfortunately, we cannot measure the H equivalent width of the west H absorption tails, because they were out of the field of view of LRIS.
4. DISCUSSION
4.1. A Multiple Merger Scenario
Based on its morphology, it is obvious that Arp 220 is now in an advanced phase of a galaxy merger (Sanders et al., 1988). For Arp 220, Taniguchi & Shioya (1998) have discussed a possibility of multiple mergers. Their argument is based on these facts that Arp 220 has two compact starburst regions and that a pair of nuclei (i.e., a pair of supermassive black holes) is necessary to initiate the so-called nuclear starburst in a merging system in either a minor or a major merger (Taniguchi & Wada, 1996). This may be a plausible idea because the starburst is intrinsically different from ordinary star formation in galactic disks (Daddi et al., 2010). The presence of multiple (at least three) OH megamaser sources can be interpreted as evidence for major mergers of four galaxies in Arp 220 (Diamond et al., 1989). However, although further observations detected multiple components, it is reminded that they do not necessarily suggest the multiple nuclei (Rovilos et al., 2003).
One interesting advantage of the multiple merger model by Taniguchi & Shioya (1998) is that they predicted the presence of a pair of counter rotating dense molecular gas disks before the actual observational detection by Sakamoto et al. (1999). Arp 220 is a very gas rich system with and a half of gas is associated with two apparent eastern and western nuclei (Scoville et al., 1997). It seems difficult to estimate orbital parameters of merging galaxies to explain all these observational results.
However, the post-starburst tidal tails revealed by our our new observations presented here suggest a possible new idea on the merging history in Arp 220. For further consideration of multiple mergers, we discuss the origin of Arp 220.
Here we focus on the origin of two post-starburst tidal tails. First, in antenna-like tidal tails, one tidal tail emanates from one colliding galaxy and thus two well-developed tidal tails are formed (Toomre & Toomre, 1972). Taking this into account, we can postulate that two post-starburst systems merged into one and then the observed two post-starburst tails were formed in Arp 220. The observed smooth distribution of H absorption features requires this scenario although small-scale star formation activity could occur in gaseous tidal tails (Barnes & Hernquist, 1992; Duc & Mirabel, 1998).
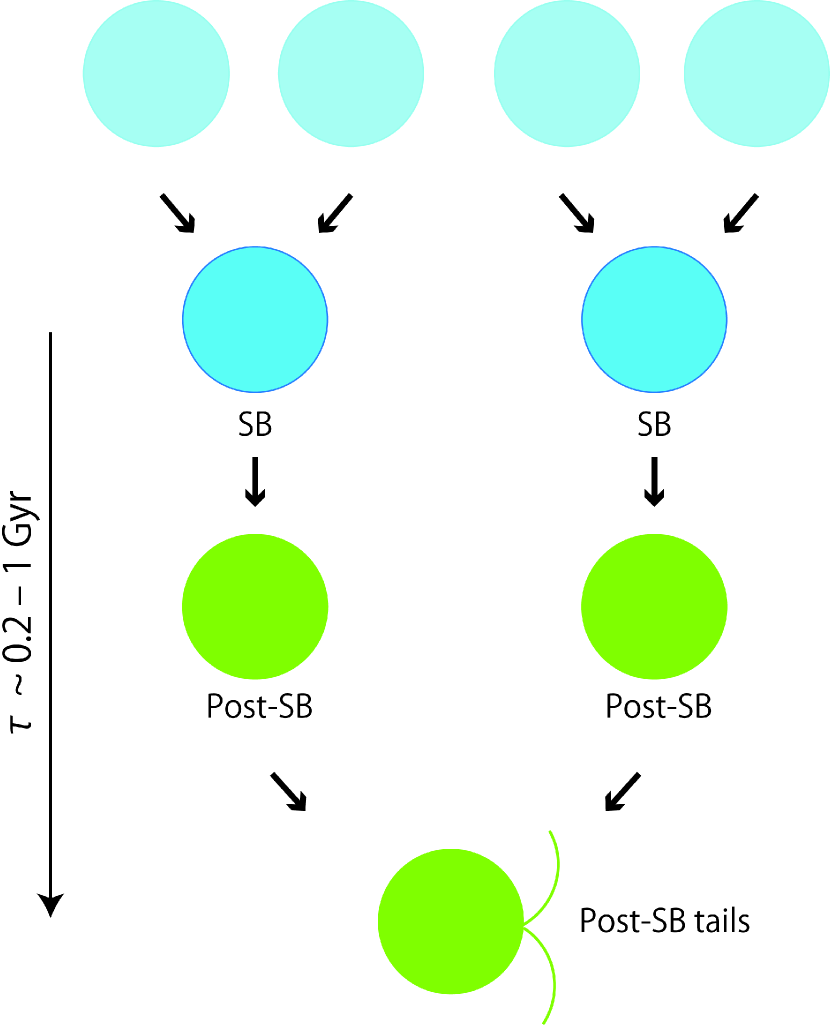
It should be noted that the size of each post-starburst system must be as large as several kpc at least, corresponding to a typical scale of disk galaxies. Let us consider a probable star formation history in a major merger between two disk galaxies. During the course of such merger evolution, enhanced star formation events occurred, being triggered by inward gas flow driven by non-axisymmetries in the galaxy disks (e.g., Di Matteo et al. 2007). However, it should be reminded that the starburst events are essentially confined in the nuclear region of each galaxy; i.e., within only a few kpc diameter area. Note that this is comparable to those of nuclear starburst regions in disk galaxies (e.g., Balzano 1983). In order to make a pair of very large-scale ( 10 kpc), post-starburst tidal tails observed in Arp 220, we need two large-scale ( several kpc) post-starburst disk-like structures. Such a structure can be made in an advanced phase of a merger between two disk galaxies; i.e., a major merger remnant. We therefore strongly suggest that the observed two tidal tails in Arp 220 need a merger between two advanced (i.e., post-starburst) merger remnants. Namely, we need four disk galaxies to explain the observed post-starburst tidal tails in Arp 220. We then conclude that Arp 220 comes not from a typical merger between two galaxies but from a multiple merger including four galaxies at least.
We estimate the travelling time of stars in the tidal tails from the merger center to the present place of tails. Given both the velocity of tidally-liberated stars as 100 km s-1 and the distance as 20 kpc, the travelling time is calculated as 200 Myr, being consistent with the lifetime of post-starburst phase (0.2 – 1 Gyr). Our scenario for the evolution of Arp 220 is summarized in Figure 6.
4.2. Star Formation History in Arp 220
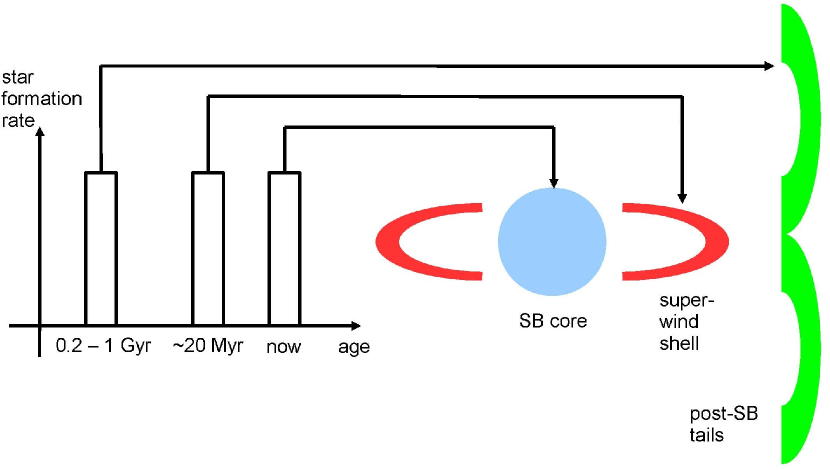
Finally, we consider a possible unified picture for various star formation events in Arp 220. As shown in Figure 1, there are two more important starburst features in Arp 220; one is the central starburst and the other is the pair of superbubble caused by the superwind activity (Heckman et al., 1987, 1990, 1996; Colina et al., 2004). The central starburst must be occurred very recently, 10 Myr ago, being the life time of massive OB stars taken into account. On the other hand, since the dynamical timescale of the observed superbubble is estimated as a few tens Myr (e.g., Heckman et al. 1990), Arp 220 experienced another starburst a few tens Myr ago. These star formation events correspond to those found in Rodríguez Zaurín et al. (2008) and Soto & Martin (2010); i.e., the young stellar population in Rodríguez Zaurín et al. (2008) and the constant-star-formation region occurring in the central kpc region of Arp 220 (Soto & Martin, 2010).
In summary, taking account of the two post-starburst tails, we propose a unified evolution model for Arp 220 as shown in Figure 7. These three starburst events could be driven by sequential multiple mergers in Arp 220.
5. CONCLUDING REMARKS
There are a significant number of compact groups of galaxies in the local universe (Hickson, 1982a, b), leading to multiple mergers. Such compact groups of galaxies are also present in rich groups and outskirt regions of cluster of galaxies at intermediate redshift (Mendel et al., 2011). Moreover, a possible multiple merging system has been also found at 1 (Schawinski et al., 2011).
ULIRGs are considered to evolve to quasars and then giant early type galaxies (elliptical or S0 galaxies). A large number of high-redshift analogs of ULIRGs, so-called submm galaxies (SMGs) have been discovered beyond 1 (e.g., Hughes et al. 1998; Barger et al. 1998; Amblard et al. 2011; Magdis et al. 2011). Although major mergers between only two galaxies have been often considered in terms of the hierarchical evolution of galaxies from high redshift to the present day, we will have to take the impact of multiple mergers into account in future consideration.
References
- Abazajian et al. (2009) Abazajian, K. N., Adelman-McCarthy, J. K., Agüeros, M. A., et al. 2009, ApJS, 182, 543
- Amblard et al. (2011) Amblard, A., Cooray, A., Serra, P., et al. 2011, Nature, 470, 510
- Anantharamaiah et al. (2000) Anantharamaiah, K. R., Viallefond, F., Mohan, N. R., Goss, W. M., & Zhao, J. H. 2000, ApJ, 537, 613
- Balzano (1983) Balzano, V. A. 1983, ApJ, 268, 602
- Barnes & Hernquist (1992) Barnes, J. E., & Hernquist, L. 1992, Nature, 360, 715
- Barger et al. (1998) Barger, A. J., Cowie, L. L., Sanders, D. B., et al. 1998, Nature, 394, 248
- Bekki (2001) Bekki, K., 2001, ApJ, 564, 189
- Borne et al. (2000) Borne, K. D., Bushouse, H., Lucas, R. A., & Colina, L. 2000, ApJ, 529, L77
- Bournald et al. (2007) Bournald, F., Jog, C., & Combes, F. 2007, A&A, 475, 1179
- Colina et al. (2004) Colina, L., Arribas, S., & Clements, D. 2004, ApJ, 602, 181
- Daddi et al. (2010) Daddi, E., et al. 2010, ApJ, 714, L118
- Diamond et al. (1989) Diamond, P. J., Norris, R. P., Baan, W. A., & Booth, R. S. 1989, ApJ, 340, l49
- de Vaucouleurs et al. (1991) de Vaucouleurs, G.,de Vaucouleurs, A., Corwin, H., et al. 1991, Third Reference Catalogue of Bright Galaxies (New York: Springer)
- Di Matteo et al. (2007) Di Matteo, P., Combes, F., Melchior, A. -L., & Semelin, B. 2007, A&A, 468, 61
- Duc & Mirabel (1998) Duc, P.-A., & Mirabel, I. F. 1998, A&A, 333, 813
- Haan et al. (2011) Haan, S., Surace, J. A., Armus, L., et al. 2011, AJ, 141, 100
- Heckman et al. (1987) Heckman, T. M., Armus, L., & Miley, G. K. 1987, AJ, 93, 276
- Heckman et al. (1990) Heckman, T. M., Armus, L., & Miley, G. K. 1990, ApJS, 74, 833
- Heckman et al. (1996) Heckman, T. M., Dahlem, M., Eales, S. A., Fabbiano, G., & Weaver, K. 1996, ApJ, 457, 616
- Hickson (1982a) Hickson, P. 1982a, ApJ, 255, 382
- Hickson (1982b) Hickson, P. 1982b, ApJ, 259, 930
- Hughes et al. (1998) Hughes, D. H., Serjeant, S., Dunlop, J., et al. 1998, Nature, 394, 241
- Joseph & Wright (1985) Joseph, R. D., & Wright, G. S. 1985, MNRAS, 214, 87
- Koda et al. (2009) Koda, J., Scoville, N., Taniguchi, Y., & Subaru COSMOS team 2009, American Astronomical Society Meeting Abstracts #214, 214, #418.03
- Le Floc’h et al. (2005) Le Floc’h, E., Papovich, C., Dole, H., et al. 2005, ApJ, 632, 169
- Magdis et al. (2011) Magdis, G. E., Elbaz, D., Hwang, H. S., Pep Team, & Hermes Team 2011, Galaxy Evolution: Infrared to Millimeter Wavelength Perspective, 446, 221
- Mendel et al. (2011) Mendel, J. T., Ellison, S. L., Simard, L., Patton, D. R., & McConnachie, A. W. 2011, MNRAS, 418, 1409
- Mihos & Hernquist (1996) Mihos, J. C., & Hernquist, L. 1996, ApJ, 464, 641
- Ohyama et al. (1999) Ohyama, Y., Taniguchi, Y., Hibbard, J. E., & Vacca, W. D. 1999, AJ, 117, 2617
- Oke et al. (1995) Oke, J. B., Cohen, J. G., Carr, M., et al. 1995, PASP, 107, 375
- Osterbrock & Ferland (2006) Osterbrock, D. E., & Ferland, G. J. 2006, Astrophysics of gaseous nebulae and active galactic nuclei, 2nd. ed. by D.E. Osterbrock a nd G.J. Ferland. Sausalito, CA: University Science Books, 2006,
- Rodríguez Zaurín et al. (2008) Rodríguez Zaurín, J., Tadhunter, C. N., & González Delgado, R. M. 2008, MNRAS, 384, 875
- Rodríguez Zaurín et al. (2009) Rodríguez Zaurín, J., Tadhunter, C. N., & González Delgado, R. M. 2009, MNRAS, 400, 1139
- Rovilos et al. (2003) Rovilos, E., Diamond, P. J., Lonsdale, C. J., Lonsdale, C. J., & Smith, H. E. 2003, MNRAS, 342, 373
- Sakamoto et al. (1999) Sakamoto, K., Scoville, N. Z., Yun, M. S., Crosas, M., Genzel, R., & Tacconi, L. J. 1999, ApJ, 514, 68
- Sanders et al. (1988) Sanders, D. B., Soifer, B. T., Elias, J. H., et al. 1988, ApJ, 325, 74
- Sanders & Mirabel (1996) Sanders, D. B., & Mirable, I. F., 1996, ARA & A 34, 749
- Schawinski et al. (2011) Schawinski, K., Urry, M., Treister, E., et al. 2011, ApJ, 743, L37
- Scoville et al. (1997) Scoville, N. Z., Yun, M. S., & Vryant, P. M. 1997, ApJ, 484, 702
- Shaya et al. (1994) Shaya, E. J., Dowling, D. M., Currie, D. G., Faber, S. M., & Groth, E. J. 1994, AJ, 107, 1675
- Shioya, Trentham, & Taniguchi (2001) Shioya, Y., Trentham, N,, & Taniguchi, Y. 2001, ApJ, 548, L29
- Soto & Martin (2010) Soto, K. T., & Martin, C. L. 2010, ApJ, 716, 332
- Taniguchi et al. (1996) Taniguchi, Y., Ohyama, Y., Yamada, T., Mouri, H., & Yoshida, M. 1996, ApJ, 467, 215
- Taniguchi & Wada (1996) Taniguchi, Y., & Wada, K. 1996, ApJ, 469, 581
- Taniguchi & Shioya (1998) Taniguchi, Y., & Shioya, Y. 1998, ApJ, 501, L167
- Taniguchi, Trentahm & Shioya (1998) Taniguchi, Y., Trentahma, N., & Shioya, Y. 1998, ApJ, 504, L79
- Toomre & Toomre (1972) Toomre, A., & Toomre, J. 1972, ApJ, 178, 623
- Villabos & Helmi (2008) Villabos, A., & Helmi, A. 2008, MNRAS, 391, 1806
- Wang & White (2012) Wang, W., & White, S. D. M. 2012, arXiv:1203.0009
- Weil & Hernquist (1996) Weil, M. L., & Hernquist, L. 1996, ApJ, 460, 101
- Wilson et al. (2006) Wilson, C. D., Harris, W. E., Longden, R., & Scoville, N. Z, 2006, ApJ, 642, 763
- Worthey & Ottaviani (1997) Worthey, G., & Ottaviani, D. L. 1997, ApJS, 111, 377