Tracing Outflows and Accretion: A Bimodal Azimuthal Dependence of Mgii Absorption
Abstract
We report a bimodality in the azimuthal angle distribution of gas around galaxies as traced by Mgii absorption: Halo gas prefers to exist near the projected galaxy major and minor axes. The bimodality is demonstrated by computing the mean azimuthal angle probability distribution function using 88 spectroscopically confirmed Mgii absorption-selected galaxies [ Å] and 35 spectroscopically confirmed non-absorbing galaxies [ Å] imaged with HST and SDSS. The azimuthal angle distribution for non-absorbers is flat, indicating no azimuthal preference for gas characterized by Å. We find that blue star-forming galaxies clearly drive the bimodality while red passive galaxies may exhibit an excess along their major axis. These results are consistent with galaxy evolution scenarios where star-forming galaxies accrete new gas, forming new stars and producing winds, while red galaxies exist passively due to reduced gas reservoirs. We further compute an azimuthal angle dependent Mgii absorption covering fraction, which is enhanced by as much as 2030% along the major and minor axes. The distribution for gas along the major axis is likely skewed toward weaker Mgii absorption than for gas along the projected minor axis. These combined results are highly suggestive that the bimodality is driven by gas accreted along the galaxy major axis and outflowing along the galaxy minor axis. Adopting these assumptions, we find that the opening angle of outflows and inflows to be and , respectively. We find the probability of detecting outflows is 60%, implying that winds are more commonly observed.
Subject headings:
galaxies: halos — galaxies: intergalactic medium — quasars: absorption lines1. Introduction
It is well established that Mgii absorption, detected in background quasar/galaxy spectra, arises from gas associated with foreground galaxies and thus provides a unique means to directly observe mechanisms by which galaxies acquire, chemically enrich, expel, and recycle their gaseous component (see Churchill, Kacprzak, & Steidel, 2005, for a review). The Mgii ion is ideal since it traces metal-enriched low-ionization gas with cm-2 (Churchill et al., 2000; Rigby, Charlton, & Churchill, 2002) and, as a result, is detected out to projected galactic radii of kpc (Kacprzak et al., 2008; Chen et al., 2010a). A significant quantity of Hi gas is probed by Mgii absorption in galaxy halos with roughly 15% of the gas residing in DLAs and 5% of the total hydrogen in stars (Kacprzak & Churchill, 2011; Ménard & Fukugita, 2012).
A large body of evidence suggests that Mgii absorption traces both outflows from star-forming galaxies (Bouché et al., 2006; Tremonti et al., 2007; Zibetti et al., 2007; Martin & Bouché, 2009; Weiner et al., 2009; Chelouche & Bowen, 2010; Nestor et al., 2011; Noterdaeme et al., 2010; Bordoloi et al., 2011; Coil et al., 2011; Rubin et al., 2010; Ménard & Fukugita, 2012; Martin et al., 2012) and accretion onto host galaxies (Steidel et al., 2002; Chen et al., 2010a; Chen et al., 2010b; Kacprzak et al., 2010a, 2011b; Stewart et al., 2011; Ribaudo et al., 2011; Kacprzak et al., 2012; Rubin et al., 2012; Martin et al., 2012). While it is clear both processes are occurring, it is difficult to disentangle which absorption systems may be uniquely associated with either process. Since outflows are presumably metal-enriched, whereas accreting material should be metal-poor, comparing the absorption-line and host galaxy metallicity provides one suitable test for discriminating winds from accretion (e.g., Ribaudo et al., 2011; Kacprzak et al., 2012, and references therein). However it is not yet feasible to perform this experiment for a large sample of galaxies.
The Mgii spatial distribution relative to their host galaxies also provides a promising test. Outflows are expected to extend along the galaxy minor axis (e.g., Strickland et al., 2004), whereas accretion would progress along filaments more planer to the galaxy (e.g., Stewart et al., 2011). Modeling the morphologies of 40 HST imaged absorbers, Kacprzak et al. (2011b) found that the rest-frame Mgii equivalent width, , is dependent on galaxy inclination, suggesting a co-planer geometry. Furthermore, the Mgii kinematics are consistent with being coupled to the galaxy angular momentum (Steidel et al., 2002; Kacprzak et al., 2010a). These results provide evidence that some Mgii absorbing gas is accreting co-planer to galaxies.
Stacking background galaxy spectra, Bordoloi et al. (2011) showed that, statistically, unresolved Mgii-doublet equivalent widths are larger along the galaxy projected minor axis than along the projected major axis within – kpc, suggesting that the strongest absorption is ejected within winds along the minor axis. Using 10 absorbers, Bouché et al. (2012) showed that Mgii absorption arises along the projected minor and major axes of the host galaxies, suggesting that Mgii is primarily detected in outflows and accretion, however, the inclusion of a control sample of non-absorbers is necessary to validate the bimodal claim. Both works were further validated by Churchill et al. (2012) who, using 65 galaxies, found that Mgii absorption arises preferentially along the galaxy major axis and then along the galaxy minor axis as increases; they also found that for Å, the galaxy inclinations and azimuthal angles with respect to the quasar sight-line are consistent with random distributions.
In view of these results, we aim to further explore the azimuthal distribution of Mgii absorption for a large sample of spectroscopically confirmed galaxies. In this Letter, we compute the mean azimuthal angle probability distribution function for galaxies hosting Å absorption and show that it is bimodal, peaking near the galaxy minor and major axes. We also show that the distribution is flat for galaxies with Å (i.e., non-absorbers). We further study this distribution in terms of galaxy colors and equivalent widths. We adopt a , , cosmology.
2. The Sample and Analysis
We compiled a sample of 88 spectroscopically confirmed Mgii absorption-selected galaxies with Å [33 from Kacprzak et al. (2011b) imaged with HST, 46 from Chen et al. (2010a) and 9 from Kacprzak et al. (2011a) imaged with SDSS] and 35 spectroscopically confirmed non-absorbers with Å [21 from Churchill et al. (2012) imaged with HST, 14 from Chen et al. (2010a) imaged with SDSS] having () and kpc ( kpc). The galaxies were selected to be isolated; group and double galaxies are not included. The Å cut maximizes the number of absorbers, while retaining a significant number of non-absorbers.
Galaxy AB magnitudes and colors were determined following the methods of Nielsen, Churchill, & Kacprzak (2012). Rest-frame or were determined from the measured apparent magnitudes. When only one color was measured, we applied a conversion determined from a linear least-squares fit to the average colors from galaxy spectral energy distribution templates of Mannucci et al. (2001). We obtained rest-frame colors for all but one galaxy.
For this work, all galaxy morphological properties were obtained using GIM2D (Simard et al., 2002). 56 galaxies were imaged with HST/WFPC2, for which we adopt the morphologies and orientations measured by Kacprzak et al. (2011b) and Churchill et al. (2012). For the Kacprzak et al. (2011a) galaxies imaged with SDSS, we adopt the GIM2D morphologies and orientations measured by Kacprzak et al. (2011a) and Bouché et al. (2012).
The SDSS galaxies taken from Chen et al. (2010a) have a median redshift of . Given the short SDSS image exposure times and the high redshifts, we studied the reliability of the GIM2D models. We identified 13 SDSS galaxies that had also been imaged with HST from our previous work (). All SDSS galaxies in our sample are resolved with 20 pixels at above the background in the -band. Using the SDSS -band images, we computed azimuthal angles using GIM2D and then also from the isophotes using Source Extractor (Bertin & Arnouts, 1996). In order to minimize the number of GIM2D free parameters, we fitted the data using an exponential disk only, with zero bulge contribution.
We found that both the GIM2D and isophotal azimuthal angles of the SDSS galaxies are consistent with the GIM2D azimuthal angles of the HST galaxies (within uncertainties of the HST values). In general, the errors on the GIM2D SDSS values are a factor of a few larger, whereas it is difficult to quantify uncertainties for the isophotal values. Thus, we modeled the SDSS -band imaged galaxies as an exponential disk with GIM2D, applying the modeling prescription of Kacprzak et al. (2011a).
We modeled all galaxy morphological types since 86% of early-types have regular stellar rotation (14% exhibit slow rotation), spanning the full range of apparent ellipticities, with 90% being kinematically and photometrically aligned (see Emsellem et al., 2011; Krajnović et al., 2011).
We adopt the convention of the azimuthal angle to be along the galaxy major axis and to be along the galaxy minor axis.
Direct binning of the azimuthal angles, the approach taken by Bouché et al. (2012), applies only when the measured uncertainties are smaller than the bin size. Further complications arise when the uncertainties are asymmetric, as is the case for GIM2D model parameters. Here we take a different approach: we represent the measured azimuthal angles and their uncertainties as univariate asymmetric Gaussians (see Kato, Omachi, & Aso, 2002), thus creating an azimuthal angle probability distribution function (PDF) for each galaxy111PDFs using the quadratic model of Barlow (2003) produce similar results, however their PDFs contain large unrealistic spikes when the uncertainties are small.. From the continuous azimuthal PDFs, we then compute the mean PDF as a function of . The mean PDF represents the probability of detecting Mgii absorption at a given . This technique provides higher weight per azimuthal angle bin for galaxies with well determined . However, even the less robustly modeled galaxies provide useful information; the method is equivalent to stacking low signal-to-noise spectra or images to search for a coherent signal.
3. The Bimodal Azimuthal Distribution
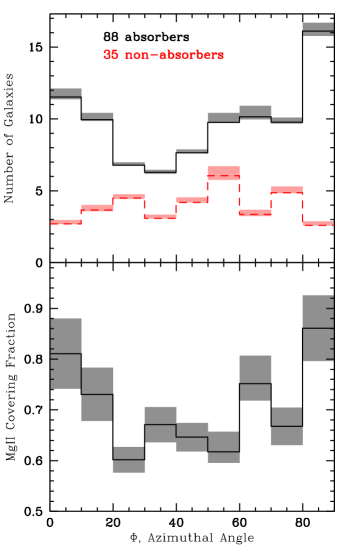
In Figure 1, we present the binned mean azimuthal angle PDF for the 88 absorbing and 35 non-absorbing galaxies. The binned PDFs have been normalized to the total number of galaxies in each sub-sample. The shaded regions about each bin are the deviations produced by a jackknife analysis in which we randomly removed 10% of the sample for a million permutations.
The non-absorbers exhibit a relatively flat distribution, as expected for random , and the fluctuations are consistent with Poisson noise. This result confirms the work of Churchill et al. (2012), who showed that the azimuthal angle distribution is random for Å.
The absorbing galaxies exhibit a bimodal distribution, with one peak corresponding to the background quasars probing the galaxy projected major axis and a second, higher and broader peak, when the galaxy is probed along the projected minor axis. The shape of the mean PDF indicates that Mgii absorbing gas is preferentially located along the projected major and minor axes of galaxies. Our result confirms the innovatory work of Bouché et al. (2012) based upon 10 galaxies. A plausible scenario is that wind/outflow gas is distributed about the galaxy minor axis with relatively high frequency, whereas accreting/infalling gas is frequently found in a co-planer geometry. For the remainder of the discussion, we refer to major axis absorption as infalling or accreting gas and to the minor axis absorption as outflowing or wind gas.
We further divided our sample of absorbing galaxies into two impact parameter sub-samples, those with kpc and kpc, and found that the bimodal shape of the mean PDF is well preserved for both impact parameter sub-samples. This implies that outflowing and accreting gas maintain their major and minor axis orientation preferences, respectively, far out into the halo.
The width of each peak in the mean PDF provides rough constraints on the geometry of outflowing and inflowing Mgii gas. The peak at suggests that accreting gas is found within of the galaxy plane. For , the peak is initially narrow, suggesting the majority of galaxies expel gas within of their minor axis. The much broader tail of the peak suggests that the opening angle of outflowing gas may be as large as , but also the frequency at which this gas is detected decreases for larger opening angles. Our estimated outflow opening angle is consistent with other published values determined using different techniques (e.g., Walter et al., 2002; Martin et al., 2012). The ratio of the area between the outflowing and infalling gas, bifurcated at , suggests that % of Mgii absorbing gas is outflowing.
In Figure 1, we plot the Mgii gas covering fraction, which is the ratio of the number of absorbers to the sum of absorbers and non-absorbers in each azimuthal bin. This first presentation of the covering fraction as a function of azimuthal angle shows a peak at 0.8–0.9 along the projected minor axis, a decrease of 20–30% at intermediate , and an increase again toward the projected major axis. The mean covering fraction of our sample, 72%, is consistent with previous results (e.g., Kacprzak et al., 2008; Chen et al., 2010a).
 |
 |
3.1. Colors, Equivalent Widths, and
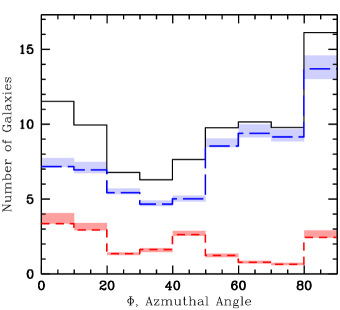
We separated the sample of absorbers into early-type and late-type galaxies based on their rest-frame colors. Following Chen et al. (2010a), we adopted the color cut to represent late-type (blue) galaxies and to represent early-type (red) galaxies. In Figure 2, we present the mean azimuthal angle PDF broken down by galaxy color. The early-type galaxies exhibit a relatively flat distribution with fluctuations across bins. However, the elevated frequency at is suggestive that gas is accreted along the major axis, which may provide the cool gas reservoirs observed around early-type galaxies (e.g., Grossi et al., 2009). The late-type galaxies clearly dominate the overall bimodal distribution. This result is intuitive if we speculate that red galaxies have significantly less accreting gas, and therefore little fuel for star formation, resulting in no outflowing gas. For blue galaxies, the accretion is higher, providing fuel for star formation that then produces outflows. We also split the absorber sample by galaxy color to yield equal numbers of red and blue galaxies in each sub-sample; the same trend appears. The azimuthal bimodality of blue galaxies and the flat distribution of red galaxies is consistent with the picture in which blue star-forming galaxies exhibit outflows due to accreted gas fueling star formation.
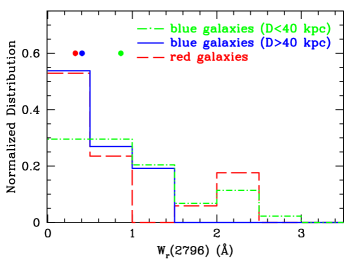
One might argue that red galaxies may have a preference for weaker absorption (see Zibetti et al., 2007; Bordoloi et al., 2011). We thus investigated whether the distribution depends on galaxy color and . In Figure 3, we show the area-normalized distribution of for red galaxies and for blue galaxies with kpc and kpc (we have too few red galaxies to separate them into impact parameter bins). The blue galaxies at smaller have a higher optimally weighted mean than blue galaxies at larger . This is consistent with the well-known anti-correlation between Mgii equivalent width and impact parameter (cf., Nielsen, Churchill, & Kacprzak, 2012, and references therein). The sub-sample of red galaxies has a mean consistent with the blue galaxies at larger .
Interestingly, Figure 3 shows a paucity of Å absorption at smaller for blue galaxies compared to both blue galaxies at larger and to all red galaxies. Also, note the paucity of Å absorption at larger for blue galaxies as compared to both blue galaxies at smaller and to all red galaxies. However, a KS test yields that the distribution of blue galaxies at smaller are statistically consistent with the distributions of both the red galaxies and the blue galaxies at larger (2.0 , a high significance level is difficult to achieve with small number statistics).
The suggested weaker absorption associated with red galaxies and with blue galaxies at larger in our sample is consistent with the findings of Bordoloi et al. (2011), who interpret this as winds extending out to projected distances of – kpc. However, the bimodality in the azimuthal distribution is present for our kpc absorber sample, suggesting winds persist beyond kpc, but with smaller indicating that the wind gas thins out at larger .
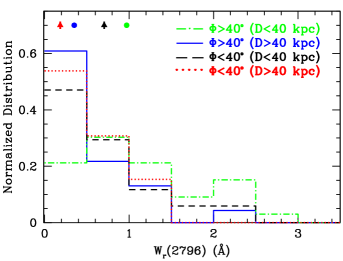
We further investigated whether the distribution of differs for infalling gas or outflowing gas by splitting the kpc and kpc absorbers into the two azimuthal bins, for inflowing gas and for outflowing gas. The value is the point of inflection in the mean azimuthal angle PDF. In Figure 3, we present the area-normalized distributions. For , the mean differ by a factor of 3.3 for the smaller and larger sub-samples. Similarly, for , the mean differ by a factor of 3.8 for the smaller and larger sub-samples. The distribution for outflowing gas at smaller is characterized by a paucity of Å absorption and a higher abundance of Å absorption, whereas the distribution for outflowing gas at larger is characterized by an abundance of Å absorption and a paucity of Å absorption. A KS test yields that the populations differ at the significance level.
Comparing the kpc distributions for wind versus accreting gas, we note a similar trend; at smaller impact parameters, accreting gas exhibits a higher abundance of Å absorption and a paucity of Å absorption. KS tests yield that the outflowing gas with and kpc differs from the inflowing gas with and kpc at the significance level. Qualitatively, these combined results may imply that either there is less column density and/or velocity spread of gas in projection along the galaxy major axis than along the minor axis, and/or, the gas may be more metal-enriched along the galaxy minor axis than along the galaxy major axis. These trends would be expected for the accretion/wind scenario we have described.
4. Conclusion
We have demonstrated that the distribution of Mgii absorption around galaxies exhibits an azimuthal angle bimodality when compared to non-absorbing galaxies, whereby Mgii absorption is preferred near the projected major and minor axes. Outflows and accretion likely extend beyond 40 kpc, but with smaller mean . Furthermore, the blue star-forming galaxies drive the bimodality, suggesting that the accretion of gas drives star-formation that produce outflows. Red galaxies may exhibit some gas accretion along the major axis. Under these assumptions, we compute opening angles of outflows and inflows to be and , respectively.
In addition, the data suggest that star-forming galaxies at low impact parameters exhibit higher mean than red galaxies and star-forming galaxies with larger impact parameters. Also, the distribution for the infalling gas along the major axis exhibits a smaller mean than outflowing gas along the minor axis. This could result from less gas being probed along the major axis than the minor axis, less velocity structures/dispersions expected for winds, or higher metal enrichment along the minor axis, as expected for wind driven material. The probability of detecting outflows is 60%, implying that winds are more commonly observed, likely because the opening angle of outflows is 2.5 times larger than for accreting gas.
The data paint a picture that is consistent with the general idea of how the buildup and evolution of galaxies occurs as well as how galaxies enrich their gaseous halos. Our results signify that additional HST imaging of absorbing and non-absorbing galaxies will substantially increase our understanding of galactic scale feedback and accretion of intergalactic gas.
References
- Barlow (2003) Barlow, R. 2003, arXiv:physics/0306138
- Barton & Cooke (2009) Barton, E. J., & Cooke, J. 2009, AJ, 138, 1817
- Bertin & Arnouts (1996) Bertin, E., & Arnouts, S. 1996, A&AS, 117, 393
- Bordoloi et al. (2011) Bordoloi, R., Lilly, S. J., Knobel, C., et al. 2011, ApJ, 743, 10
- Bouché et al. (2012) Bouché, N., Hohensee, W., Vargas, R., Kacprzak, G. G., Martin, C. L., Cooke, J., & Churchill, C. W. 2012, MNRAS, in press (arXiv1110.5877)
- Bouché et al. (2006) Bouché, N., Murphy, M. T., Péroux, C., Csabai, I. & Wild. V. 2006 MNRAS, 371, 495
- Chelouche & Bowen (2010) Chelouche, D., & Bowen, D. V. 2010, ApJ, 722, 1821
- Chen et al. (2010a) Chen, H.-W., Helsby, J. E., Gauthier, J.-R., Shectman, S. A., Thompson, I. B., & Tinker, J. L. 2010a, ApJ, 714, 1521
- Chen et al. (2010b) Chen, H.-W., Wild, V., Tinker, J. L., et al. 2010b, ApJ, 724, L176
- Churchill, Kacprzak, & Steidel (2005) Churchill, C. W., Kacprzak, G. G., & Steidel, C. C. 2005, in Probing Galaxies through Quasar Absorption Lines, IAU 199 Proceedings, eds. P. R. Williams, C.–G. Shu, & B. Ménard (Cambridge: Cambridge University Press), p. 24
- Churchill et al. (2012) Churchill, C. W., Kacprzak, G. G., Nielsen, N. M., Steidel, C. C., & Murphy, M. T. 2012, ApJ, submitted
- Churchill et al. (2000) Churchill, C. W., Mellon, R. R., Charlton, J. C., Jannuzi, B. T., Kirhakos, S., Steidel, C. C., & Schneider, D. P. 2000, ApJS, 130, 91
- Coil et al. (2011) Coil, A. L., Weiner, B. J., Holz, D. E., et al. 2011, ApJ, 743, 46
- Emsellem et al. (2011) Emsellem, E., Cappellari, M., Krajnović, D., et al. 2011, MNRAS, 414, 888
- Grossi et al. (2009) Grossi, M., di Serego Alighieri, S., Giovanardi, C., et al. 2009, A&A, 498, 407
- Kacprzak & Churchill (2011) Kacprzak, G. G., & Churchill, C. W. 2011c, ApJ, 743, L34
- Kacprzak et al. (2011a) Kacprzak, G. G., Churchill, C. W., Barton, E. J., & Cooke, J. 2011a, ApJ, 733, 105
- Kacprzak et al. (2010a) Kacprzak, G. G., Churchill, C. W., Ceverino, D., Steidel, C. C., Klypin, A., & Murphy, M. T. 2010a, ApJ, 711, 533
- Kacprzak et al. (2011b) Kacprzak, G. G., Churchill, C. W., Evans, J. L., Murphy, M. T., & Steidel, C. C. 2011b, MNRAS, 416, 3118
- Kacprzak et al. (2010b) Kacprzak, G. G., Murphy, M. T., & Churchill, C. W. 2010b, MNRAS, 406, 445
- Kacprzak et al. (2008) Kacprzak, G. G., Churchill, C. W., Steidel, C. C., & Murphy, M. T. 2008, AJ, 135, 922
- Kacprzak et al. (2012) Kacprzak, G. G., Churchill, C. W., Steidel, C. C., Spitler, L. R., & Holtzman, J. A. 2012, MNRAS, submitted
- Kato, Omachi, & Aso (2002) Kato, T., Omachi, S., & Aso, H. 2002, Lect. Notes Comput. Sci. 2396, 405
- Krajnović et al. (2011) Krajnović, D., Emsellem, E., Cappellari, M., et al. 2011, MNRAS, 414, 2923
- Mannucci et al. (2001) Mannucci, F., Basile, F., Poggianti, B. M., et al. 2001, MNRAS, 326, 745
- Martin & Bouché (2009) Martin, C. L., & Bouché, N. 2009, ApJ, 703, 1394
- Martin et al. (2012) Martin, C. L., Shapley, A. E., Coil, A. L., et al. 2012, arXiv:1206.5552
- Ménard & Chelouche (2009) Ménard, B., & Chelouche, D. 2009, MNRAS, 393, 808
- Ménard & Fukugita (2012) Ménard, B., & Fukugita, M. 2012, arXiv:1204.1978
- Nestor et al. (2011) Nestor, D. B., Johnson, B. D., Wild, V., et al. 2011, MNRAS, 412, 1559
- Nielsen, Churchill, & Kacprzak (2012) Nielsen, N. M., Churchill, C. W., & Kacprzak, G. G. 2012, ApJ, in prep
- Noterdaeme et al. (2010) Noterdaeme, P., Srianand, R., & Mohan, V. 2010, MNRAS, 403, 906
- Ribaudo et al. (2011) Ribaudo, J., Lehner, N., Howk, J. C., et al. 2011, ApJ, 743, 207
- Rigby, Charlton, & Churchill (2002) Rigby, J. R., Charlton, J. C., & Churchill, C. W. 2002, ApJ, 565, 743
- Rubin et al. (2012) Rubin, K. H. R., Prochaska, J. X., Koo, D. C., & Phillips, A. C. 2012, ApJ, 747, L26
- Rubin et al. (2010) Rubin, K. H. R., Weiner, B. J., Koo, D. C., et al. 2010, ApJ, 719, 1503
- Simard et al. (2002) Simard, L., Willmer, C. N. A., Vogt, N. P., Sarajedini, V. L., Philips, A. C., Weiner, B. J., Koo, D. C., Im, M., Illingworth, G. D., & Faber, S. M. 2002, ApJS, 142, 1
- Steidel et al. (2002) Steidel, C. C., Kollmeier, J. A., Shapely, A. E., Churchill, C. W., Dickinson, M., & Pettini, M. 2002, ApJ, 570, 526
- Stewart et al. (2011) Stewart, K. R., Kaufmann, T., Bullock, J. S., et al. 2011, ApJ, 738, 39
- Strickland et al. (2004) Strickland, D. K., Heckman, T. M., Colbert, E. J. M., Hoopes, C. G., & Weaver, K. A. 2004, ApJS, 151, 193
- Tremonti et al. (2007) Tremonti, C. A., Moustakas, J., & Diamond-Stanic, A. M. 2007, ApJL, 663, L77
- Walter et al. (2002) Walter, F., Weiss, A., & Scoville, N. 2002, ApJ, 580, L21
- Weiner et al. (2009) Weiner, B. J., et al. 2009, ApJ, 692, 187
- Zibetti et al. (2007) Zibetti, S., Ménard, B., Nestor, D. B., Quider, A. M., Rao, S. M., & Turnshek, D. A. 2007, ApJ, 658, 161