The Chandra View of NGC 4178: The Lowest Mass Black Hole in a Bulgeless Disk Galaxy?
Abstract
Using high resolution Chandra data, we report the presence of a weak X-ray point source coincident with the nucleus of NGC 4178, a late-type bulgeless disk galaxy known to have high ionization mid-infrared (mid-IR) lines typically associated with active galactic nuclei (AGNs). Although the faintness of this source precludes a direct spectral analysis, we are able to infer its basic spectral properties using hardness ratios. X-ray modeling, combined with the nuclear mid-IR characteristics, suggests that NGC 4178 may host a highly absorbed AGN accreting at a high rate with a bolometric luminosity on order of ergs s-1. The black hole mass estimate, based on our Chandra data and archival VLA data using the most recent fundamental plane relations is M☉, possibly the lowest mass nuclear black hole currently known. There are also three off-nuclear sources, two with a similar brightness to the nuclear source at and from the center. As with the nuclear source, hardness ratios are used to estimate spectra for these two sources, and both are consistent with a simple power-law model with absorption. These two sources have X-ray luminosities of the order of ergs s-1, which place them at the threshold between X-ray binaries and ultra-luminous X-ray sources (ULXs). The third off-nuclear source, located from the center, is the brightest source detected, with an X-ray luminosity of ergs s-1. Its spectrum is well-fit with an absorbed power law model, suggesting that it is a ULX. We also fit its spectrum with the Bulk Motion Comptonization (BMC) model and suggest that this source is consistent with an intermediate-mass black hole (IMBH) of mass M☉.
Subject headings:
Galaxies: active — Galaxies: spiral — X-rays: Galaxies — Infrared: Galaxies — Black hole physics1. Introduction
There is mounting evidence that a significant fraction of supermassive black holes (SMBHs) reside in late-type galaxies, and that a classical bulge is not a requirement for a SMBH to form and grow (Filippenko & Ho, 2003; Barth et al., 2004; Greene & Ho, 2004, 2007; Satyapal et al., 2007; Dewangen et al., 2008; Ghosh et al., 2008; Mathur et al., 2008; Satyapal et al., 2008; Shields et al., 2008; Barth et al., 2009; Desroches & Ho, 2009; Gliozzi et al., 2009; Satyapal et al., 2009; Jiang et al., 2011a, b; McAlpine et al., 2011). In most late-type galaxies that host an AGN, however, the galaxies have a pseudobulge component, characterized by an exponential surface brightness profile. And while classical bulges are believed to form through mergers, pseudobulges are thought to form through secular processes (Kormendy & Kennicutt, 2004). Of the late-type, AGN-hosting galaxies, bulgeless (no evidence even for a pseudobulge) galaxies are by far the rarest. To date, there are only three such bulgeless disk galaxies that are confirmed to host SMBHs: NGC 4395 (Filippenko & Ho, 2003; Shih et al., 2003; Peterson et al., 2005), NGC 1042 (Shields et al., 2008), and NGC 3621 (Satyapal et al., 2007; Barth et al., 2009; Gliozzi et al., 2009; Satyapal et al., 2009). While very large SMBHs ( M☉) likely form through galaxy mergers (e.g. Kauffmann & Haehnelt, 2000), leading to a tight correlation between the black hole mass, , and the host galaxy’s bulge velocity dispersion (Gebhardt et al., 2000; Ferrarese & Merritt, 2000; Haehnelt & Kauffmann, 2002, e.g.), it is still unclear how SMBHs form and grow in bulgeless galaxies. Central to this question is how SMBHs affect, or are affected by, their host galaxy properties. It has already been shown that the presence and properties of SMBHs do not correlate with galaxy disks or pseudobulges (e.g. Kormendy et al., 2011). Interestingly, however, all three bulgeless disk galaxies with SMBHs have nuclear star clusters (NSCs), and there is growing evidence that suggests that the mass of SMBHs and NSCs may be correlated in galaxies that possess both (e.g. Seth et al., 2008; Graham & Spitler, 2009).
Given their rarity, determining the properties of SMBHs in bulgeless disk galaxies is crucial to our understanding of the low end of the SMBH mass function and its relation to host galaxies. Observationally, the only viable method for finding SMBHs in bulgeless galaxies is through the search for AGNs. Since bulgeless galaxies are typically dusty, star-forming galaxies, a putative AGN is likely to be missed by optical surveys. X-ray observations are the ideal tool to search for AGNs in such galaxies since X-rays are generally only produced in the inner nuclear regions of an AGN, and hard X-rays are not substantially affected by absorption.
The goal of this paper is to investigate the X-ray properties of the putative SMBH that lurks at the center of NGC 4178, a bulgeless disk galaxy that was recently found to have prominent mid-IR [NeV] emission associated with the nucleus (Satyapal et al., 2009). While the [NeV] emission strongly suggests the presence of an AGN, the size of the Spitzer InfraRed Spectrograph (IRS) slit (, at 14.3 µm) precludes us from confirming the nuclear origin of the emission. Thus, the presence of a significant X-ray point source counterpart in high-resolution Chandra data would provide a confirmation of a nuclear SMBH, as X-ray emission associated with starburst activity is generally extended (e.g. Dudik et al., 2005; González-Martín et al., 2006; Flohic et al., 2006). If it does have a SMBH, NGC 4178 will be only the fourth known truly bulgeless disk galaxy with a SMBH.
NGC 4178 is a highly-inclined (), SB(rs)dm galaxy (de Vaucouleurs et al., 1991) located within the Virgo Cluster at a distance of 16.8 Mpc (Tully & Shaya, 1984). Based on its nuclear optical spectrum, it is classified as having an HII nucleus (Ho, Filippenko, & Sargent, 1997), and contains an NSC of M☉ (Böker et al., 1999; Satyapal et al., 2009). Other than some asymmetric, locally enhanced H emission near the outer parts of the disk, the H distribution of NGC 4178 is typical of that found in star-forming galaxies (Koopmann & Kenney, 2004). The HI distribution is more extended than the optical part of the galaxy and shows no evidence of interactions (Cayatte et al., 1990). Apart from our previous Spitzer observations, there is no evidence for an AGN in this galaxy. With these considerations, the presence of a SMBH in this galaxy is highly unexpected.
This paper is structured as follows. In §2, we describe the Chandra observations and data reduction, as well as archival VLA data. We follow with a description of our results, including X-ray spectral modeling in §3. In §4, we discuss constraints on the nuclear black hole using the bolometric luminosity by presenting an updated correlation. We compute the Eddington mass and compare our findings with mass estimates from other methods. In §5, we compare our results to other bulgeless disk galaxies and give a summary and our main conclusions in §6.
2. Observations and Data Reduction
2.1. Chandra Data
We observed NGC 4178 with Chandra ACIS-S for 36 ks on 2011 February 19. The data were processed using CIAO v. 4.3 and we retained only events in the energy range keV. We also checked that no background flaring events occurred during the observation.
We used the XSPEC v. 12.7.0 software package (Arnaud, 1996; Dorman & Arnaud, 2001) for the spectral analysis. For the bright off-nuclear source, we re-binned the spectrum in order to contain at least 15 counts per channel in order to use the statistic. To compute the error (90% confidence) on the flux, we used the cflux model component available in XSPEC as a means to estimate fluxes and errors due to model components (Arnaud et al., 2012). For the other sources where low counts ( counts) prevented a direct spectral fit, we employed X-ray hardness ratios as a rough estimator of spectral state. The hardness ratio we use is defined as:
2.2. Archival VLA data
To search for and constrain the level of radio emission from the detected Chandra X-ray sources in NGC 4178, we utilized archival Very Large Array (VLA)111The National Radio Astronomy Observatory is a facility of the National Science Foundation operated under cooperative agreement by Associated Universities, Inc. data. The highest angular resolution VLA dataset available was a 560 sec snapshot obtained in B-array at 4.9 GHz ( beam; program AS314) on Feb 1, 1988, and published by Saikia et al. (1994). We used AIPS to calibrate and edit the data using standard procedures. A final image with beam dimensions (position angle = ) was produced with the IMAGR task using natural weighting (ROBUST weighting = 2) and 1000 CLEAN iterations.
All coordinates listed in this paper refer to the J2000 epoch.
3. Results
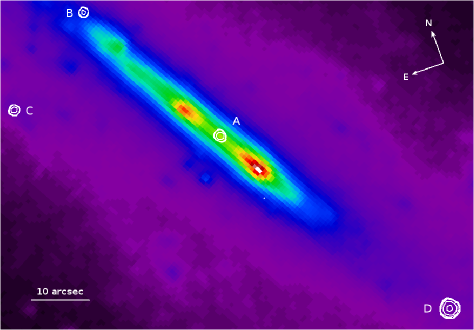
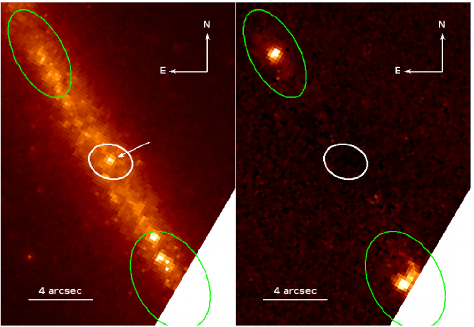
As can be seen in Figure 1, Chandra clearly detects a nuclear X-ray source (source A), which appears to be situated symmetrically between two nearly mirrored infrared lobes and is located at RA=, DEC=. Centroid analysis reveals that the infrared lobes are at the same distance from the nuclear source, about 7.8′′, corresponding to a distance of 1.3 kpc at the distance of NGC 4178. These infrared lobes are likely associated with star formation regions, known from H studies to be associated with, and confined to, the bar (e.g. Martin & Kennicutt, 2001). This is supported by the presence of Pa- emission coincident with these lobes (Figure 2). Two weaker off-nuclear sources (B and C) are located at RA=, DEC= 32′′ and RA=, DEC=, (5.2 kpc) and 36′′ (5.9 kpc) from the nuclear source, respectively. A third, brighter off-nuclear source (D) is located at RA=, DEC, 49′′ (8 kpc) from the nuclear source. Only one of the off-nuclear sources, source C, appears to have a counterpart in any other band.
In order to determine if the nuclear X-ray source is consistent with the photocenter of the galaxy, the source coordinates were compared to the 2MASS photocenter. The 2MASS photocenter was found to be at RA=, DEC, off from the X-ray source coordinates. Thus, we conclude that the nuclear X-ray source is coincident with the 2MASS photocenter, within the astrometric uncertainties. After spatially registering the HST -band image with the 2MASS -band image, we find that the Chandra source is coincident with the NSC (Figure 2).
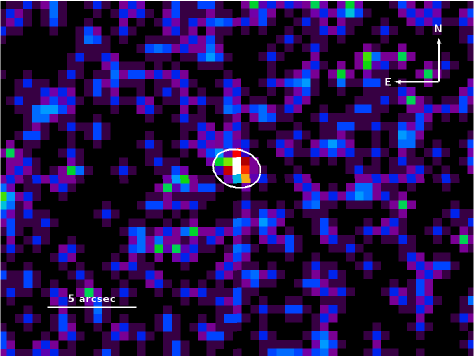
3.1. The Nuclear Source
The nuclear X-ray source is shown in Figure 3. We detect () X-ray counts ( keV) from the source. The nuclear source is strikingly soft, with counts in the keV band and counts in the keV band (for low counts, Poisson statistics are used to calculate the uncertainty, as described in the approach of Gehrels (1986), where the error corresponds to the 84.13% confidence limit), yielding a hardness ratio of . Using a simplified phenomenological power law (PL) model with a Galactic absorption of cm-2 (Dickey & Lockman, 1990, Chandra Colden tool)), and adopting the global intrinsic absorption for NGC 4178 of cm-2 (Cayatte et al., 1994), the observed hardness ratio can be replicated with a photon index . Using these parameters, this model predicts an X-ray luminosity of ergs s-1, and a hard X-ray luminosity is ergs s-1, significantly lower than that implied by the observed [NeV] luminosity.222It should be noted that the apparent luminosity ergs s-1 is consistent with the upper limit previously established for NGC 4178 based on Einstein observations of ergs s-1 (Fabbiano et al., 1992). Indeed, the bolometric luminosity inferred by the [NeV] luminosity is ergs s-1 (see §4.1), 5 orders of magnitude higher than the hard X-ray luminosity predicted by this simplified phenomenological PL model. The bolometric correction factor is , much too high for any realistic AGN spectral energy distribution (SED) (Vasudevan & Fabian, 2009).333In predicting the bolometric luminosity, we included all of the [NeV] flux. In principle, [NeV] emission can be produced by shocked gas associated with a starburst-driven superwind (e.g. Veilleux et al., 2005). However, in the case of NGC 4178, the absence of notable Pa- emission near the photocenter (Figure 2) suggests that there is no vigorous star formation around the nuclear X-ray source. Moreover, the optical spectrum is typical of an HII region and is not consistent with shocks (Ho, Filippenko, & Sargent, 1997).
We therefore postulate that there is highly localized absorption around the central source. Indeed, analysis of data from Chandra Deep Field North has shown that more complex spectra are characteristic of AGNs in local galaxies due to the ubiquity of heavy absorption, and a simple PL cannot reliably be estimated from hardness ratios (Brightman & Kirpal, 2012). With a covering fraction of and absorption cm-2, a partially-absorbed scenario combined with a simple PL can account for the hardness ratio with . With these parameters, the intrinsic X-ray luminosity is ergs s-1 and the hard X-ray luminosity is ergs s-1. The partially-absorbed scenario can be physically interpreted as a strongly-accreting black hole imbedded in a heavy medium in which a few holes have been “punched out” by strong X-ray flux. This is in line with our understanding of black hole accretion, our understanding of the interstellar environment of late-type spiral galaxies, and it is consistent with the bolometric luminosity.
We point out that the observed X-ray luminosity is low, and therefore by itself we cannot exclude the possibility that it is produced by X-ray binaries in the nuclear star cluster. However, the [NeV] luminosity is ergs s-1, which is at the the low end of the range observed in standard optically-identified AGNs (Pereira-Santaella et al., 2010). Indeed, the [NeV] luminosity in NGC 4178 exceeds that of NGC 3621, which has recently been confirmed to have an optical Seyfert 2 spectrum using high resolution Keck observations (Barth et al., 2009). Moreover, the bolometric luminosity implied by the [NeV] luminosity is two orders of magnitude greater than that of NGC 4395, which is indisputably an AGN (Filippenko & Ho, 2003) (see 4.1). Therefore, the [NeV] luminosity, combined with our X-ray results, strongly suggests that the X-ray source is due to an AGN.
3.2. Off-Nuclear Sources
3.2.1 Source B
We detected net counts in the keV range for source B. The hardness ratio is . At a radial distance of 31.6′′, the known intrinsic absorption for NGC 4178 is cm-2 (Cayatte et al., 1994). With this absorption, source B’s hardness ratio can be reproduced by an absorbed PL model with . The corresponding X-ray luminosity is ergs s-1. In the hard X-ray band, the corresponding luminosity is ergs s-1.
3.2.2 Source C
The net counts in the keV range for source C are , with a hardness ratio of . This relatively low hardness ratio can be reproduced by an absorbed PL model with and cm-2, giving an X-ray luminosity of ergs s-1 and a hard X-ray luminosity of ergs s-1.
3.2.3 Source D
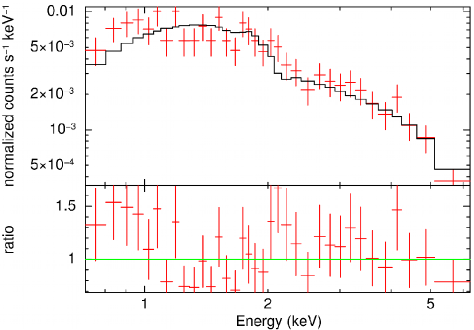
Our brightest X-ray source, source D, had total counts in the keV range, enough to directly fit a spectrum. We tested the variability of this source by extracting the light curve in the keV range and applying a test, and found that the source flux was likely constant during the observation (, ).
The spectrum is well fit ( for 33 degrees of freedom) using an absorbed PL model with and setting the intrinsic absorption cm-2. This yields an X-ray luminosity of ergs s-1 and a hard X-ray luminosity of ergs s-1. If we allow the intrinsic absorption to vary, a comparable fit ( for 32 degrees of freedom) is achieved with cm2 and , yielding an intrinsic X-ray luminosity ergs s-1 and a hard X-ray luminosity of ergs s-1.
This large luminosity gives us a second method of spectrally characterizing the source. Recent work has shown that the physically motivated Bulk Motion Comptonization (BMC) model may provide an effective means of estimating the mass of accreting black holes (Gliozzi et al., 2009; Shaposhnikov & Titarchuk, 2009; Gliozzi et al., 2011). This technique relies on the self-similarity of black holes and their accretion characteristics to relate the photon index with the BMC model normalization . In short, the BMC model convolves the inverse Comptonization of X-ray photons by thermalized electrons with the inverse Comptonization of X-ray photons by electrons with bulk relativistic motion (see Titarchuk et al., 1997, for details on the BMC model). The BMC model has 4 free parameters: the temperature , the spectral index , related to the photon index by , a parameter related to the fraction of Comptonized seed photons by , and the model normalization .
The BMC model gives an excellent fit ( for 31 degrees of freedom) with the intrinsic absorption set to cm2, , , and (Figure 5). The normalization is . The corresponding X-ray luminosity is is ergs s-1, and the hard X-ray luminosity is ergs s-1. Five different spectral patterns of Galactic black hole systems with mass and distance well constrained are provided in Gliozzi et al. (2011). These are the reference sources utilized in the X-ray scaling method. To be conservative in the estimate of the black hole mass of Source C, we have used all five reference patterns and computed the average and standard deviation of the five values, resulting in M☉.
3.2.4 The Nature of The Off-Nuclear Sources
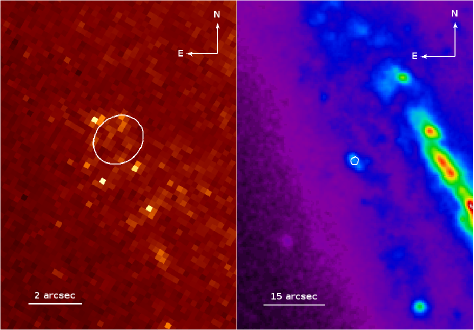
With the exception of source C, the lack of noticeable counterparts in other bands (see Figure 1) suggests that these sources are not foreground objects. Source C is coincident with an extended ( 800 520 parsecs) region (Figure 4), especially evident in high-resolution HST data. This region appears to be an area of extensive star formation, though it is not associated with significant Pa- emission. A priori, we cannot rule out that these sources are background AGN that appear to be located within NGC 4178 by chance. With the known hydrogen column density of cm-2, a background X-ray source would not be heavily absorbed by NGC 4178, even in the soft band. Using results from the Chandra Deep Field-South (CDF-S), we can calculate the likely number of hard X-ray sources in our field ( deg-2) for a given flux that could be expected to occur by chance (e.g. Tozzi et al., 2001). For sources B and C, with hard X-ray fluxes on order of ergs s-1 cm-2, the expected number of sources is , so sources B and C may indeed be background objects. However, for source D, with hard X-ray flux on order of ergs s-1 cm-2, the expected number of sources is . We therefore conclude that source D is likely local to NGC 4178. Source D has a luminosity of ergs s-1, and is therefore consistent with a ULX (e.g. Swartz et al., 2004; Winter et al., 2006; Berghea et al., 2008). Source D’s spectrum is also well fit by the BMC model, suggesting that it may be an IMBH. VLA observations by Cayatte et al. (1990) of neutral hydrogen in NGC 4178 show a heightened concentration ( cm-2) of neutral hydrogen coincident with source D. Niklas et al. (1995) gives the position of this source as , . This concentration is very diffuse, however, so it is uncertain that it is related to source D.
4. Constraints on the Nuclear Black Hole Mass
4.1. Bolometric Luminosity and Eddington Mass Limit of the AGN
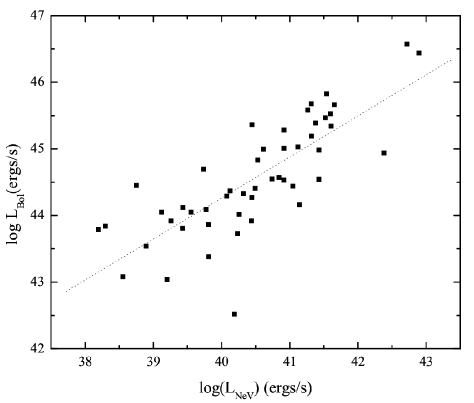
Our IR and X-ray observations allow us to derive a mass estimate for the nuclear black hole. In our previous work, we showed that the [NeV] luminosity is tightly correlated with the bolometric luminosity of the AGN in a sample of optically identified AGNs. We can therefore use the [NeV] luminosity to obtain an estimate of the Eddington mass of the black hole (Satyapal et al., 2007), and therefore set a lower mass limit on the AGN. Since the publication of our previous work, there have been a number of additional mid-IR [NeV] fluxes available in the literature. We therefore update our previously published relation between the [NeV] luminosity and the AGN bolometric luminosity using the most up-to-date mid-IR line fluxes of AGNs observed by Spitzer (Haas et al., 2005; Weedman et al., 2005; Ogle et al., 2006; Dudik et al., 2007, 2009; Gorjian et al., 2007; Cleary et al., 2007; Armus et al., 2007; Deo et al., 2007; Tommasin et al., 2008, 2010; Dale et al., 2009; Veilleux et al., 2009; Pereira-Santaella et al., 2010) that have well-characterized nuclear SEDs. In Figure 6, we plot versus , which shows a strong correlation. The Spearman rank correlation coefficient is 0.83, with a probability of chance correlation of . The bolometric luminosities for this updated sample ranged from ergs s-1 to ergs s-1 and the black hole masses ranged from to . The best-fit linear relation yields:
ergs s-1
with an RMS scatter of 0.53 dex. Using the known [NeV] nuclear luminosity for NGC 4178 of ergs s-1 (Satyapal et al., 2009), the predicted nuclear bolometric luminosity of the AGN is ergs s-1. The Eddington mass limit for the nuclear black hole in NGC 4178 is then M☉.
4.2. Archival VLA Data and The Fundamental Plane
At the positions of the four Chandra sources, we did not find any significant emission in the VLA 4.9 GHz image and measured point source limits of (A), (B), (C), and (D) mJy. These limits are consistent with the original analysis of Saikia et al. (1994) where no significant radio sources were detected. Interestingly, we note a local radio maximum in the VLA image that is to the northeast of the central Chandra source (A) with a position, RA=, DEC. The peak of 0.184 mJy/beam is 3.4 times the average rms noise measured in adjacent background regions. At 4.9 GHz, the single-dish flux of NGC 4178 is 12 mJy (Vollmer et al., 2004) and this peak could easily be an artifact due to unmodelled diffuse radio emission from the galaxy. The only other VLA datasets available in the archive were obtained at 1.4 GHz, but these lower-resolution data are dominated by the diffuse star forming regions seen in the Effelsberg data and the VLA 1.4 GHz D-array image of Condon (1987).
If we use the radio luminosity as an upper limit, we can use the hard X-ray luminosity to estimate the upper limit on the nuclear black hole mass through the so-called fundamental plane (Merloni et al., 2003; Falcke et al., 2004; Merloni et al., 2006; Gültekin et al., 2009), assuming that the relation extends to lower luminosities and black hole masses. Assuming a 5 GHz flux density for the nucleus of 0.2 mJy, the X-ray and radio luminosity would imply a nuclear black hole mass of M☉ (the RMS scatter is ), consistent with the Eddington mass limit derived in the previous section.444In calculating this mass, we have used the hard X-ray luminosity of ergs s-1 from the heavily absorbed scenario. A lower X-ray luminosity would actually increase the upper limit to the black hole mass, according to the fundamental plane. The assumed radio flux value corresponds to the local peak seen in the VLA image in close proximity to the X-ray nuclear source, and is consistent with the strict upper limit measured at the X-ray position.
4.3. Other Considerations
The presence of an NSC in NGC 4178 provides another estimate of the mass of the central black hole. Satyapal et al. (2009) estimated the mass of the NSC to be M☉, similar to the NSC mass in NGC 4395. In cases with a known nuclear star cluster and black hole masses, the ratio of the black hole mass to nuclear star cluster mass, , generally ranges from (Seth et al., 2008; Graham & Spitler, 2009). The lower limit on the black hole mass is then M☉, consistent with the lower limit set by the Eddington mass (although some galaxies have a BH/NSC mass much less than 0.1, such as M33), and the upper limit on the black hole mass is M☉, consistent with the upper limit implied by the radio luminosity.
With the heavily obscured scenario, we can further constrain the black hole mass. Assuming that the NGC 4178 has an X-ray luminosity of ergs s-1, the bolometric correction factor becomes . This finding can in turn be used to constrain the black hole mass by exploiting the correlation between and (Vasudevan & Fabian, 2009). Using the correlation that for systems with very high bolometric correction factors, , we obtain M☉, consistent with the upper mass limit implied by the radio luminosity.
5. Comparison to AGN in Other Late-Type, Bulgeless Galaxies
With a solid X-ray source detection at the center of NGC 4178, we can add this galaxy to the growing collection of bulgeless, extremely late-type disk galaxies with confirmed AGN. The best-studied definitively bulgeless disk galaxy with an AGN is NGC 4395, which shows the hallmark signatures of a type 1 AGN (e.g. Filippenko & Ho, 2003; Lira et al., 1999; Moran et al., 1999). The bolometric luminosity of the AGN is ergs s-1 (Filippenko & Ho, 2003), nearly three orders of magnitude lower than the estimated bolometric luminosity of the AGN in NGC 4178. The black hole mass of NGC 4395, determined by reverberation mapping, is M☉, and does not appear to be radiating at a high Eddington ratio (Peterson et al., 2005). The bolometric luminosity of the AGN in NGC 1042, as estimated from H measurements, is ergs s-1, and the central black hole is estimated to be between 60 M☉ and M☉ (Shields et al., 2008). With the updated relationship, the estimated bolometric luminosity of the AGN in NGC 3621 is ergs s-1 and the Eddington mass is M☉, making NGC 4178 and NGC 3621 the most luminous AGNs in extremely late-type galaxies currently known. The likelihood that the AGN in NGC 4178 is heavily absorbed, combined with the high photon index, suggests that it is accreting at a high rate. The black hole mass of the AGN in NGC 4178 is M☉, possibly lower than the black hole in NGC 4395.
6. Summary and Conclusions
We have analyzed the X-ray characteristics of NGC 4178 from a 36 ks Chandra observation. The X-ray data, combined with considerations from the mid-IR and radio properties of the galaxy, have led us to the following results:
-
1.
There is a faint but statistically significant (), unresolved X-ray source at the center of NGC 4178, confirming the presence of an AGN. The hardness ratio gives some clues about the spectral state, which is consistent with a scenario where the source is accreting at a high rate with . The softness of this source, combined with the discrepancy between the [NeV] luminosity and the observed X-ray luminosity, supports the scenario where NGC 4178 hosts an AGN embedded in a heavy absorber, accreting at a high rate.
-
2.
The bolometric luminosity of the AGN in NGC 4178 predicted by our mid-IR results is ergs s-1, significantly higher than that found in any other extremely late-type, bulgeless disk galaxy.
-
3.
The updated bolometric luminosity, combined with other lines of evidence such as the fundamental plane and the correlation between the mass of nuclear star clusters and their resident SMBHs, have led us to conclude that the AGN in NGC 4178 is powered by a black hole of M☉.
-
4.
Two weak off-nuclear sources found in NGC 4178 have X-ray luminosities consistent with very bright XRBs or ULXs, although we cannot rule out the possibility that they are background objects. A third off-nuclear source is very bright and was directly fit with a PL model, showing that it is a ULX located in NGC 4178 about 8 kpc from the nuclear source. It was also directly fit with a BMC model, suggesting that it may be an IMBH of M☉.
7. Acknowledgements
It is a pleasure to thank Tim Jordan for his invaluable help carefully compiling the fluxes used to construct Figure 6. We thank the referee for their very careful review and insightful comments that significantly improved the paper. This research has made use of the NASA/IPAC Extragalactic Database (NED), which is operated by the Jet Propulsion Laboratory, California Institute of Technology, under contract with the National Aeronautics and Space Administration. N. S. and S. S. gratefully acknowledge support by the Chandra Guest Investigator Program under NASA grant G01-12126X. Work by C. C. C. at NRL is supported in part by NASA DPR S-15633-Y.
References
- Armus et al. (2007) Armus, L., Charmandaris, V., Bernard-Salas, J., et al. 2007, ApJ, 656, 148
- Arnaud (1996) Arnaud, K. 1996, in ASP Conf. Ser. 101, Astronomical Data Analysis Software and Systems V, ed. G. Jacoby & J. Barnes (San Francisco: ASP), 17
- Arnaud et al. (2012) Arnaud, K., Dorman, Dorman, B., & Gordan, C. 2012, An X-Ray Spectral Fitting Package, User’s Guide for version 12.7.1 (Greenbelt, MD: NASA/GSFC Astrophysics Science Division), http://heasarc.nasa.gov/xanadu/xspec/XspecManual.pdf
- Barth et al. (2004) Barth, A., Ho, L., & Sargent, W. 2002, AJ, 124, 2607 . 2004, in ASP Conf. Ser. 311, AGN Physics with the Sloan Digital Sky Survey, ed. G. T. Richards & P. B. Hall (San Francisco: ASP), 91
- Barth et al. (2008) Barth, A. J., Greene, J., & Ho, L. C. 2008, ApJ, 136, 3
- Barth et al. (2009) Barth, A. J., Strigari, L. E., Bentz, M. C., Greene, J. E., & Ho, L. C. 2009, ApJ, 690, 1031
- Berghea et al. (2008) Berghea, C. T., Weaver, K. A., Colbert, E. J. M., & Roberts, T. P. 2008, ApJ, 687, 471
- Böker et al. (1999) Böker, T., et al. 1999, ApJS, 124, 95
- Brightman & Kirpal (2012) Brightman, M., & Kirpal, N. 2012, to be published in MNRAS
- Cayatte et al. (1990) Cayatte, V., vanGorkom, J. H., Balkowski, C., & Kotanyi, C. 1990, AJ, 100, 604C
- Cayatte et al. (1994) Cayatte, V., Kotanyi, C., & Balkowski, C. 1994, AJ, 107, 1003C
- Cleary et al. (2007) Cleary, K., Lawrence, C. R., Marshall, J. A., et al. 2007, ApJ, 660, 117
- Condon (1987) Condon, J. J., 1987, ApJS, 65, 485
- Dale et al. (2009) Dale, D. A., Smith, J. D. T., Schlawin, E. A., et al. 2009, ApJ, 693, 1821
- Dickey & Lockman (1990) Dickey, J. M., & Lockman, F. J. 1990, ARA&A, 28, 215D
- Deo et al. (2007) Deo, R. P., Crenshaw, D. M., Kraemer, S. B., et al. 2007, ApJ, 671, 124
- Desroches & Ho (2009) Desroches, L. B., & Ho, L. C. 2009, ApJ, 690, 267
- de Vaucouleurs et al. (1991) de Vaucouleurs, G., de Vaucouleurs, A., Corwin, H., et al. 1991. The Third Reference Catalogue of Bright Galaxies (New York: Spring)(RC3)
- Dewangen et al. (2008) Dewangen, G. C., Mathur, S., Griffiths, R. E., & Rao, A. R. 2008, ApJ, 689, 726
- Dorman & Arnaud (2001) Dorman, B., & Arnaud, K. A. 2001 in Astronomical Data Analysis Software and Systems X, ASP Conference Proceedings, Vol. 238. Edited by F. R. Harnden, Jr., Francis A. Primini, and Harry E. Payne. San Francisco: Astronomical Society of the Pacific, p. 415
- Dudik et al. (2005) Dudik, R. P., et al. 2005, ApJ, 620, 113
- Dudik et al. (2007) Dudik, R. P., Weingartner, J. C., Satyapal, S., et al. 2007, ApJ, 664, 71
- Dudik et al. (2009) Dudik, R. P., Satyapal, S., & Marcu, D. 2009, ApJ, 691, 2
- Fabbiano et al. (1992) Fabbiano, G., Kim, D. W., & Trinchieri, G. 1992, ApJS, 80, 628
- Falcke et al. (2004) Falcke, H., Körding, E., & Markoff, S. 2004, A&A, 414, 895
- Ferrarese & Merritt (2000) Ferrarese, L., & Merritt, D. 2000, ApJ, 539, L9
- Filippenko & Ho (2003) Filippenko, A. V., & Ho, L. C. 2003, ApJ, 588, L13
- Flohic et al. (2006) Flohic, H. M. L. G., Eracleous, M., Chartas, G., Shields, J. C., & Moran, E. C. 2006, ApJ, 647, 140
- Gebhardt et al. (2000) Gebhardt, K., et al. 2000, ApJ, 539, L13 . 2001, AJ, 122, 2469
- Gehrels (1986) Gehrels, N. 1986, ApJ, 303, 336-346
- Ghosh et al. (2008) Ghosh, H., Mathur, S., Fiore, F., & Ferrarese, L. 2008, AIPC, 1053, 39G
- Gliozzi et al. (2009) Gliozzi, M., Satyapal, S., Erancleous, M., Titarchuk, L., & Cheung, C. C. 2009, ApJ, 700, 1759
- Gliozzi et al. (2011) Gliozzi, M., Titarchuk, L., Satyapal, S., Price, D., & Jang, I. 2011, ApJ, 735, 16
- González-Martín et al. (2006) González-Martín, O., Masegosa, J., Maárquez, I., Guerrero, M. A., & Dultzin-Hacyan, D. 2006, A&A, 460, 45
- Gorjian et al. (2007) Gorjian, V., Cleary, K., Werner, M. W., & Lawrence, C. R. 2007, ApJ, 655, L73
- Graham & Spitler (2009) Graham, A. W., & Spitler, L. R. 2009, MNRAS, 397, 2148
- Greene & Ho (2004) Greene, J. E., & Ho, L. C. 2004, ApJ, 610, 722
- Greene & Ho (2007) Greene, J. E., & Ho, L. C. 2007, ApJ, 670, 92
- Grier et al. (2011) Grier, C. J., Mathur, S., Ghosh, H., & Ferrarese, L. 2011, ApJ, 731, 60G
- Gültekin et al. (2009) Gültekin, K., et al. 2009, ApJ, 706, 404
- Haas et al. (2005) Haas, M., Siebenmorgen, R., Schulz, B., Krügel, E., & Chini, R. 2005, A&A, 442L, 39H
- Haehnelt & Kauffmann (2002) Haehnelt, M. G., & Kauffman, G. 2002, MNRAS, 318, L35
- Ho, Filippenko, & Sargent (1997) Ho, L. C., Filippenko, A. V. & Sargent, W. L. 1997, ApJS, 112, 315
- Jiang et al. (2011a) Jiang, Y., Greene, J. E., & Ho, L. C. 2011, ApJ, 737L, 45J
- Jiang et al. (2011b) Jiang, Y., Greene, J. E., Ho, L. C., Xiao, T, & Barth, A. J. 2011, ApJ, 742, 68J
- Kauffmann & Haehnelt (2000) Kauffmann, G., & Haehnelt, M. 2000, MNRAS, 311, 576
- Kenney et al. (2008) Kenney, J. D. P., et al. 2008 in “The Evolving ISM in the Milky Way & Nearby Galaxies” (arXiv:0803.2532)
- Koopmann & Kenney (2004) Koopmann, R. A., & Kenney, J. D. P. 2004, ApJ, 613, 866
- Kormendy & Kennicutt (2004) Kormendy, J., & Kennicutt, R. C. 2004, ARA&A, 42, 603K
- Kormendy et al. (2011) Kormendy, J., Bender, R., & Cornell, M. E. 2011, Nature, 469, 374
- Lira et al. (1999) Lira, P., Lawrence, A., O’Brien, P., Johnson, R. A., Terlevich, R., & Bannister, N. 1999, MNRAS, 305, 109
- Martin & Kennicutt (2001) Martin, C. L., & Kennicutt, R. C. 2001, ApJ, 555, 301
- Mathur et al. (2008) Mathur, S., Himel, G., Ferrarese, L., & Fabrizio, F. 2008, AIPC, 1053, 43M
- McAlpine et al. (2011) McAlpine, W., Satyapal, S., Gliozzi, M., et al. 2010, ApJ, 728, 1
- Merloni et al. (2003) Merloni, A., Heinz, S., & Di Matteo, T. 2003, MNRAS, 345, 1057
- Merloni et al. (2006) Merloni, A., Körding, E., Heinz, S., Markoff, S., Di Matteo, T., & Falcke, H. 2006, New Astron., 11, 567
- Moran et al. (1999) Moran, E. C., et al. 1999, PASP, 111, 801
- Niklas et al. (1995) Niklas, S., Klein, U., Braine, J., & Wielebinski, R. 1995a, A&AS, 114, 21
- Ogle et al. (2006) Ogle, P., Whysong, D., & Antonucci, R. 2006, ApJ, 647, 161
- Pereira-Santaella et al. (2010) Pereira-Santaella, M., Diamond-Stanic, A. M., Alonso-Herrero, A., & Rieke, G. H. 2010, ApJ, 725, 2270
- Peterson et al. (2005) Peterson, B. M., et al. 2005, ApJ, 632, 799
- Saikia et al. (1994) Saikia, D. J., Pedlar, A., Unger, S. W., & Axon, D. J. 1994, MNRAS, 270, 46
- Satyapal et al. (2004) Satyapal, S., Sambruna, R. M., & Dudik, R. P. 2004, A&A, 414, 825
- Satyapal et al. (2007) Satyapal, S.,Vega, D., Heckman, T., O Halloran, B., & Dudik, R. 2007, ApJ, 663, L9
- Satyapal et al. (2008) Satyapal, S., Vega, D., Dudik, R. P., Abel, N. P., & Heckman, T. 2008, ApJ, 677, 926
- Satyapal et al. (2009) Satyapal, S., Böker, T., McAlpine, W., et al. 2009, ApJ, 704, 439
- Seth et al. (2008) Seth, A., Agueros, M., Lee, D., & Basu-Zych, A. 2008, ApJ, 678, 116
- Shaposhnikov & Titarchuk (2009) Shaposhnikov, N., & Titarchuk, L. 2009, ApJ, 699, 453
- Shields et al. (2008) Shields, J. C., Walcher, J. C., Böker, T., & Ho, L. C. 2008, ApJ, 682, 104
- Shih et al. (2003) Shih, D. C., Iwasawa, K., & Fabian, A. C. 2003, MNRAS, 341, 973
- Swartz et al. (2004) Swartz, D. A., Ghosh, K. K., Tennant, A. F., & Wu, K. 2004, ApJS, 154, 519
- Titarchuk et al. (1997) Titarchuk, L. G., Mastichiadus, A., & Kylafis, N. D. 1997, ApJ, 487, 834
- Tommasin et al. (2008) Tommasin, S., Spinoglio, L., Hainline, K., et al. 2008, Memorie della Società Astronomica Italiana, v. 79, p. 1275
- Tommasin et al. (2010) Tommasin, S., Spinoglio, L., Malkan, M., & Fazio, G. 2010, ApJ, 709, 1257
- Tozzi et al. (2001) Tozzi, P., et al. 2001, ApJ, 562, 42
- Tully & Shaya (1984) Tully, R. B., & Shaya, E. J. 1984, ApJ, 281, 31
- Vasudevan & Fabian (2009) Vasudevan, R. V., & Fabian, A. C. 2009, MNRAS, 392, 1124
- Veilleux et al. (2005) Veilleux, S., Cecil, G., & Bland-Hawthorn, J. 2005, A&A Rev., 43, 769
- Veilleux et al. (2009) Veilleux, S., Rupke, D. S. N., Kim, D. C., et al. 2009, ApJS, 182, 628
- Vollmer et al. (2004) Vollmer, B., et al. 2004, A&A, 418, 1
- Weedman et al. (2005) Weedman, D. W., Hao, L., Higdon, S. J. U., et al. 2005, ApJ, 633, 706
- Winter et al. (2006) Winter, L. M., Mushotzky, R. F., & Reynolds, C. S. 2006, ApJ, 649, 730
- Winter et al. (2009) Winter, L. M., Mushotzky, R. F., Reynolds, C. S., & Tueller, J. 2009, ApJ, 690, 1322