A Chandra observation of the ultraluminous infrared galaxy IRAS 19254–7245 (the Superantennae):
X-ray emission from the Compton-thick AGN and the diffuse starburst
Abstract
We present a Chandra observation of IRAS 19254–7245, a nearby ULIRG also known as the Superantennae. The high spatial resolution of Chandra allows us to disentangle for the first time the diffuse starburst emission from the embedded Compton-thick AGN. The 2-10 keV spectrum of the AGN emission is fitted by a flat power-law () and a He-like Fe K line with EW1.5 keV, consistent with previous observations. The Fe K line profile could be resolved as a blend of a neutral 6.4 keV line and an ionized 6.7 keV (He-like) or 6.9 keV (H-like) line. Variability is detected compared with the previous XMM-Newton and Suzaku observations, demonstrating the compact size of the iron line emission. We fit the spectrum of the galaxy-scale extended emission excluding the AGN and other bright point sources with a soft thermal component with keV. The luminosity of the extended emission is about one order of magnitude lower than that of the AGN. The basic physical and structural properties of the extended emission are fully consistent with a galactic wind being driven by the starburst (no contribution to the feedback by the AGN is required). A candidate ultra-luminous X-ray source is detected 8″ south of the southern nucleus. The 0.3-10 keV luminosity of this off-nuclear point source is erg s-1 if the emission is isotropic and the source is associated with the Superantennae.
1 Introduction
Ultra-Luminous Infrared Galaxies (ULIRGs) emit most of their total energy output in the far-infrared (FIR) domain, with a FIR luminosity greater than . Many ULIRGs are a composite of an active galactic nucleus (AGN) and a starburst (SB), with the violent star formation activity triggered by a galaxy collision or merger. The emission from the central AGN and the dense star-forming regions is obscured by dust and gas, and the fractional contributions to the luminosity by the AGN and SB are not well constrained. Obtaining better insights into the energetics of these systems is crucial to understand the interplay between supermassive black holes (SMBHs) and the formation and evolution of galaxies, which is one of the major unsolved problems in astrophysics.
X-ray observations of ULIRGs above 3 keV, performed with XMM-Newton (Franceschini et al., 2003; Braito et al., 2003) and Chandra (Ptak et al., 2003; Teng et al., 2005) have proved to be a fundamental tool to disentangle the contribution of SB and AGN activity and to investigate the presence of hidden AGNs in these sources. Indeed some of the ULIRGs, classified as pure SBs based on optical and IR spectroscopy, show spectral properties typical of obscured AGNs only when observed in X-rays (i.e., NGC 6240: Iwasawa & Comastri 1998; Arp 299: Della Ceca et al. 2002). Previous X-ray surveys of ULIRGs have also shown that thermal emission from a hot plasma with a rather constant temperature keV is always present (Grimes et al., 2005). This emission dominates the X-ray spectra below 1 keV and it is likely associated with a nuclear or circumnuclear starburst. In particular, Chandra observations of luminous and ultraluminous IR galaxies have proved to be essential to investigate the spatial structure and physical properties of this soft diffuse X-ray emission. Thanks to its high spatial resolution, Chandra observations have shown that in ULIRGs, like in local starbursts, this soft diffuse emission extends far beyond the starburst region itself. This emission is primary evidence of the presence of galactic superwinds (Chevalier & Clegg, 1985; Heckman et al., 1993; Strickland & Stevens, 2000), which are believed to play a major role in the evolution of galaxies and metal enrichment of the intergalactic medium. However, these studies have also shown that ULIRGs are intrinsically faint X-ray sources, thus an X-ray follow up is feasible only for the very brightest ones.
Understanding the physical processes at work in ULIRGs is important since observational evidence shows that ULIRGs are generally advanced mergers of gas-rich galaxies, which are considered to be the origin of many massive elliptical and S0 galaxies. If indeed ULIRGs are forming spheroids, an AGN/SB association is naturally supported by the evidence that all spheroidal galaxies host quasar relics in the form of supermassive black holes (SMBHs), and the quasar stage could be a phase during the evolution of these systems. Support for this view has come from high-resolution spectroscopy of ULIRG mergers (Genzel et al., 2001), whose dynamical properties have proved that they indeed are “ellipticals in formation”. In this framework high resolution simulations of galaxies mergers (Hopkins et al., 2006; Springel et al., 2005) have shown that galaxy mergers may play a fundamental role in supermassive black hole growth and galaxy evolution. Indeed the merger provides the inflow of gas which is likely to fuel both the starburst and, at some stages, an AGN. These simulations predict that for most of this phase the AGN is obscured, with the optically-visible AGN phase occurring in the late stages when the starburst and/or AGN essentially explosively drives out all the remaining interstellar material in the system. To test the predictions of the evolutionary sequence more robust SFR and AGN activity estimators are needed. This reinforces the importance of understanding the contributions of SB and AGN activity in known examples in which they coexist.
Like most ULIRGs, IRAS 19254–7245, at , is a merger system of two gas-rich spiral galaxies, with the nuclei (which corresponds to 11 kpc) apart from each other. Among these interacting ULIRGs, IRAS 19254–7245, with , is a remarkable one. It is known to host a powerful SB with star formation rate (SFR) (Berta et al., 2003) and a heavily obscured AGN, which resembles in many aspects the prototypical type-II (obscured) quasar NGC 6240 (Iwasawa & Comastri, 1998). This source exhibits giant tidal tails extending to a distance of about 350 kpc triggered by a merger event reminiscent of the classical “Antennae” seen in NGC 4038/4039. The southern galaxy is classified as a Seyfert 2 (Mirabel et al., 1991), and the northern galaxy shows an optical spectrum typical of SB (Berta et al., 2003).
Previous X-ray observations of IRAS 19254–7245 are strongly indicative that this ULIRG harbors both a powerful SB and a deeply buried high-luminosity AGN (Pappa et al., 2000; Braito et al., 2003). A recent Suzaku observation has detected the intrinsic AGN emission in the 15-30 keV band and has confirmed the XMM-Newton detection of Fe-K emission (Braito et al., 2009). These data show that both neutral and ionized Fe-K lines are present. In this scenario, the intrinsic 2-10 keV luminosity of IRAS 19254–7245 could be greater than , dominated by the buried quasar. This picture has been confirmed by high signal to noise L band () (Risaliti et al., 2003) and Spitzer observations (Nardini et al., 2008) which also suggested that the main energy source in the mid-IR is an obscured AGN. The XMM-Newton and Suzaku observations have also shown that the soft emission is dominated by the starburst. The temperature and the luminosity of this soft component are consistent with the hot gas found in starburst galaxies and in the other ULIRGs observed so far. The XMM-Newton data show that, although the X-ray emission comes mostly from the southern nucleus containing the buried AGN, the source slightly extended. However, the XMM PSF was too broad to allow the structure of the soft X-ray emission to be investigated in more detail. Furthermore, since the smallest possible extraction region with XMM-Newton includes the whole system, it was not possible to spatially disentangle the contribution of diffuse SB and AGN emission. Again despite the intrinsic high luminosity of the AGN in IRAS 19254–7245, it is heavily obscured and thus it may not outshine the starburst emission below 2 keV.
Here we present the analysis of three exposures of IRAS 19254–7245 by Chandra with total exposure time of 75 ks. These are the first X-ray observations that allow us to directly disentangle the AGN and starburst. We present the Chandra data reduction in Section 2, and we analyze and fit the spectra of the different parts of IRAS 19254–7245 in Section 3. We then discuss our results and draw conclusions in Section 4.
2 Observations and data reduction
The Chandra X-ray Observatory observed IRAS 19254–7245 for three separated exposures with the back-illuminated chip S3 of the Advanced CCD Imaging Spectrometer (ACIS) instrument in a FAINT mode in December 2009 (see Table 1). The data were reprocessed using the contributed script chandra_repro of the CIAO software (ver. 4.3) and calibration database (CALDB 4.4.2) to create the new Level 2 event files. Sources were detected using the wavdetect tool.
In Figure 1, we show four images of IRAS 19245–7245 by merging the three observations, which are within the energy bands of a) 0.3-2 keV; b) 2-4 keV; c) 4-8 keV and d) 6-7 keV. The images are smoothed (in ds9) with a Gaussian kernel of 3 pixels (1.5″ in radius, where 1″ corresponds to 1.2 kpc at the redshift of IRAS 19245–7245). We marked the southern (S), northern (N) nucleus and an off-nuclear point source (X1) in panel (b). As shown in panel a) in Figure 1, there is extended soft X-ray emission contributed by the circumnuclear star formation regions, and we divided the diffuse emission into two regions in shape of annuli with their origin at the southern nucleus: D1 (3-10″, i.e., 3.5-11.8 kpc) and D2 (10-20″, i.e., 11.8-23.6 kpc).In the following subsections, we will analyze the imaging and spectra of the nuclei and the diffuse emission.
Throughout the work in this paper, all Chandra spectra as well as the associated response (RMF) and ancillary (ARF) files were extracted by running the script specextract, which has slightly different input parameters for point-like source and extended emission. We adopt cosmological parameters of , and .
3 Analysis
3.1 The entire merging system
IRAS 19254–7245 was observed by XMM-Newton in March 2001 (Braito et al., 2003) and Suzaku in November 2006 (Braito et al., 2009). The published X-ray fluxes and spectral properties were derived from spectral analysis of the global emission (here ‘global’ means the entire region including the two nuclei and the extended starburst region). We thus first analyzed the global spectra of our Chandra observation, and compared them with the XMM and Suzaku observations to see if there is any variability. The radius of the extraction region is 15″, centered on the southern nucleus, which follows the work of the XMM observation. The source region in the Suzaku paper has a radius of ′, which covers nearly the entire S3 chip. There are several visually-detected point sources which are located 1-3′ away from the southern nucleus of IRAS 19254–7245. Therefore, we did not use this source radius to extract the global spectra. The background emission was chosen from a close-by source-free circular region.
The effective exposure time after flare filtering is shown in Table 1. Photons with energy greater than 8 keV were ignored in the spectral fitting, since the effective area of the ACIS chips is very small above 8 keV. We obtained 1850 photons in total for all three exposures. The spectrum of each observation was grouped to at least 10 counts per bin to allow the use of statistics.
Following the work of Braito et al. (2003, 2009), we fitted each spectrum using a model of thermal plus power-law with an additional Fe K line. The weighted average Galactic H i column density is (Dickey & Lockman, 1990; Kalberla et al., 2005), and is set to be the lower boundary of the obscuration during the fit. We fixed abundance in the thermal component to solar. The photon index of the power-law continuum was determined by ignoring photons with energy greater than 6 keV and with no Gaussian component added in the model. We then fixed the photon index and used the photons in energy band 6-8 keV to fit the iron emission line.
We plot the 0.5-2 keV and 2-10 keV fluxes of the Chandra and the other two observations by XMM and Suzaku in Figure 2. The observed X-ray luminosities reported in XMM observation (Braito et al., 2003) were about a factor of two higher because of the cosmological parameters used in their paper, so we re-derived the luminosities by using the latest parameter values above.
Since there is no significant variability of either the soft or hard X-ray flux between each exposure of the Chandra observation, it is possible for us to fit their combined spectra. The spectra were summed using addspec in HEASoft FTOOLS. Again, the combined spectra were grouped for at least 10 counts per bin, and statistics was used in fitting. The best-fitting parameters are shown in Table 2, as well as the observed soft and hard X-ray luminosities contributed by each component, where errors are determined at the 90% confidence level for one parameter of interest.
In order to put more constraints on the spectral properties of IRAS 19254–7245, we add the XMM and Suzaku data to the spectral fitting. We loaded the PN spectrum of XMM (as the first group), the XIS-FI and XIS-BI spectra of Suzaku (as the second group), and the three ACIS-S spectra of Chandra (as the third group) to perform a spectral fit of the time-averaged spectra. The parameters of the thermal and power-law components are tied together in different spectrum groups except for the relative normalization via a constant multiplicative factor. The temperature and power-law index parameters are close to the results of Chandra data only but with smaller uncertainties, as shown in Table 2. The luminosities are calculated as the mean of the three observations. The plasma abundance was initially fixed at solar, and we then allowed it to vary as a free parameter in this fit. The best-fitting abundance was , and was poorly constrained. We thus fix this parameter to be at solar in this and the following spectral analysis, since the model fitting is not very sensitive to it. We first tied the normalization of the iron line component in all three observations, and the line energy was found to be at 6.68 keV, consistent with the Chandra only fit above. However, the line EW was only keV compared to 1.71 keV we obtained above, which is a hint for variability of the iron line emission. Thus, we allowed the normalization of the iron line component to be free between the three groups. As the EW and luminosity of iron line differ between three observations, we leave them as blank in Table 2, and we will discuss the variability in the following sections.
3.2 Southern nucleus
The southern nucleus is known to host a Compton-thick AGN by previous X-ray observations (Pappa et al., 2000; Braito et al., 2003, 2009). Those X-ray satellites have low spatial resolution, and the detected X-ray emission from the AGN was contaminated by the host galaxy. We are now able to disentangle the AGN from its nuclear starburst region in our Chandra observation. We extracted the spectra of the AGN in the southern nucleus from a circular cell with radius 2.5″. The nucleus is a point-like source, so an energy-dependent point-source aperture correction was applied to the source ARF file. A local background spectrum was extracted from an annulus centered on the nucleus with an inner radius of 3″ and an outer radius of 4″.
We did a simultaneous joint fit to all three spectra with a model of an absorbed power-law plus a Gaussian at first. Then, an additional thermal component (APEC) was added to the fit. The abundance was again fixed at the solar value, and we found a best-fit temperature of the plasma keV. decreases from 90.0 for 105 d.o.f (without the thermal component) to 81.7 for 103 d.o.f. Compared to the power-law plus Gaussian model, this model was preferred at 99.3% confidence level according to the -test.
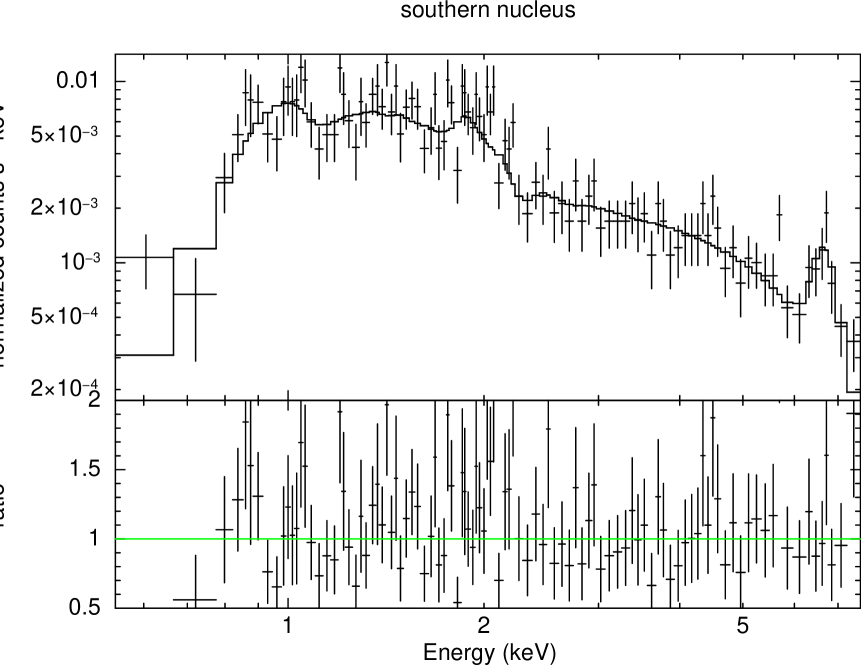
We also fit the summed spectrum and the spectral parameters are close to the joint fit above. We list the best-fitting parameters of both the joint fit and the summed-spectrum fit in Table 2. The plot of the summed spectrum is shown in Figure 3. The flat continuum () of the hard X-ray spectrum and strong iron emission line at 6.7 keV with EW 1.5 keV are consistent with the previous X-ray observations.
An interesting question is if the soft flux in this spectrum is due to circumnuclear starburst emission or is more directly associated with the AGN. To test how this emission scales with extraction region size we also extracted the spectrum of southern nucleus in a smaller region with radius of 1.5″. However, the background was extracted from the larger source region (with radius = 2.5″, the same region as the source extraction region above), scaled to the area of the 1.5″ circle. The rationale is that any component that is extended over the 2.5” region with an constant surface brightness would subtract out completely, while nuclear point-like emission by reduced only by the ratio of the areas of the two regions, i.e., . The temperature of the thermal component is , nearly the same as the value above but with larger uncertainty. The power-law normalization is two thirds of that in the spectral fit of the larger extraction region case, and so is the iron line normalization, consistent with both of these components being point-like. The ratio for the APEC normalization holds the same scaling relationship as that of the power-law normalization in the two cases. This indicates that either there is also point like, i.e., dominated by a thermal source in the innermost part of the nucleus or the AGN emission is mixed with the ambient star-formation and we cannot resolve it with Chandra. If the latter is true, we would expect consistency with the diffuse emission from the extended starburst region, which we will analyze in section 3.4 below.
3.3 Northern nucleus
Although the northern nucleus is relatively weak in X-ray emission compared with the southern one and is believed not to harbor an AGN, it is still interesting to investigate its X-ray properties. We positioned the northern nucleus by visual examination and extracted the spectra within a circle of radii of 1.5″ for Obs ID 10538 and 11797. It could not be visually detected in the observation of Obs ID 11798, and the spectrum was extracted from the region used in Obs ID 10538, which has the brightest northern nucleus in three exposures. 30 photons in total are collected in 0.3-8 keV range. We summed the spectra and fitted the combined spectrum with an absorbed power-law model using Cash statistic (Cash, 1979). Although Cash statistics is designed for unbinned data, we grouped the spectra to at least 1 count per bin, which could improve the performance of the fit (Teng et al., 2005). The photon index is found to be . The observed 2-10 keV luminosity derived from this model is . The spectral parameters are listed in Table 2.
3.4 Diffuse emission
3.4.1 Imaging
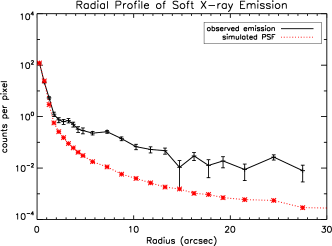
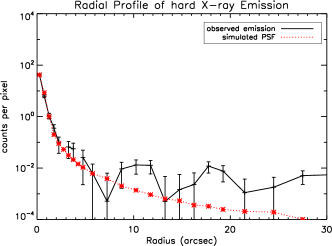
Thanks to the high spatial resolution of Chandra the diffuse emission from the star formation regions could be imaged (see Figure 1). In order to study the extended structure, we investigated the brightness distribution of IRAS 19254–7245. We first simulated an observation of a point source with the same spectral properties as the merged event using the Chandra Ray Tracer (ChaRT; Carter et al., 2003) to trace the rays through the Chandra X-ray optics, and created an image of the PSF using MARX (version 4.5). The comparison between the observed radial profile of the extended structure and the simulated PSF in both soft and hard X-ray bands is shown in Figure 4, where the X-ray centroid of the southern nucleus was used as the origin. In the left panel of Figure 4, we see that the observed distribution of the soft X-ray emission is rather close to the simulated one within the radius of 2″, and for radii between 3″and 20″, there is a significant excess of the observed counts with respect to the simulated PSF. In the hard X-ray band shown in the right panel of Figure 4, the radial profile of the extended emission is consistent with the simulated PSF.
3.4.2 Spectral analysis
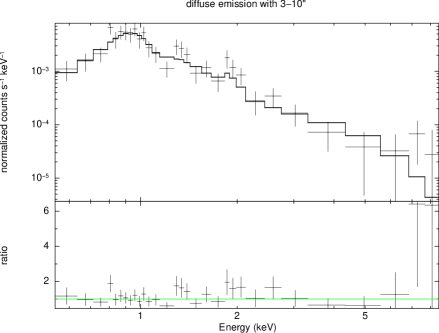
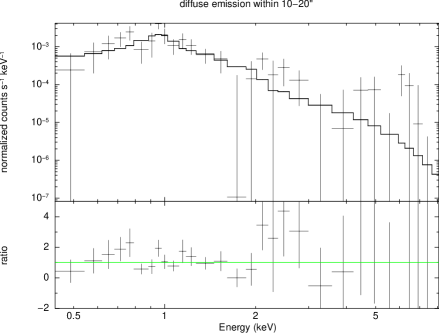
In order to extract the spectrum of the circumnuclear starburst, the emission from the AGN was excised within a circle of 3″ radius, and other point sources detected by wavdetect were also excluded. We extracted the spectra of the star-forming region in two annuli centered on the southern nucleus: one has the inner radius of 3″ and outer radius of 10″ (D1); the other one has inner radius of 10″ and outer radius of 20″ (D2), as described in Section 2. The background spectra were extracted in a concentric annulus with inner radius of 40″ and outer radius of 50″. The spectra of three exposures were then added to improve the signal-to-noise ratio.
Soft emission: The extended star-forming region is dominated by soft emission, as shown by the comparison between the soft and hard X-ray images in Figure 1. We first ignored the hard X-ray photons with energy greater than 3 keV, and fitted the spectrum of the soft emission. It was initially characterized by a thermal plasma with solar abundance. The resulting temperature was keV for D1 and keV for D2 (see Table 3). The plasma temperatures are consistent with the spectral fits of XMM and Suzaku data, and are within the the typical range of starburst galaxies (e.g., Ptak et al., 1999; Grimes et al., 2005). The temperature of the diffuse emission in D1 is also close to the value for the AGN spectra, indicating that the emission from the southern nucleus is probably also exhibiting thermal emission from the circumnuclear star-forming regions. We then investigated the possibility of introducing another thermal component associated with an absorber in the spectral fitting since such a feature is found in other ULIRGs (Dahlem et al., 1998; Iwasawa & Comastri, 1998; Gallagher et al., 2002). This second plasma component is colder, with a temperature of keV for D1 and keV for D2. The best-fitting parameters are listed in Table 3. The two-temperature model does not improve the spectral fit much, and the normalization of the cooler component has a very large uncertainty, so we thus adopt the results of the single temperature model in this paper.
Hard emission: The hard continuum was fitted by a power-law, and we included the soft emission in the spectral fitting because the power-law parameters could be determined much more accurately in this way. For the inner region D1, the photon index is , a typical value for AGN. For the outer region D2, we initially got a much steeper index of . However, the larger errors due to low signal-to-noise makes it consistent with the value in the spectral fit of D1. The soft and hard X-ray luminosities are also listed in Table 2, and the spectral plots of both regions are shown in Figure 5. As we see in Table 2, the thermal emission and power-law emission account for similar amounts of the soft X-ray emission. The hard X-ray luminosity is 20 times smaller than that of the southern nucleus. The best-fit column density along the light of sight is negligible in D2 so we set it to be equal to the Galactic column density, and it is slightly larger in D1. Because the hard X-ray emission in the D2 is much weaker than in D1 and has poorer quality, we extracted the spectra from the combined regions of D1 and D2 and re-fitted the hard spectrum. The power-law index was then found to be close to that in D1.
The spectrum of the diffuse emission shows an excess in the 6-7 keV band. Could it be due to ionized iron emission contributed by very hot gas driven by the starburst (Heckman et al., 1990; Strickland & Heckman, 2007)? We show in panel d) in Figure 1 the image within the energy range of 6.0-7.0 keV, which covers the neutral and ionized iron emission line energies in observer’s frame. This image shows that the region of iron line emission overlaps the southern nucleus and is not extended. However, due to the low signal-to-noise ratio and limited photons in hard X-ray band, we cannot rule out the possibility that the hard continuum emission is due to another much hotter plasma. If we fit the hard X-ray spectrum with a thermal component, the temperature is keV with very large uncertainty, and the reduced is nearly the same as that in the case of power-law.
3.5 Iron line emission
The iron emission line in the Southern nucleus has a relatively broad profile ( keV), and Braito et al. (2009) showed the possibility that it is a blend of multiple lines. It is therefore interesting to further investigate this feature. In order not to wash out the possible fine structure of the iron line profile, we fitted the unbinned time-averaged Chandra spectra using the Cash statistic.
We used a power-law continuum with the photon index fixed at and two gaussian lines to fit the Chandra spectrum within energy between 3 keV and 8 keV. The centroid energy of two lines are found to be 6.43 and 6.71 keV, and the equivalent widths are 0.17 keV and 0.66 keV respectively, i.e., the neutral iron line is weaker than the ionized iron line. However, this is not the same as when we re-analyzed the XMM data. We fitted the unbinned PN data of the XMM observation in the same way as above. The energy of the ionized iron line is 6.89 keV, which is Hydrogen-like. The EW is 1.16 keV for the neutral line, and 0.44 keV for the ionized line. The double line fit of Suzaku data gives similar results as Chandra for the line energy and EW as the Chandra observation. We then plotted the confidence contours between the line energy and normalization for both lines at the 1, 2 and 3 levels. The line profile and contours are shown in Figure 6, where the energy is in the rest frame. We see that the significance of the 6.4 keV line in Suzaku and Chandra observations is only 2, but the lines in the XMM observation could be separately detected at confidence.
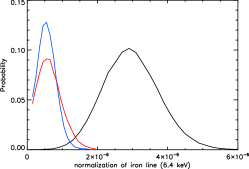
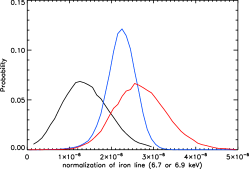
We then ran Markov Chain Monte Carlo (MCMC) simulations to test the statistical significance of the lines. Each chain entailed iterations, and we ran 5 chains for each spectrum. The parameters and the associated errors are given in Table 4. The significance of the line was then calculated as the fraction of the iterations where the line normalization parameter was non-zero. We see in Table 4 that the 6.4 keV line in the XMM observation and 6.7 keV lines in the Suzaku and Chandra observations are significant at a level of over 99.99%. The significance for the 6.9 keV line in the XMM observation is about 97%, and only less than 90% for the 6.4 keV lines in the Suzaku and Chandra observations. As in Figure 6, we plot the probability contours of line energy and line normalization derived from the MCMC analysis in the upper panel of Figure 7 at probability levels of , and . Histograms showing the distribution of each line normalization is also shown in the lower panel of Figure 7. The left plot shows the neutral 6.4 keV line normalization distribution and the right plot shows the ionized line (6.7 or 6.9 keV) distributions. Lines in black, blue and red indicate the observation of XMM, Suzaku and Chandra, respectively. The peak of distribution of the 6.4 keV line overlaps in the Suzaku and Chandra observation, but is obviously separated from the XMM observation, giving a probability of the line variability. However, the variability of the ionized iron line is not significant as indicated by the right panel of Figure 7.
We also tried to use three lines to fit the iron emission spectra. However, the data quality does not allow us to investigate the possibility that both He-like and H-like lines are present.
3.6 Off-nuclear point source
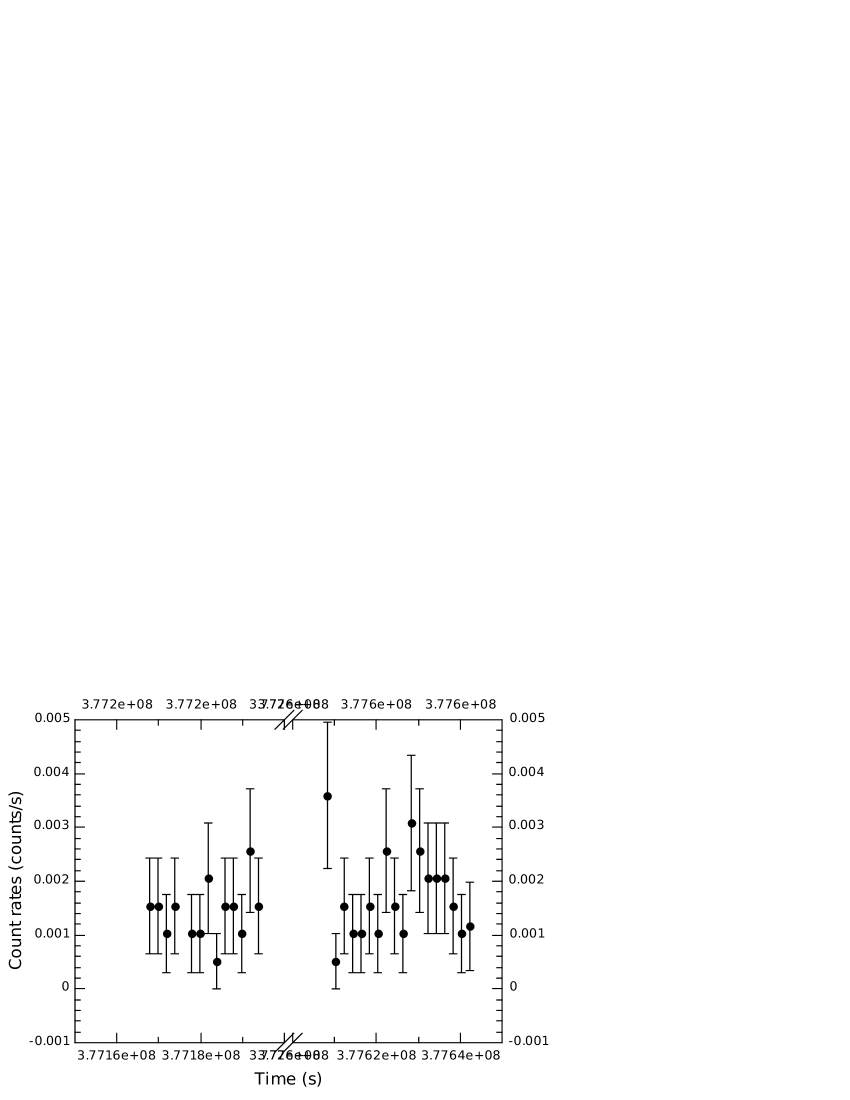
Ultraluminous X-ray objects (ULXs) are commonly seen in ULIRGs (Ptak et al., 2003). They are objects that are much more luminous than a stellar mass black hole or neutron star binary accreting at Eddington limit, and are not located in the nucleus of a galaxy. As shown in Figure 1, an off-nuclear point source (X1) is found about 8″ south of the southern nucleus, which is also detected by wavdetect. No counterpart at this position is found in optical images. We plot the light curve of X1 in Figure 8 within the three Chandra exposures, and the bin size is 2 ks. The spectra of the non-nuclear point source were extracted from a circle of 2″ radius, and the background region was chosen to be a concentric annulus with an inner radius of 4″ and an outer radius of 5″. This point source has 78 photon counts in the 0.3-8 keV band detected in three exposures. Thus we binned the summed spectrum into at least 1 count per bin using Cash statistics to perform the spectral fit.
We fitted the spectrum of this point source with several models: simple power-law (PL), a thermal plasma (APEC) plus a power-law and a multi-color accretion disk (MCD) with a power-law. Table 5 lists the best-fitting parameters and the observed soft and hard X-ray luminosity of each model. The best-fitting photon index is about in the PL and APEC+PL model, and a little bit harder () in the MCD+PL model. The temperature of the plasma in the APEC model is found to be keV, and the temperature at inner disk radius of the MCD model is keV. All three models give the observed soft X-ray luminosity of about , and the hard X-ray luminosity of about , which is about one order of magnitude more luminous than a typical ULX.
4 Discussion
The Chandra observation allows us to disentangle the two nuclei in the merger system of IRAS 19245–7245 for the first time in X-ray imaging. Our analysis demonstrates that the southern nucleus, which hosts a Compton-thick AGN, contributes over 80% of the X-ray emission of the entire merger system in 0.5-10 keV band, and produces of the hard X-ray luminosity. Extended soft X-ray emission has been observed around the southern nucleus out to a radius of 25 kpc, contributing a similar amount of soft X-ray photons as the southern nucleus itself.
4.1 Emission from AGN
Soft emission: The flat hard X-ray continuum and the intrinsic Compton-thick absorber have been well discussed by Braito et al. (2003, 2009). One of the key goals of our Chandra observation was to better investigate the relative contribution of SB and AGN activity. However, this discrimination becomes vague when referring to the soft emission from the southern nucleus. The soft emission is fit well with a power-law and a thermal component. The properties of the thermal component are consistent with those from the extended region and thus is likely to be thermal and starburst dominated emission rather than AGN-photoionized plasma. Even when we extracted the emission from a smaller region, this thermal component could not be ruled out. The total observed 0.5-2 keV luminosity of the southern nucleus is , and one third comes from the thermal emission according to the spectral model. If we convert the soft X-ray luminosity to SFR assuming the relationship given by Ranalli et al. (2003), we get , which is close to the estimated SFR that is about for the southern nucleus (Berta et al., 2003) given the dispersion in the X-ray/SFR correlation.
Fe K line: Iron emission lines are only detected in the southern nucleus. We tried to add a Gaussian component in the spectral fitting of the inner region D1 in the extended starburst region, however, it did not reduce the . The low quality of the hard X-ray photons in the outer region D2 prevents us from investigating the iron line feature. Indeed, the 6-7 keV image shows that iron line photons are only from the southern nucleus. The luminosity of the iron emission line observed by XMM-Newton in March 2001 is (after correction), and it dropped to in the Suzaku observation in November 2005. The result from our recent Chandra observation is, however, consistent with the XMM observation. The EW of line was 1.5 keV and 0.7 keV in XMM and Suzaku observations, respectively.
We also investigated the possibility of a blend of two lines of the Fe K emission. In the 2001 XMM observation, a neutral iron line with centroid line energy at 6.4 keV and an ionized H-like iron line with centroid line energy at 6.9 keV are clearly separated at significance level . The intensity of the 6.4 keV line is larger than the 6.9 keV line. However, the significance of the 6.4 keV line in the 2005 Suzaku and 2009 Chandra observations decreases to only , and a He-like iron line (6.7 keV) shows up in the late two observations and dominates the intensity. Terashima et al. (2000) reported a similar iron line variability in NGC 4579 in two ASCA observations, but Eracleous et al. (2002) compared that with a Chandra observation and argued that such variability might be due to the very large extraction region of ASCA spectra, which was contributed by the ionized Fe K emission from the entire circumnuclear nebula. However, as we show in above sections that there is little extended emission in 6-7 keV band, the aperture effect is not likely the cause of the variability.
The variability of the 6.4 keV line indicates that the cold matter where this line originates lies within 2 pc from the nucleus. If the energy shift of the ionized line from 6.9 keV to 6.7 keV is true, there might be multiple locations of the clumpy clouds with different ionization states. Since there is no flux variability of the continuum emission, we could not constrain the distance of the ionized line emitters based on the time lag between the continuum and the Fe line ionization change. If the change of ionization state (from H-like to He-like) is not true but due to the insufficient photons in the spectral fitting, there is still a change in the ionized Fe K line intensity. The 6.7 keV line could originate either from an ionized accretion disk or from reflection/scattering of the hard nuclear X-rays by ionized clouds not farther than 2 pc from the central engine.
4.2 Emission from Starburst
Soft emission: From the soft X-ray image of IRAS 19245–7245, we can see that hot gas emission extends to a radius of ( 25 kpc) surrounding the southern nucleus. The thermal emission requires a keV component in the best-fitting models of the inner region (D1) of the diffuse emission. The temperature is consistent with the thermal emission found in the southern nucleus. Although the spectra in the outer region (D2) have relatively poorer quality, the temperature of the hot gas in D2 from the spectral fit is consistent with that of D1 but with larger uncertainty.
Using the parameters of the X-ray spectral model, we can derive the basic physical properties of the hot gas in the regions of S, D1 and D2. The normalization for the APEC component () implies a volume integral of density squared if we assume the electron density () approximately equals the H atom density (), where Mpc is the angular distance of IRAS 19254–7245 at redshift . The mass (), mean thermal pressure (), total thermal energy () of the hot gas can be derived using the electron density and temperature from the spectral fit. The characteristic timescale could be calculated as the size divided by the sound speed in the hot gas. Then, the outflow rates of the mass () and energy () can be roughly estimated according to the timescale. These physical parameters are listed in Table 6, where we parameterize them by the volume filling factor of the X-ray-emitting material. We see that while most of the mass and thermal energy content of the hot gas is contained in the outer regions (D1 and D2), the actual estimates of the rates at which energy and mass flow outwards are consistent as we move from the central region (S) to D1 and through D2. This is constituent with a mass- and energy-conserving outflow which originates in the starburst (inside region S).
We then use Starburst99 (Leitherer et al., 1999) to estimate the relevant parameters expected for the collection of supernovae and massive stars in the starburst. We adopt a star formation rate of 80 M⊙ yr-1 (Berta et al., 2003) which has been constant over the past 100 Myr and has a standard Kroupa IMF. The resulting total mechanical power of the stellar wind and supernovae ejecta is , they carry a momentum flux of , and the mass outflow rate is .
These values imply that a starburst-driven outflow can account for the properties of the extended soft X-ray emission. The observed outflow rate of (thermal) energy is only 10% of the total energy injection rate from the starburst while the observed mass outflow rate is about three times larger than the expected starburst mass injection rate. This latter result is commonly observed in starburst-driven winds and it ascribed to mass-loading as the supernovae and massive star ejecta mix with ambient interstellar gas (e.g. Strickland & Heckman, 2009). The predicted momentum flux from the starburst results in a wind ram pressure of about , , and dyne cm-2 at the outer boundaries of regions S, D1, and D2 respectively. These values are very close to the inferred pressures in the observed extended soft X-ray region.
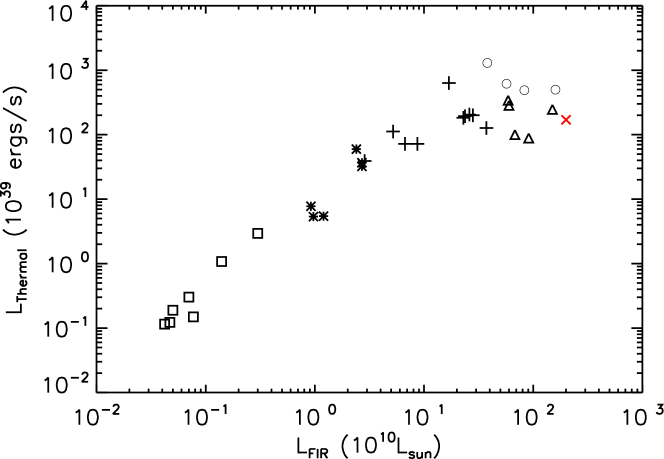
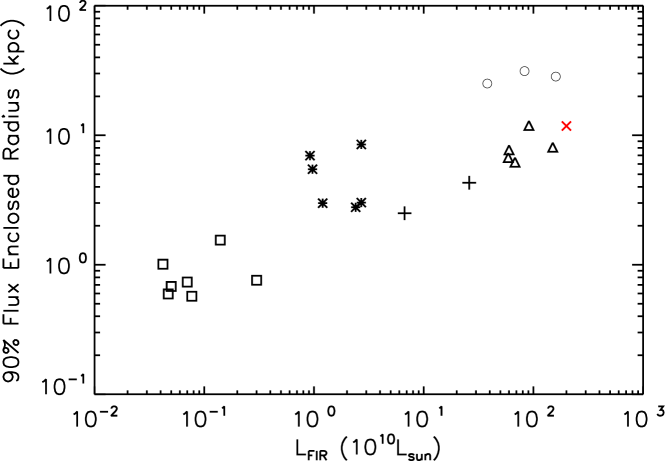
More empirically, we can compare the basic properties of the soft extended emission to what is seen in typical starbursts. First, we can compare the relation between the far-IR and soft X-ray luminosity of IRAS 19245–7245 with other star-forming galaxies which differ in their size and luminosity. The plot is shown in the upper panel of Figure 9, where the other galaxies are dwarf starbursts, normal starbursts, Lyman break analogs, starburst-dominated ULIRGs and AGN ULIRGs (Grimes et al., 2005, 2006, 2007; Jia et al., 2011). The soft X-ray luminosities are derived from the thermal component in the spectral fits by excluding the contribution from AGNs and X-ray binaries. The luminosity ratio of SX/IR for ULIRGs is found to be about one dex smaller than the value for star-forming galaxies with . This deficiency in systems with high IR luminosity was characterized as with scatter of 0.37 by Symeonidis et al. (2011). This ratio for IRAS 19245–7245 is -4.66 according to our spectral analysis, well consistent with their result for the star-forming galaxies with similarly high far-IR luminosities. We also show in the lower panel of Figure 9 that IRAS 19245–7245 obeys the relation between the size of the soft X-ray emitting region and the far-IR luminosity defined by other star-forming galaxies.
We conclude that the properties of the large ( 50 kpc diameter) spatially-extended region of soft X-ray emission are entirely consistent with an origin as a starburst-powered galactic wind.
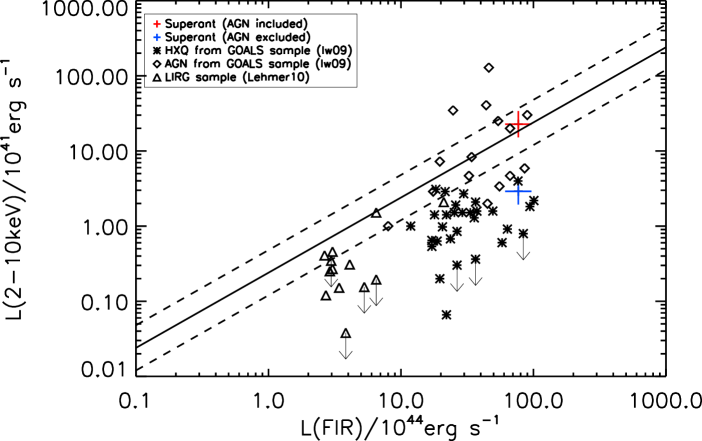
Hard emission: The hard X-ray continuum of the diffuse emission is characterized as a power-law with photon index of , which is much steeper than that found in southern nucleus. We compare the luminosity ratio of hard X-ray to far IR with other LIRGs and ULIRGs observed by Chandra in Figure 10. The other samples are from Iwasawa et al. (2009) and Lehmer et al. (2010), where Iwasawa et al.’s sample was divided into two groups of AGNs and “Hard X-ray Quiet” galaxies (HXQs) indicated by diamond and asterisk symbols, respectively, and Lehmer et al.’s sample was indicated by triangle symbols. We show IRAS 19254–7245 as plug signs in two positions in this plot: one with AGN contribution included (in red) and the other one without AGN contribution (in blue). We see that the hard X-ray luminosity produced by the star formation process is consistent with other pure star-forming galaxies (with no AGN) having similar far-IR luminosities.
4.3 Emission from other regions
Northern nucleus: The northern nucleus was not resolved in the XMM-Newton observation, and it was included in the 15″ extraction circle of spectral analysis (Braito et al., 2003). According to our Chandra observation, both the soft and hard X-ray luminosities are times smaller than those of the southern nucleus. We fitted the spectrum of northern nucleus with only an absorbed power-law due to the limited photons we obtained. The photon index is found to be but poorly constrained. It has been demonstrated by the optical spectra that there is no AGN emission in this nucleus. This classification is supported by its low X-ray luminosity and the non-detection of Fe K line emission in our Chandra observation. The SFR of the northern nucleus is only , and it appears to be in a post-starburst phase (Berta et al., 2003), which is consistent with its weak X-ray emission.
Off-nuclear point source: One off-nuclear point source is found south of the southern nucleus. If we assume that it is associated with the Superantennae, it would lie about 9.4 kpc from the southern nucleus in projection and have a 0.5-10 keV luminosity as high as (based on the spectral fits using different models). This is about one order of magnitude more luminous than the typical ULXs found in other galaxies, but still within the luminosity range they span. In a recent Chandra survey of X-ray point sources in nearby galaxies, Liu (2011) found 479 ULXs with , and about 15% (74 out of 479) are extreme ULXs with . The X-ray luminosity of this ULX in the Superantennae would imply a minimum black hole mass of about 500 M⊙ for a source at the Eddington limit.
We note that an association with the Supernantennae is likely. Using the 2-8 keV flux of and the number-count relations from Chandra Deep Fields (Bauer et al., 2004; Brandt & Hasinger, 2005), we calculate that the possibility of a background AGN located within a radius of 8″ from the southern nucleus is only about .
5 Summary
In this work we have presented Chandra observation of the proto-typical merger/ULIRG IRAS 19254–7245 (the Superantennae). This is the first X-ray observation that could spatially resolve the diffuse emission of this ULIRG. The main results are summarized as follows:
-
1.
The southern nucleus hosts a Compton-thick AGN, which contributes of the hard X-ray emission of IRAS 19254–7245. The soft X-ray emission from the AGN region is contaminated by the circumnuclear starburst.
-
2.
The diffuse emission from starburst extends out to a radius of about 25 kpc surrounding the southern nucleus, and is dominated by thermal emission with a temperature of keV. This emission accounts for of the soft emission from the whole merging system.
-
3.
The global properties of the extended thermal emission are consistent with winds seen in many starbursts and the basic physical properties are fully consistent with an outflow driven by the supernovae and massive stars in the starburst. Feedback from the AGN is not necessary to explain what we see.
-
4.
The prominent Fe K emission line is a blend of both neutral and ionized lines, and variability is detected for the neutral one.
-
5.
No evidence for an AGN in the northern nucleus is detected in this Chandra observation.
-
6.
An off-nuclear point source is found and could be classified as a ULX if it is associated with the Superantennae.
References
- Bauer et al. (2004) Bauer, F. E., Alexander, D. M., Brandt, W. N., et al. 2004, AJ, 128, 2048
- Berta et al. (2003) Berta, S., Fritz, J., Franceschini, A., Bressan, A., & Pernechele, C. 2003, A&A, 403, 119
- Braito et al. (2003) Braito, V., et al. 2003, A&A, 398, 107
- Braito et al. (2009) Braito, V., Reeves, J. N., Della Ceca, R., Ptak, A., Risaliti, G., & Yaqoob, T. 2009, A&A, 504, 53
- Brandt & Hasinger (2005) Brandt, W. N., & Hasinger, G. 2005, ARA&A, 43, 827
- Carter et al. (2003) Carter, C., Karovska, M., Jerius, D., Glotfelty, K., & Beikman, S. 2003, Astronomical Data Analysis Software and Systems XII, 295, 477
- Cash (1979) Cash, W. 1979, ApJ, 228, 939
- Chevalier & Clegg (1985) Chevalier, R. A., & Clegg, A. W. 1985, Nature, 317, 44
- Dahlem et al. (1998) Dahlem, M., Weaver, K. A., & Heckman, T. M. 1998, ApJS, 118, 401
- Della Ceca et al. (2002) Della Ceca, R., Ballo, L., Tavecchio, F., et al. 2002, ApJ, 581, L9
- Dickey & Lockman (1990) Dickey, J. M., & Lockman, F. J. 1990, ARA&A, 28, 215
- Eracleous et al. (2002) Eracleous, M., Shields, J. C., Chartas, G., & Moran, E. C. 2002, ApJ, 565, 108
- Franceschini et al. (2003) Franceschini, A., Braito, V., Persic, M., et al. 2003, MNRAS, 343, 1181
- Gallagher et al. (2002) Gallagher, S. C., Brandt, W. N., Chartas, G., Garmire, G. P., & Sambruna, R. M. 2002, ApJ, 569, 655
- Genzel et al. (1998) Genzel, R., Lutz, D., Sturm, E., et al. 1998, ApJ, 498, 579
- Genzel et al. (2001) Genzel, R., Tacconi, L. J., Rigopoulou, D., Lutz, D., & Tecza, M. 2001, ApJ, 563, 527
- Grimes et al. (2005) Grimes, J. P., Heckman, T., Strickland, D., & Ptak, A. 2005, ApJ, 628, 187
- Grimes et al. (2006) Grimes, J. P., Heckman, T., Hoopes, C., et al. 2006, ApJ, 648, 310
- Grimes et al. (2007) Grimes, J. P., Heckman, T., Strickland, D., et al. 2007, ApJ, 668, 891
- Heckman et al. (1990) Heckman, T. M., Armus, L., & Miley, G. K. 1990, ApJS, 74, 833
- Heckman et al. (1993) Heckman, T. M., Lehnert, M. D., & Armus, L. 1993, The Environment and Evolution of Galaxies, 188, 455
- Hopkins et al. (2006) Hopkins, P. F., Somerville, R. S., Hernquist, L., et al. 2006, ApJ, 652, 864
- Iwasawa & Comastri (1998) Iwasawa, K., & Comastri, A. 1998, MNRAS, 297, 1219
- Iwasawa et al. (2009) Iwasawa, K., Sanders, D. B., Evans, A. S., et al. 2009, ApJ, 695, L103
- Jia et al. (2011) Jia, J., Ptak, A., Heckman, T. M., et al. 2011, ApJ, 731, 55
- Kalberla et al. (2005) Kalberla, P. M. W., Burton, W. B., Hartmann, D., Arnal, E. M., Bajaja, E., Morras, R., Pppel, W. G. L. 2005, A&A, 440, 775
- Lehmer et al. (2010) Lehmer, B. D., Alexander, D. M., Bauer, F. E., et al. 2010, ApJ, 724, 559
- Leitherer et al. (1999) Leitherer, C., Schaerer, D., Goldader, J. D., et al. 1999, ApJS, 123, 3
- Liu (2011) Liu, J. 2011, ApJS, 192, 10
- Mirabel et al. (1991) Mirabel, I. F., Lutz, D., & Maza, J. 1991, A&A, 243, 367
- Nardini et al. (2008) Nardini, E., Risaliti, G., Salvati, M., et al. 2008, MNRAS, 385, L130
- Pappa et al. (2000) Pappa, A., Georgantopoulos, I., & Stewart, G. C. 2000, MNRAS, 314, 589
- Ptak et al. (1999) Ptak, A., Serlemitsos, P., Yaqoob, T., & Mushotzky, R. 1999, ApJS, 120, 179
- Ptak et al. (2003) Ptak, A., Heckman, T., Levenson, N. A., Weaver, K., & Strickland, D. 2003, ApJ, 592, 782
- Ranalli et al. (2003) Ranalli, P., Comastri, A., & Setti, G. 2003, A&A, 399, 39
- Risaliti et al. (2003) Risaliti, G., Maiolino, R., Marconi, A., et al. 2003, ApJ, 595, L17
- Springel et al. (2005) Springel, V., Di Matteo, T., & Hernquist, L. 2005, MNRAS, 361, 776
- Strickland & Stevens (2000) Strickland, D. K., & Stevens, I. R. 2000, MNRAS, 314, 511
- Strickland & Heckman (2007) Strickland, D. K., & Heckman, T. M. 2007, ApJ, 658, 258
- Strickland & Heckman (2009) Strickland, D. K., & Heckman, T. M. 2009, ApJ, 697, 2030
- Symeonidis et al. (2011) Symeonidis, M., Georgakakis, A., Seymour, N., et al. 2011, MNRAS, 417, 2239
- Teng et al. (2005) Teng, S. H., Wilson, A. S., Veilleux, S., Young, A. J., Sanders, D. B., & Nagar, N. M. 2005, ApJ, 633, 664
- Terashima et al. (2000) Terashima, Y., Ho, L. C., Ptak, A. F., et al. 2000, ApJ, 535, L79
 |
 |
 |
 |

 |
 |
 |
 |
 |
 |
 |
 |
 |
 |
 |
 |
 |
 |
 |
 |
 |
| Obs ID | Date | Exp. Timea |
|---|---|---|
| YYYY-MM-DD | (ks) | |
| 10538 | 2009-12-14 | 29.06 |
| 11797 | 2009-12-19 | 35.16 |
| 11798 | 2009-12-19 | 11.81 |
| Region | aaThe exposure time is the good time interval after flare filtering. | bbTemperature of thermal plasma in keV. | ccPhoton index of hard continuum. | ddEnergy of line center in keV in rest-frame. | eeEmission line width in keV. | EWffEquivalent width of emission line in keV. | ggSoft X-ray luminosity contributed by thermal plasma in units of ergs s-1. | hhSoft X-ray luminosity contributed by power-law continuum in units of ergs s-1. | iiHard X-ray luminosity in units of ergs s-1. | jjIron emission line luminosity in units of ergs s-1. | |
|---|---|---|---|---|---|---|---|---|---|---|---|
| Global kkUsing stacked spectral data from Chandra observation. | 146.0/154 | ||||||||||
| Global llUsing Chandra, XMM and Suzaku data. | 388.9/361 | ||||||||||
| S (joint) | 81.7/103 | ||||||||||
| S (summed) | 99.1/97 | ||||||||||
| N | 25.5/29 | ||||||||||
| D1 | 23.1/26 | ||||||||||
| D2 | 28.5/28 | ||||||||||
| D1+D2 | 53.8/55 |
Note. — Uncertainties correspond to the 90% confidence level for one interesting parameter.
| Region | |||||||
|---|---|---|---|---|---|---|---|
| cm-2 | keV | cm-2 | keV | ||||
| Single temperature | |||||||
| D1 | 19.15/22 | ||||||
| D2 | 18.9/17 | ||||||
| Double temperatures | |||||||
| D1 | 15.2/19 | ||||||
| D2 | 18.1/13 | ||||||
| Spectral fit | ||||||||||
|---|---|---|---|---|---|---|---|---|---|---|
| line 1 | line 2 | |||||||||
| Observation | EW | EW | ||||||||
| XMM | 0.01 (fix) | |||||||||
| Suzaku | 0.01 (fix) | |||||||||
| Chandra | 0.1 (fix) | |||||||||
| MCMC | ||||||||||
| line 1 | line 2 | |||||||||
| Observation | EW | significance | EW | significance | ||||||
| XMM | 0.01 (fix) | |||||||||
| Suzaku | 0.01 (fix) | |||||||||
| Chandra | 0.01 (fix) | |||||||||
Note. — , and EW are in units of keV.
| model | or | -statistic | ||||
|---|---|---|---|---|---|---|
| keV | /dof | |||||
| PL | 50.0/55 | |||||
| APEC+PL | 49.0/53 | |||||
| MCD+PL | 49.7/54 |
| Parameters | S | D1 | D2 |
|---|---|---|---|