The optical spectrum of PKS 1222+216 and its black hole mass
Abstract
We investigate the optical spectral properties of the blazar PKS 1222+216 during a period of 3 years. While the continuum is highly variable (i.e., from Lλ(5100Å) erg/s up to erg/s) the broad line emission is practically constant. This supports a scenario in which the broad line region is not affected by jet continuum variations. We thus infer the thermal component of the continuum from the line luminosity and we show that it is comparable with the continuum level observed during the phases of minimum optical activity. The mass of the black hole is estimated through the virial method from the FWHM of Mg II, H, and H broad lines and from the thermal continuum luminosity. This yields a consistent black hole mass value of .
keywords:
galaxies: active — quasars: individual: PKS 1222+2161 Introduction
PKS 1222+216 (also known as 4C +21.35; ; r; Burbidge & Kinman, 1966; Osterbrock & Pogge, 1987) is a Flat Spectrum Radio Quasar (FSRQ). At radio wavelengths it exhibits a peculiar bended large scale ( kpc) structure and an apparent superluminal motion has been noticed in mas–scale subcomponents of its jet (e.g., Hooimeyer et al., 1992). In –rays a counterpart was found by ROSAT (Brinkmann, Yuan, & Siebert, 1997), and in –rays by EGRET (Hartman et al., 1999).
In the high energy range, PKS 1222+216 has recently shown a particularly active behaviour with flares also in the Very High Energy domain (VHE, i.e. GeV). In April 2009 a first outburst was reported by the Fermi Large Area Telescope (Longo, Giroletti, & Iafrate, 2009) followed, in December 2009, by a larger one observed by both the AGILE Gamma-ray Imaging Detector (Verrecchia et al., 2009) and Fermi (Ciprini, 2009). A further flare in April 2010 reached the VHE (Donato, 2010). This triggered several observations in the TeV region with the ground based Cherenkov telescopes VERITAS and MAGIC, which were unsuccessful. The source was finally detected with MAGIC in June 2010 (Mariotti, 2010; Aleksić et al., 2011), in coincidence with a second huge GeV emission recorded by AGILE and Fermi (Striani et al., 2010; Iafrate, Longo, & D’Ammando, 2010; Tanaka et al., 2011). PKS 1222+216 is the third FSRQ, after 3C279 (z=0.536) and PKS 1510-089 (z=0.36), observed at such high energy. The 30 minutes observation by MAGIC allows a measurement of a variability time–scale of about 10 minutes. The spectral energy distribution of the object and the high variability imply that the jet is relativistic with large beaming factors. Tavecchio et al. (2011) suggest that the origin of the rapidly variable VHE energy emission arose in a small region outside the Broad Line Region (BLR): if this emission were produced within the BLR, the high energy photons would be strongly absorbed by photons from emission lines (see also Böttcher, Reimer, & Marscher, 2009; Nalewajko et al., 2012). Alternatively a more exotic scenario that considers photon/axion transition was proposed by Tavecchio et al. (2012).
The optical and NIR emission of PKS 1222+216 had shown high daily fluctuations, that are not always related to the –ray variability (e.g., Carrasco et al., 2010; Hauser, Wagner, & Hagen, 2010; Nesci & Montagni, 2010; Smith, Schmidt, & Jannuzi, 2011).
In this paper we analyse the optical observations of PKS 1222+216. We study the variability of both continuum and emission lines. From the lines luminosity we deduce the thermal continuum and contrast it with the highly variable jet component. Finally we estimate the virial mass of the black hole from different recipes and lines (i.e., Mg II, H, and H) and compare it with the literature results.
Throughout this paper we consider a concordance cosmology with H km/s/Mpc, , and .
2 Optical spectroscopy
| TNG spectrum | Steward observatory spectra | SDSS spectrum | |
| Jan. 3, 2011 | Apr. 27, 2009 – July 27, 2011 | Jan. 14, 2008 | |
| Lλ(5100Å) | erg/s | erg/s | erg/s |
| Lλ(3000Å) | … | … | erg/s |
| L(H) | erg/s | … | … |
| L(H) | erg/s | erg/s | erg/s |
| L(Mg II) | … | … | erg/s |
| FWHM(H) | km/s | … | … |
| FWHM(H) | km/s | km/s | km/s |
| FWHM(Mg II) | … | … | km/s |
| (H) | … | … | |
| (H) | |||
| (Mg II) | … | … |
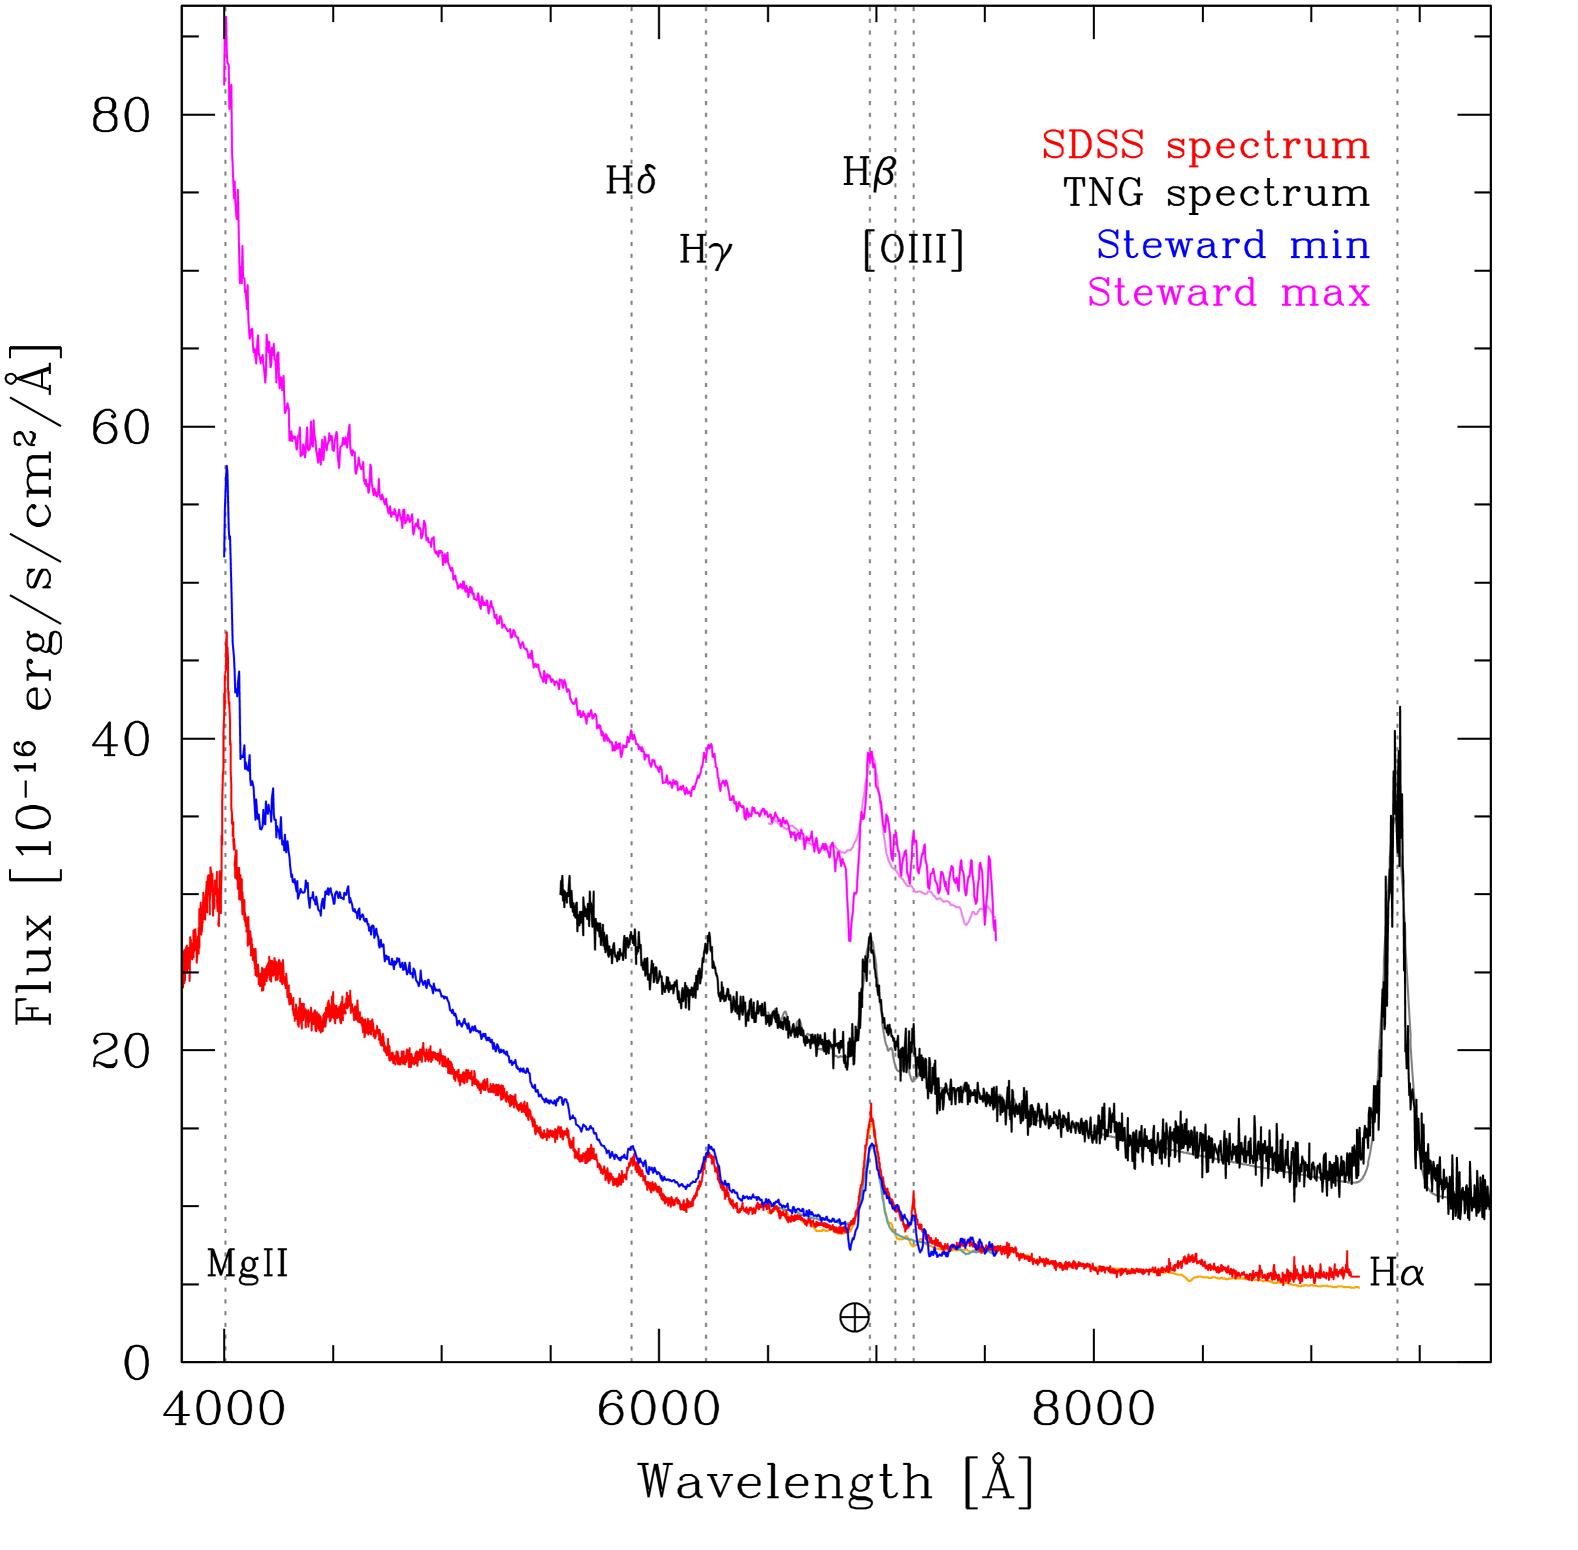
Spectrophotometry with the Hawaii 2.2m telescope was presented by Stockton & MacKenty (1987) who however reported only line and continuum intensities. The source was observed between Å and Å within the Sloan Digital Sky Survey (SDSS; York et al., 2000) in January 2008 and the spectrum is reported in Figure 1.
Optical spectrophotometry and polarimetry was performed at the Steward Observatory with the 2.3m Bok and 1.54m Kuiper telescopes (Smith et al., 2009; Smith, Schmidt, & Jannuzi, 2011). All the data are accessible to the astronomical community111http://james.as.arizona.edu/~psmith/Fermi/. Here we consider the 112 spectra obtained to date in the spectral range Å–Å, calibrated through V photometry and not corrected for telluric absorptions. At wavelengths higher than Å, a strong fringing affects the spectra and prevents a precise analysis of the [OIII]λ5007 narrow line. Two example of these spectra are reported in Figure 1.
We also retrieved some unpublished optical photometry collected between
1995 and 2001222Data available at:
http://www.dfm.uninsubria.it/farina/pks1222.html. The data were acquired with the
105 cm REOSC telescope of the Torino Observatory, equipped with standard
Johnson’s B, V, and Cousins’ R filters and a pixel CCD (EEV)
with a 0.467′′/pixel scale until 2000, and with a
pixel CCD (Loral) with a 0.32′′/pixel scale
thereafter. Frames were reduced with canonical procedures and the source
magnitude calibration was derived with respect to the photometric sequence
published in Raiteri et al. (1998).
Triggered by the MAGIC detection, we observed the source with the 3.58m Telescopio Nazionale Galileo (TNG), La Palma, during the night of January 3, 2011. We used DOLORES (Device Optimised for the LOw RESolution, Molinari, Conconi, & Pucillo, 1997) in spectroscopy configuration with the 20482048 pixel detector. Observations were carried out with LR–R grism, yielding a spectral resolution of R=714 (1′′ slit) in the nominal spectral range 4470Å–10073Å (/pxl=2.61Å/pxl). During the 1050 s of total exposure time the mean seeing was and the transparency was not optimal. Standard IRAF333IRAF is distributed by the National Optical Astronomy Observatories, which are operated by the Association of Universities for Research in Astronomy, Inc., under cooperative agreement with the National Science Foundation. tools were used in the data reduction. The ccdred package was employed to perform bias subtraction, flat field correction, image alignment and combination. The accuracy in the wavelength calibration is around Å. Galactic extinction was accounted for according to Schlegel, Finkbeiner, & Davis (1998, E(B-V)=0.023 mag). Telluric absorption bands were corrected with two spectrophotometric standard stars. One observed immediately after PKS 1222+216, and one collected with the same telescope configuration but in better weather conditions, on January 6, 2011. The feature at 7200Å coincidentally corresponds to the [OIII]λ5007 emission at the redshift of the blazar, affecting the measure of this line. Investigating the region over 8000Å, where the H line resides, is delicate due to a number of factors: the response function of LR–R presents a strong local decrease and an apparent fringing is superimposed to the spectra. Moreover the strong water vapour absorption feature at 9360 Å falls within the H broad line. The flux calibration was performed through the photometry obtained at Steward observatory which has been interpolated within few hours. The spectrum obtained (average Signal–to–Noise ratio ) is presented in Figure 1.
For the analysis of spectroscopic data we followed the procedure presented in Decarli et al. (2010) and De Rosa et al. (2011). Namely, we have first subtracted the continuum designed as a superposition of: (i) the non thermal component modelled with a power–law, (ii) the host galaxy emission (adopting the Elliptical galaxy model by Mannucci et al., 2001), and (iii) the Fe II multiplets (from the template of Vestergaard & Wilkes 2001 in the UV band and from our original spectrum of IZw001 in optical). Broad emission lines have been fitted with two Gaussian curves with the same central wavelength (see Decarli et al., 2008), assuming the contribution of the narrow component as negligible. Errors on the estimated parameters have been derived considering the 1 uncertainties from both line and continuum fits.
The analysis of Steward observatory spectra required particular care. For this data we have fitted the continuum excluding the region beyond 7000Å, where the fringing dramatically decreases the quality of the spectra. The luminosity of the continuum at 5100Å was estimated by extrapolating the power–law up to this value. In order to not underestimate the measures of the H flux and FWHM the fit was performed excluding the region between 6850Å and 6930Å where the strong O2 atmospheric feature affects the blue wing of the emission line.
In Table 1 we report the continuum luminosity at 3000Å and 5100Å, the luminosity and FWHM of Mg II, H, and H when present. Relevant data from analysis of each Steward observatory spectrum are in Table 2.
| Date | Lλ | L | FWHM | Lλ(H) | Date | Lλ | L | FWHM | Lλ(H) | |
|---|---|---|---|---|---|---|---|---|---|---|
| [ erg/s] | [ erg/s] | [km/s] | [ erg/s] | [ erg/s] | [ erg/s] | [km/s] | [ erg/s] | |||
| 2009/04/27 | 451 | 41 3 | 3945 86 | 27 | 2010/05/16 | 601 | 44 5 | 3604428 | 29 | |
| 2009/04/29 | 441 | 43 4 | 4288172 | 28 | 2010/05/17 | 712 | 39 6 | 3263684 | 26 | |
| 2009/04/30 | 441 | 44 3 | 4288 86 | 29 | 2010/05/20 | 752 | 42 7 | 3433599 | 27 | |
| 2009/05/01 | 431 | 41 2 | 3947172 | 27 | 2010/06/10 | 762 | 43 7 | 3941684 | 29 | |
| 2009/05/02 | 351 | 40 2 | 4288342 | 27 | 2010/06/11 | 742 | 51 6 | 4455171 | 33 | |
| 2009/11/17 | 572 | 37 5 | 3436172 | 24 | 2010/06/12 | 702 | 48 6 | 4466258 | 31 | |
| 2009/12/15 | 741 | 42 5 | 3948173 | 28 | 2010/06/13 | 712 | 49 7 | 4294173 | 33 | |
| 2009/12/17 | 701 | 45 5 | 3946259 | 30 | 2010/06/14 | 681 | 49 6 | 4289172 | 32 | |
| 2009/12/18 | 731 | 46 5 | 3778 86 | 30 | 2010/06/15 | 752 | 46 5 | 4294173 | 30 | |
| 2009/12/19 | 721 | 37 4 | 2922171 | 24 | 2010/06/16 | 871 | 45 6 | 3950429 | 30 | |
| 2009/12/20 | 761 | 42 4 | 3264172 | 28 | 2010/07/07 | 832 | 38 6 | 3605600 | 25 | |
| 2010/01/14 | 461 | 43 5 | 3950428 | 28 | 2010/11/10 | 521 | 49 6 | 4122515 | 33 | |
| 2010/01/15 | 461 | 42 3 | 3949601 | 28 | 2010/11/11 | 532 | 47 6 | 3779428 | 31 | |
| 2010/02/13 | 1142 | 41 7 | 3947429 | 27 | 2010/11/12 | 532 | 49 3 | 3607344 | 33 | |
| 2010/02/14 | 1172 | 42 7 | 3948515 | 28 | 2010/11/13 | 532 | 41 3 | 3265 86 | 27 | |
| 2010/02/15 | 1173 | 49 8 | 4288172 | 33 | 2010/11/15 | 492 | 48 3 | 3951172 | 32 | |
| 2010/02/15 | 1184 | 61 9 | 4800343 | 40 | 2010/12/01 | 411 | 45 7 | 3946230 | 30 | |
| 2010/02/15 | 1213 | 57 9 | 4630342 | 38 | 2010/12/02 | 451 | 42 6 | 3605429 | 28 | |
| 2010/02/16 | 1102 | 51 9 | 4289513 | 33 | 2010/12/05 | 541 | 42 5 | 3434172 | 28 | |
| 2010/02/16 | 1143 | 54 9 | 4460343 | 36 | 2010/12/08 | 511 | 43 3 | 3436257 | 29 | |
| 2010/02/16 | 1152 | 4610 | 4288515 | 30 | 2010/12/09 | 491 | 45 6 | 3264258 | 30 | |
| 2010/02/17 | 1163 | 52 7 | 4288257 | 35 | 2011/01/02 | 902 | 49 4 | 4118427 | 33 | |
| 2010/02/17 | 1252 | 41 8 | 3947428 | 27 | 2011/01/04 | 752 | 52 3 | 4118172 | 34 | |
| 2010/02/17 | 1172 | 48 6 | 4291172 | 32 | 2011/01/08 | 1042 | 48 5 | 4289 86 | 32 | |
| 2010/02/18 | 1302 | 4810 | 4459429 | 32 | 2011/02/02 | 501 | 43 2 | 3265 87 | 28 | |
| 2010/02/18 | 1192 | 59 8 | 4799257 | 39 | 2011/02/03 | 501 | 44 2 | 3437121 | 29 | |
| 2010/02/19 | 1203 | 52 5 | 4458310 | 34 | 2011/02/05 | 501 | 45 3 | 3609344 | 30 | |
| 2010/02/19 | 1282 | 4110 | 3775598 | 27 | 2011/02/07 | 491 | 43 3 | 3437343 | 28 | |
| 2010/03/15 | 481 | 42 5 | 3779600 | 28 | 2011/02/08 | 501 | 43 2 | 3609173 | 29 | |
| 2010/03/15 | 491 | 40 6 | 3263258 | 27 | 2011/03/02 | 1293 | 49 6 | 3953428 | 32 | |
| 2010/03/16 | 501 | 42 6 | 3607429 | 28 | 2011/03/04 | 1432 | 43 7 | 3433428 | 28 | |
| 2010/03/16 | 481 | 41 6 | 3603343 | 27 | 2011/03/04 | 1522 | 39 6 | 3261343 | 26 | |
| 2010/03/17 | 471 | 45 9 | 4289514 | 30 | 2011/03/05 | 1203 | 60 8 | 4288599 | 40 | |
| 2010/03/17 | 481 | 40 6 | 3607258 | 26 | 2011/03/05 | 1213 | 62 7 | 4632257 | 41 | |
| 2010/03/18 | 511 | 43 8 | 3605428 | 28 | 2011/03/06 | 1292 | 43 7 | 2919343 | 28 | |
| 2010/03/18 | 501 | 43 4 | 3948428 | 29 | 2011/03/06 | 1312 | 4211 | 2920428 | 28 | |
| 2010/03/19 | 531 | 46 5 | 3607344 | 31 | 2011/03/08 | 1152 | 38 6 | 3263429 | 25 | |
| 2010/03/19 | 521 | 41 6 | 3435257 | 27 | 2011/03/29 | 552 | 48 4 | 4290256 | 32 | |
| 2010/03/20 | 541 | 42 4 | 3774428 | 28 | 2011/03/30 | 583 | 51 7 | 4289599 | 33 | |
| 2010/03/20 | 531 | 45 3 | 3259174 | 29 | 2011/04/04 | 581 | 45 4 | 3609172 | 29 | |
| 2010/03/21 | 511 | 43 5 | 3779428 | 28 | 2011/04/05 | 583 | 45 5 | 3090343 | 30 | |
| 2010/03/21 | 551 | 41 6 | 3435429 | 27 | 2011/04/06 | 542 | 48 7 | 2746600 | 31 | |
| 2010/04/05 | 731 | 38 8 | 3262258 | 25 | 2011/04/08 | 562 | 44 5 | 3261257 | 29 | |
| 2010/04/05 | 742 | 40 6 | 3606515 | 26 | 2011/05/26 | 722 | 44 5 | 3265172 | 29 | |
| 2010/04/06 | 732 | 44 6 | 3945685 | 29 | 2011/05/27 | 732 | 47 5 | 3431598 | 31 | |
| 2010/04/06 | 733 | 40 5 | 3262172 | 26 | 2011/05/28 | 721 | 47 3 | 3433428 | 31 | |
| 2010/04/07 | 732 | 39 5 | 3263172 | 26 | 2011/05/29 | 742 | 45 4 | 4120256 | 30 | |
| 2010/04/07 | 701 | 41 7 | 3606258 | 27 | 2011/05/30 | 702 | 48 4 | 3776686 | 32 | |
| 2010/04/08 | 692 | 41 6 | 3606429 | 27 | 2011/06/14 | 872 | 48 5 | 3088172 | 32 | |
| 2010/04/09 | 741 | 45 7 | 3948514 | 29 | 2011/06/15 | 802 | 49 4 | 3263684 | 33 | |
| 2010/04/09 | 742 | 39 6 | 3433172 | 26 | 2011/06/26 | 781 | 46 7 | 3779771 | 30 | |
| 2010/04/10 | 811 | 43 8 | 3263428 | 28 | 2011/06/27 | 782 | 49 2 | 4455171 | 32 | |
| 2010/04/10 | 792 | 39 5 | 3262430 | 26 | 2011/06/28 | 792 | 53 4 | 4292599 | 35 | |
| 2010/04/11 | 892 | 45 9 | 4289771 | 30 | 2011/07/01 | 931 | 44 3 | 3090 86 | 29 | |
| 2010/04/11 | 862 | 40 8 | 3262257 | 26 | 2011/07/02 | 1013 | 39 2 | 2575 86 | 26 | |
| 2010/05/14 | 642 | 43 6 | 3945428 | 28 | 2011/07/27 | 603 | 43 3 | 2746 85 | 28 |
3 Thermal continuum and black hole mass
In the usual unification scheme of AGNs (e.g., Urry & Padovani, 1995), the relativistic jet of a blazar is viewed closely along the observer line of sight. Thus, the continuum in radio to optical/UV spectral range is dominated by a highly polarised non–thermal synchrotron radiation emitted by the energetic electrons in the jet superimposed to the thermal emission associated to the disk (e.g., Konigl, 1981; Urry & Mushotzky, 1982, and specifically for PKS 1222+216 Smith, Schmidt, & Jannuzi 2011).
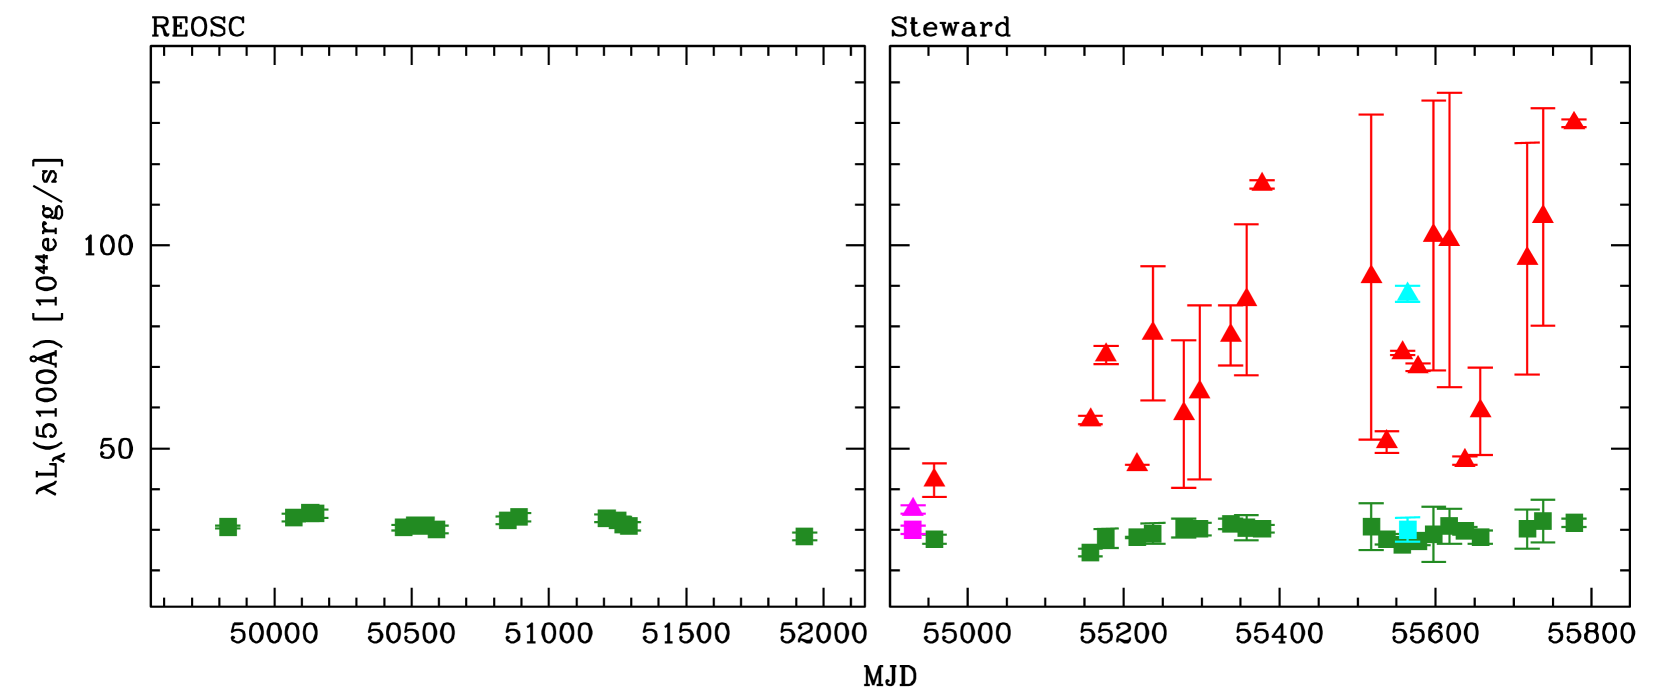
In the last three years covered by the data, the continuum luminosity at 5100Å varied in the range – erg/s. The REOSC photometry, collected before 2003, corresponds to a status of minimum activity (V). From these data we infer an average colour index which, assuming a power–law optical spectrum , translates into a spectral index . This implies a flat optical spectrum in the versus plot, suggesting a prevailing contribution of thermal emission from the accretion disc over the synchrotron one.
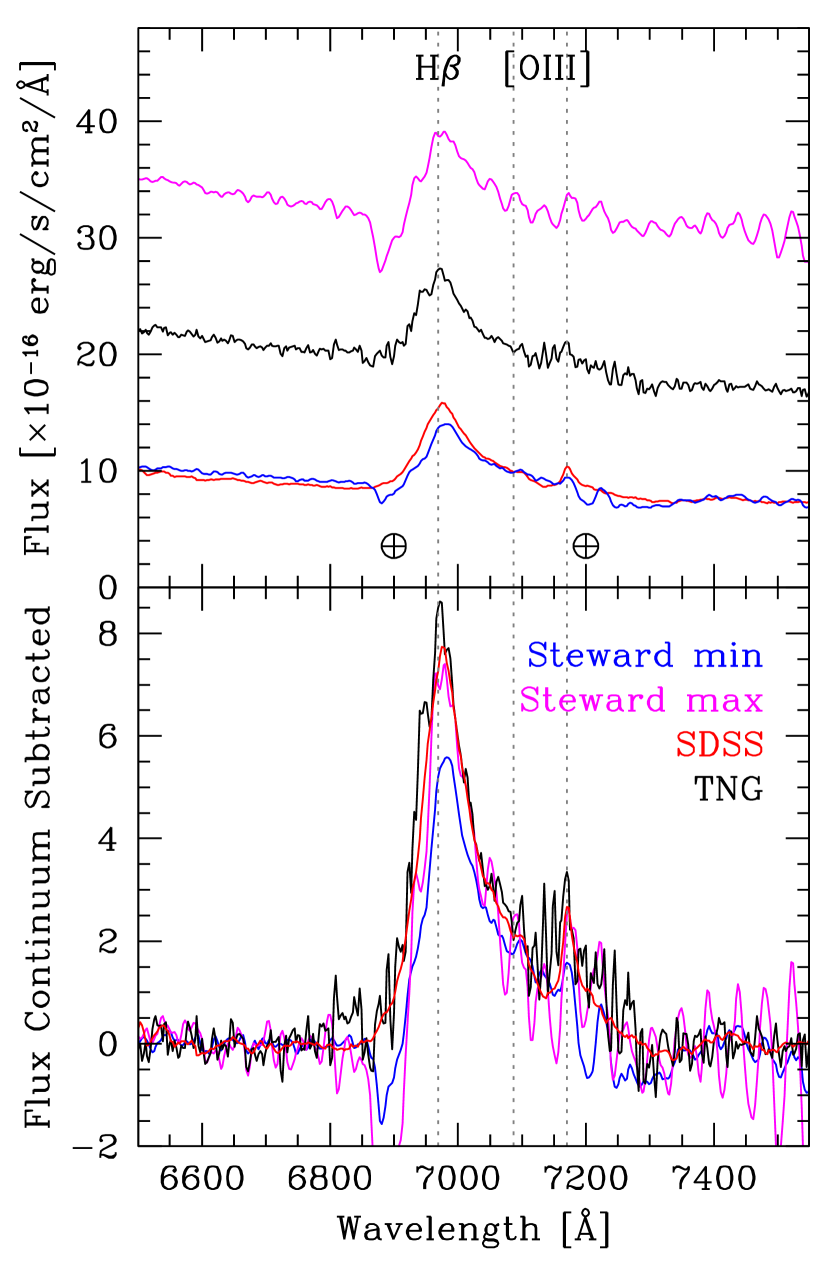
Smith, Schmidt, & Jannuzi (2011) have shown that the H luminosity in the Steward observatory sample is practically constant while the continuum is highly variable (see Figure 2). This is is in good agreement with the SDSS and TNG spectra (see Figure 3). The H luminosity mean value is erg/s with an rms of erg/s. As noted by Smith, Schmidt, & Jannuzi (2011) the constancy of the H line indicates that the broad line region is marginally affected by the huge variability of the jet. This conclusion is confirmed by our analysis that consider a larger number of spectra.
In order to evaluate the mass of the black hole we consider the virial approach by assuming the FWHM as a measure of the virial velocity and the thermal continuum luminosity as a proxy for the distance of the clouds from the black hole, since the observed continuum may be dominated by the jet emission. We calculate the thermal continuum through the relation with broad line luminosities found on QSOs (e.g., Greene & Ho, 2005; Vestergaard & Peterson, 2006; Decarli, Dotti, & Treves, 2011). We calibrate the ratio for H and continuum at 5100Å basing on the Shen et al. (2011) QSO property catalogue. The low luminosities objects () show a significant contamination from the host galaxy a thus are removed from the analysis. A similar cut is applied also to the luminosity of the lines, since faint lines are less reliable due to the contaminations from narrow emission. Average and rms values of the ratio are:
| (1) |
The thermal continuum deduced from H line luminosity ( erg/s with an rms of erg/s) corresponds to the lower observed states of Table 1 (see Figure 2). The virial mass can be expressed as:
| (2) |
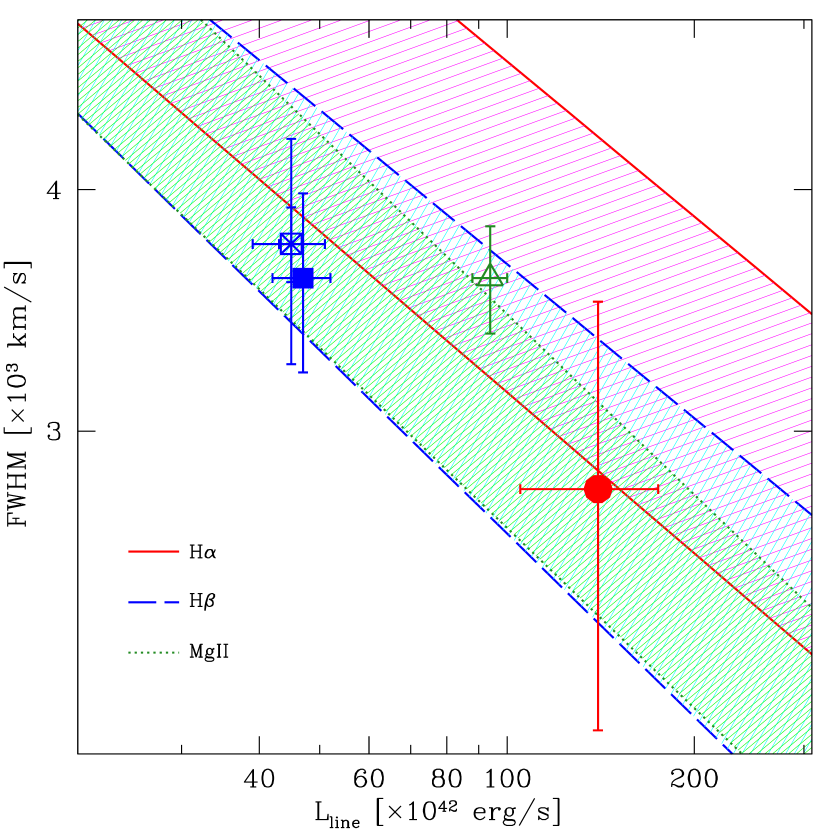
where the coefficients , , and , calibrated on local AGN with an estimate of the mass through the reverberation mapping technique, depend on the broad line considered. The uncertainties associated to these measures of the mass are very large ( dex) and are dominated by the dispersion of the relations between the radius of the BLR and the thermal continuum luminosity (e.g., Vestergaard & Peterson, 2006; Shen et al., 2011). In order to compare different estimate we consider calibrations presented by McLure & Dunlop (2004), Greene & Ho (2005), Kaspi et al. (2005), Vestergaard & Peterson (2006), Shen et al. (2011), Vestergaard & Osmer (2009), and Decarli, Dotti, & Treves (2011). Average black hole masses estimated for each emission line are in Table 1, and in Figure 4 we compare the various recipes considered to determine these values. Our measurements are consistent with , regardless of the relation considered.
4 Summary and Conclusions
We investigate the variability of broad lines of PKS 1222+216 through the analysis of spectra collected in a period of more than 3 years. The H line remains almost unchanged despite multiple flaring in both optical and –rays. This is consistent with the scenario proposed by Tavecchio et al. (2011) in which the intense and rapidly variable VHE emission is located at large distance ( pc) from the BLR (but see: Tavecchio et al., 2012).
Since the BLR emission is almost stable, we estimate the virial black hole mass following various recipes, and from Mg II, H and H, we find that is . This mass is close to that proposed by Shen et al. (2011) on the basis of SDSS continuum which in fact corresponded to a low state, but it is significantly higher than the mass proposed by Wang, Luo, & Ho (2004) and reported by Tanaka et al. (2011). This possibly derives from Stockton & MacKenty (1987), where however no information is reported on the FWHM of H.
The black hole mass of PKS 1222+216 does not substantially deviate from the mass distribution of the populations of FSRQ at the same redshift (, Shaw et al., 2012). Because of its redshift we expect that dedicated infrared observations of the source with a medium size telescope should enable the detection of the host galaxy, in particular in case of low optical–NIR emission activity: i.e. if the nuclear luminosity does not overcome the host galaxy luminosity by more than a factor of (e.g., Kotilainen, Falomo, & Scarpa, 1998; Meisner & Romani, 2010; Kotilainen et al., 2011). From that an independent estimate of the black hole mass may follow.
Acknowledgements
We would like to thank the anonymous referee for his/her valuable and constructive comments. EPF acknowledge R. Scarpa for his support during observations at TNG.
For this work EPF was supported by Società Carlo Gavazzi S.p.A. and by Thales Alenia Space Italia S.p.A. RD acknowledges funding from Germany’s national research centre for aeronautics and space (DLR, project FKZ 50 OR 1104). We acknowledge financial contribution from the agreement ASI-INAF I/009/10/0.
For this work we use: (i) observations made with the Italian Telescopio Nazionale Galileo (TNG) operated on the island of La Palma by the Fundación Galileo Galilei of the INAF (Istituto Nazionale di Astrofisica) at the Spanish Observatorio del Roque de los Muchachos of the Instituto de Astrofisica de Canarias; (ii) data from the Steward Observatory spectropolarimetric monitoring project were used, this program is supported by Fermi Guest Investigator grants NNX08AW56G and NNX09AU10G; (iii) data from the Sloan Digital Sky Survey. Funding for the SDSS and SDSS-II has been provided by the Alfred P. Sloan Foundation, the Participating Institutions, the National Science Foundation, the U.S. Department of Energy, the National Aeronautics and Space Administration, the Japanese Monbukagakusho, the Max Planck Society, and the Higher Education Funding Council for England. The SDSS Web Site is http://www.sdss.org/.
References
- Aleksić et al. (2011) Aleksić J., et al., 2011, ApJ, 730, L8
- Böttcher, Reimer, & Marscher (2009) Böttcher M., Reimer A., Marscher A. P., 2009, ApJ, 703, 1168
- Burbidge & Kinman (1966) Burbidge E. M., Kinman T. D., 1966, ApJ, 145, 654
- Brinkmann, Yuan, & Siebert (1997) Brinkmann W., Yuan W., Siebert J., 1997, A&A, 319, 413
- Carrasco et al. (2010) Carrasco L., Carramiñana A., Recillas E., Porras A., Mayya D. Y., 2010, ATel, 2626,
- Ciprini (2009) Ciprini S., 2009, ATel, 2349, 1
- Decarli et al. (2008) Decarli R., Labita M., Treves A., Falomo R., 2008, MNRAS, 387, 1237
- Decarli et al. (2010) Decarli R., Falomo R., Treves A., Kotilainen J. K., Labita M., Scarpa R., 2010, MNRAS, 402, 2441
- Decarli, Dotti, & Treves (2011) Decarli R., Dotti M., Treves A., 2011, MNRAS, 413, 39
- De Rosa et al. (2011) De Rosa G., Decarli R., Walter F., Fan X., Jiang L., Kurk J., Pasquali A., Rix H. W., 2011, ApJ, 739, 56
- Donato (2010) Donato D., 2010, ATel, 2584, 1
- Greene & Ho (2005) Greene J. E., Ho L. C., 2005, ApJ, 630, 122
- Hartman et al. (1999) Hartman R. C., et al., 1999, ApJS, 123, 79
- Hauser, Wagner, & Hagen (2010) Hauser M., Wagner S., Hagen H., 2010, ATel, 2436, 1
- Hooimeyer et al. (1992) Hooimeyer J. R. A., Schilizzi R. T., Miley G. K., Barthel P. D., 1992, A&A, 261, 5
- Iafrate, Longo, & D’Ammando (2010) Iafrate G., Longo F., D’Ammando F., 2010, ATel, 2687, 1
- Kaspi et al. (2005) Kaspi S., Maoz D., Netzer H., Peterson B. M., Vestergaard M., Jannuzi B. T., 2005, ApJ, 629, 61
- Konigl (1981) Konigl A., 1981, ApJ, 243, 700
- Kotilainen, Falomo, & Scarpa (1998) Kotilainen J. K., Falomo R., Scarpa R., 1998, A&A, 336, 479
- Kotilainen et al. (2011) Kotilainen J. K., Hyvönen T., Falomo R., Treves A., Uslenghi M., 2011, A&A, 534, L2
- Longo, Giroletti, & Iafrate (2009) Longo F., Giroletti M., Iafrate G., 2009, ATel, 2021, 1
- Mannucci et al. (2001) Mannucci F., Basile F., Poggianti B. M., Cimatti A., Daddi E., Pozzetti L., Vanzi L., 2001, MNRAS, 326, 745
- Mariotti (2010) Mariotti M., 2010, ATel, 2684, 1
- McLure & Dunlop (2004) McLure R. J., Dunlop J. S., 2004, MNRAS, 352, 1390
- Meisner & Romani (2010) Meisner A. M., Romani R. W., 2010, ApJ, 712, 14
- Molinari, Conconi, & Pucillo (1997) Molinari E., Conconi P., Pucillo M., 1997, MmSAI, 68, 231
- Nalewajko et al. (2012) Nalewajko K., Begelman M. C., Cerutti B., Uzdensky D. A., Sikora M., 2012, arXiv, arXiv:1202.2123
- Nesci & Montagni (2010) Nesci R., Montagni F., 2010, ATel, 2708, 1
- Osterbrock & Pogge (1987) Osterbrock D. E., Pogge R. W., 1987, ApJ, 323, 108
- Raiteri et al. (1998) Raiteri C. M., Villata M., Lanteri L., Cavallone M., Sobrito G., 1998, A&AS, 130, 495
- Schlegel, Finkbeiner, & Davis (1998) Schlegel D. J., Finkbeiner D. P., Davis M., 1998, ApJ, 500, 525
- Smith et al. (2009) Smith P. S., Montiel E., Rightley S., Turner J., Schmidt G. D., Jannuzi B. T., 2009, arXiv, arXiv:0912.3621
- Smith, Schmidt, & Jannuzi (2011) Smith P. S., Schmidt G. D., Jannuzi B. T., 2011, arXiv, arXiv:1110.6040
- Shaw et al. (2012) Shaw M. S., et al., 2012, arXiv, arXiv:1201.0999
- Shen et al. (2011) Shen Y., et al., 2011, ApJS, 194, 45
- Stockton & MacKenty (1987) Stockton A., MacKenty J. W., 1987, ApJ, 316, 584
- Striani et al. (2010) Striani E., et al., 2010, ATel, 2686, 1
- Tanaka et al. (2011) Tanaka Y. T., et al., 2011, ApJ, 733, 19
- Tavecchio et al. (2011) Tavecchio F., Becerra-Gonzalez J., Ghisellini G., Stamerra A., Bonnoli G., Foschini L., Maraschi L., 2011, A&A, 534, A86
- Tavecchio et al. (2012) Tavecchio F., Roncadelli M., Galanti G., Bonnoli G., 2012, arXiv, arXiv:1202.6529
- Urry & Mushotzky (1982) Urry C. M., Mushotzky R. F., 1982, ApJ, 253, 38
- Urry & Padovani (1995) Urry C. M., Padovani P., 1995, PASP, 107, 803
- Verrecchia et al. (2009) Verrecchia F., et al., 2009, ATel, 2348, 1
- Vestergaard & Wilkes (2001) Vestergaard M., Wilkes B. J., 2001, ApJS, 134, 1
- Vestergaard & Osmer (2009) Vestergaard M., Osmer P. S., 2009, ApJ, 699, 800
- Vestergaard & Peterson (2006) Vestergaard M., Peterson B. M., 2006, ApJ, 641, 689
- York et al. (2000) York D. G., et al., 2000, AJ, 120, 1579
- Wang, Luo, & Ho (2004) Wang J.-M., Luo B., Ho L. C., 2004, ApJ, 615, L9