Energy Efficient Service Delivery in Clouds in Compliance with the Kyoto Protocol
Abstract
Cloud computing is revolutionizing the ICT landscape by providing scalable and efficient computing resources on demand. The ICT industry – especially data centers, are responsible for considerable amounts of emissions and will very soon be faced with legislative restrictions, such as the Kyoto protocol, defining caps at different organizational levels (country, industry branch etc.) A lot has been done around energy efficient data centers, yet there is very little work done in defining flexible models considering . In this paper we present a first attempt of modeling data centers in compliance with the Kyoto protocol. We discuss a novel approach for trading credits for emission reductions across data centers to comply with their constraints. caps can be integrated with Service Level Agreements and juxtaposed to other computing commodities (e.g. computational power, storage), setting a foundation for implementing next-generation schedulers and pricing models that support Kyoto-compliant trading schemes.
1 Introduction
With the global advent of cloud, grid, cluster computing and increasing needs for large data centers to run these services, the environmental impact of large-scale computing paradigms is becoming a global problem. The energy produced to power the ICT industry (and data centers constitute its major part) is responsible for 2% of all the carbon dioxide equivalent ( – greenhouse gases normalized to carbon dioxide by their environmental impact) emissions [6], thus accelerating global warming [11].
Cloud computing facilitate users to buy computing resources from a cloud provider and specify the exact amount of each resource (such as storage space, number of cores etc.) that they expect through a Service Level Agreement (SLA)111We consider the traditional business model where the desired specifications are set in advance, as is still the case in most infrastructure-as-a-service clouds.. The cloud provider then honors this agreement by providing the promised resources to avoid agreement violation penalties (and to keep the customer satisfied to continue doing business). However, cloud providers are usually faced with the challenge of satisfying promised SLAs and at the same time not wasting their resources as a user very rarely utilizes computing resources to the maximum [14].
In order to fight global warming the Kyoto protocol was established by the United Nations Framework Convention on Climate Change (UNFCCC or FCCC). The goal is to achieve global stabilisation of greenhouse gas concentrations in the atmosphere at a level that would prevent dangerous anthropogenic interference with the climate system [13]. The protocol defines control mechanisms to reduce emissions by basically setting a market price for such emissions. Currently, flexible models for trading are developed at different organizational and political level as for example at the level of a country, industry branch, or a company. As a result, keeping track of and reducing emissions is becoming more and more relevant after the ratification of the Kyoto protocol.
Energy efficiency has often been a target for research. On the one hand, there is large body of work done in facilitating energy efficient management of data centers as for example in [8] where current state of formal energy efficiency control in cloud computing relies on monitoring power usage efficiency (PUE) and the related family of metrics developed by the Green Grid Consortium. Another example is discussed in [15] where economic incentives are presented to promote greener cloud computing policies. On the other hand, there are several mature models for trading obligations in various industrial branches, as for example in the oil industry [17]. Surprisingly, to the best of our knowledge there exists no related work about the application of the Kyoto protocol to energy efficient modeling of data centers and cloud infrastructures.
In this paper we propose a -trading model for transparent scheduling of resources in cloud computing adhering to the Kyoto protocol guidelines [17]. First, we present a conceptual model for trading compliant to the Kyoto protocol’s emission trading scheme. We consider an emission trading market (ETM) where credits for emission reduction (CERs) are traded between data centers. Based on the positive or negative CERs of the data center, a cost is set for the environmental impact of the energy used by applications. Thereby, a successful application scheduing decission can be brought after considering the (i) energy costs, (ii) costs and (iii) SLA violation costs. Second, we propose a wastage-penalty model that can be used as a basis for the implementation of Kyoto protocol-compliant scheduling and pricing models. Finally, we discuss potential uses of the model as an optimisation heuristic in the resource scheduler.
The main contribution of the paper are (1) definition of the conceptual emission trading market (ETM) for the application of Kyoto protocol for the energy efficiency management in Clouds (2) definition of a wastage - penalty model for trading of credits for emission reduction (CERs) (3) discussion on how the presented wastage-penalty model can be used for the implementation of next generation Kyoto protocol compliant energy efficient schedulers and pricing models.
The paper is structured as follows: Section 2 discusses related work. Section 3 gives some background as to why cloud computing might become subject to the Kyoto protocol. Section 4 presents our model in a general -trading cloud scenario, we then go on to define a formal model of individual costs to find a theoretical balance and discuss the usefulness of such a model as a scheduling heuristic. Section 5 concludes the paper and identifies possible future research directions.
2 Related Work
As our aim is to enable energy efficiency control in the cloud resource scheduling domain, there are two groups of work related to ours that deal with the problem:
-
1.
scheduling algorithms - resource allocation techniques, from which energy cost optimisation is starting to evolve
-
2.
energy efficiency legislation - existing rules, regulations and best behaviour suggestions that are slowly moving from optimising the whole data center efficiency towards optimising its constituting parts
We will examine each of these two groups separately now.
2.1 Scheduling Algorithms
There already exist cloud computing energy efficient scheduling solutions, such as [21, 20] which try to minimize energy consumption, but they lack a strict quantitative model similar to PUE that would be convenient as a legislative control measure to express exactly how much they alter emission levels. From the management perspective, these methods work more in a best-effort manner, attempting first and foremost to satisfy SLA constrains.
In [16] the HGreen heuristic is proposed to schedule batch jobs on the greenest resource first, based on prior energy efficiency benchmarking of all the nodes, but not how to optimize a job once it is allocated to a node - how much of its resources is it allowed to consume. A similar multiple-node-oriented scheduling algorithm is presented in [22].
The work described in [15] has the most similarities with ours, since it also balances SLA and energy constraints and even describes energy consumption using a similar, linear model motivated by dynamic voltage scaling, but no consideration of management was made inside the model.
A good overview of cloud computing and sustainability is given in [18], with explanations of where cloud computing stands in regard to emissions. Green policies for scheduling are proposed that, if accepted by the user, could greatly increase the efficiency of cloud computing and reduce emissions. Reducing emissions is not treated as a source of profit and a possible way to balance SLA violations, though, but more of a general guideline for running the data center to stay below a certain threshold.
2.2 Energy Efficiency Legislation
Measures of controlling energy efficiency in data centers do exist – metrics such as power usage efficiency (PUE) [10], carbon usage efficiency (CUE), water usage efficiency (WUE) [9] and others have basically become the industry standards through the joint efforts of policy makers and cloud providers gathered behind The Green Grid consortium [8]. The problem with these metrics, though, is that they only focus on the infrastructure efficiency – turn as much energy as possible into computing inside the IT equipment. Once the power gets to the IT equipment, though, all formal energy efficiency regulation stops, making it more of a black-box approach. For this reason, an attempt is made in our work to bring energy efficiency control to the interior operation of clouds – resource scheduling.
So far, the measurement and control of even such a basic metric as PUE is not mandatory. It is considered a best practice, though, and agencies such as the U.S. Environmental Protection Agency (EPA) encourage data centers to measure it by rewarding the best data centers with the Energy Star award [2].
3 Applying the Kyoto Protocol to Clouds
The Kyoto protocol [19] commits involved countries to stabilize their greenhouse gas (GHG) emissions by adhering to the measures developed by the United Nations Framework Convention on Climate Change (UNFCCC) [12]. These measures are commonly known as the cap-and-trade system. It is based on setting national emission boundaries – caps, and establishing international emission markets for trading emission surpluses and emission deficits. This is known as certified emission reductions or credits for emission reduction (CERs). Such a trading system rewards countries which succeeded in reaching their goal with profits from selling CERs and forces those who did not to make up for it financially by buying CERs. The European Union Emission Trading System (EU ETS) is an example implementation of an emission trading market [4]. Through such markets, CERs converge towards a relatively constant market price, same as all the other tradable goods.
Individual countries control emissions among their own large polluters (individual companies such as power generation facilities, factories…) by distributing the available caps among them. In the current implementation, though, emission caps are only set for entities which are responsible for more than 25 Mt/year [3]. This excludes individual data centers which have a carbon footprint in the kt/year range [1].
It is highly possible, though, that the Kyoto protocol will expand to smaller entities such as cloud providers to cover a larger percentage of polluters and to increase the chance of global improvement. One such reason is that currently energy producers take most of the weight of the protocol as they cannot pass the responsibilities on to their clients (some of which are quite large, such as data centers). In 2009, three companies in the EU ETS with the largest shortage of carbon allowances were electricity producers [5]. Another indicator of the justification of this forecast is that some cloud providers, such as Google already participate in emission trading markets to achieve carbon neutrality [7].
For this reason, we hypothesize in this paper that cloud providers are indeed part of an emission trading scheme and that emissions have a market price.
4 Wastage-Penalty Balance in a Kyoto-Compliant Cloud
In this section we present our -trading model that is to be integrated with cloud computing. We show how an economical balance can be found in it. Lastly, we give some discussion as to how such information might be integrated into a scheduler to make it more energy and cost efficient.
4.1 The -Trading Model
The goal of our model is to integrate the Kyoto protocol’s trading mechanism with the existing cloud computing service-oriented paradigm. At the same time we want to use these two aspects of cloud computing to express an economical balance function that can help us make better decisions in the scheduling process.
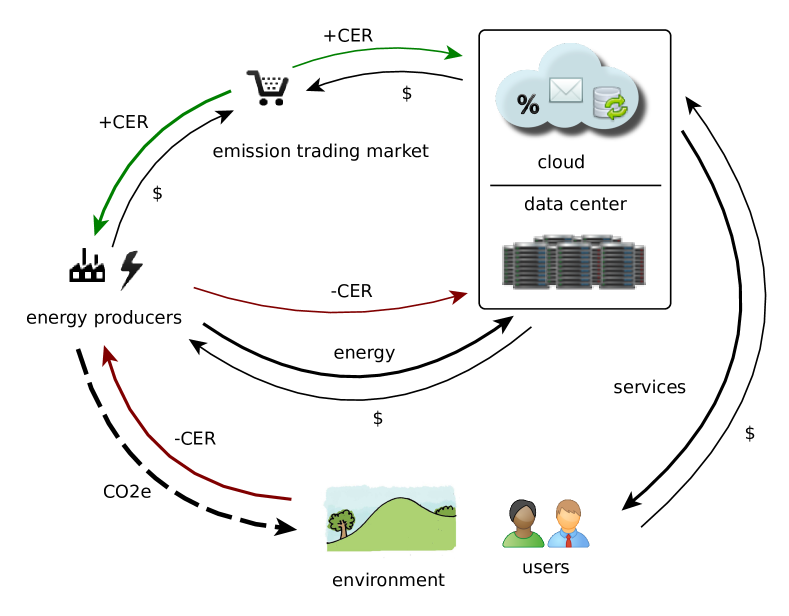
The model diagram in Fig. 1 shows the entities in our model and their relations. A cloud offers some computing resources as services to its users and they in turn pay the cloud provider for these services. Now, a cloud is basically some software running on machines in a data center. To operate, a data center uses electrical energy that is bought from an energy producer. The energy producers are polluters as they emit into the atmosphere. As previously explained, to mitigate this pollution, energy producers are bound by the Kyoto protocol to keep their emissions bellow a certain threshold and buy CERs for all the excess emissions from other entities that did not reach their caps yet over the emission trading market (ETM). This is illustrated by getting negative CERs (-CERs) for responsibilities and having to buy the same amount of positive CERs (+CERs) over the ETM. It does not make any real difference for our model if an entity reaches its cap or not, as it can sell the remaining allowance as CERs to someone else over the ETM. Most importantly, this means that emissions an entity is responsible for have a price.
The other important thing to state in our model is that emission responsibilities for the energy that was bought is transferred from the energy producer to the cloud provider. This is shown in Fig. 1 by energy producers passing some amount of -CERs to the cloud provider along with the energy that was bought. The cloud provider then has to buy the same amount of +CERs via the ETM (or he will be able to sell them if he does not surpass his cap making them equally valuable).
The consequences of introducing this model are that three prices influence the cloud provider: (1) energy cost; (2) cost; (3) service cost. To maximize profit, the cloud provider is motivated to decrease energy and costs and maximize earnings from selling his service. Since the former is achieved by minimizing resource usage to save energy and the latter by having enough resources to satisfy the users’ needs, they are conflicting constraints. Therefore, an economical balance is needed to find exactly how much resources to provide.
The service costs are much bigger than both of the other two combined (that is the current market state at least, otherwise cloud providers would not operate), so they cannot be directly compared. There are different ways a service can be delivered, though, depending on how the cloud schedules resources. The aim of a profit-seeking cloud provider is to deliver just enough resources to the user so that his needs are fullfilled and that the energy wastage stays minimal. If a user happens to be tricked out of too much of the resources initially sold to him, a service violation occurs and the cloud provider has to pay a penalty price. This means that we are comparing the energy wastage price with the occasional violation penalty. This comparison is the core of our wastage-penalty model and we will now explain how can a wastage-penalty economical balance be calculated.
4.2 The Wastage-Penalty Model for Resource Balancing
As was briefly sketched in the introduction, the main idea is to push cloud providers to follow their users’ demands more closely, avoiding too much resource over-provisioning, thus saving energy. We do this by introducing additional cost factors that the cloud provider has to pay if he wastes too much resources – the energy and costs shown in Fig. 1, encouraging him to breach the agreed service agreements and only provide what is actually needed. Of course, the cloud provider will not breach the agreement too much, as that could cause too many violation detections (by a user demanding what cannot be provided at the moment) and causing penalty costs. We will now expand our model with some formal definitions in the cloud-user interface from Fig. 1 to be able to explicitly express the wastage-penalty balance in it.
We assume a situation with one cloud provider and one cloud user. The cloud provides the user with a single, abstract resource that constitutes its service (it can be the amount of available data storage expressed in GB, for example). To provide a certain amount of this resource to the user in a unit of time, a proportional amount of energy is consumed and indirectly a proportional amount of is emitted. An example resource scheduling scenario is shown in Fig. 2. An SLA was signed that binds the cloud provider to provide the user a constant resource amount, . The cloud provider was paid for this service in advance. A user uses different resource amounts over time. At any moment the variable is the amount required by the user. To avoid over-provisioning the provider does not actually provision the promised resource amount all the time, but instead adapts this value dynamically, is the resource amount allocated to the user in a time unit. This can be seen in Fig. 2 as increases from to to adapt to a sudden rise in .
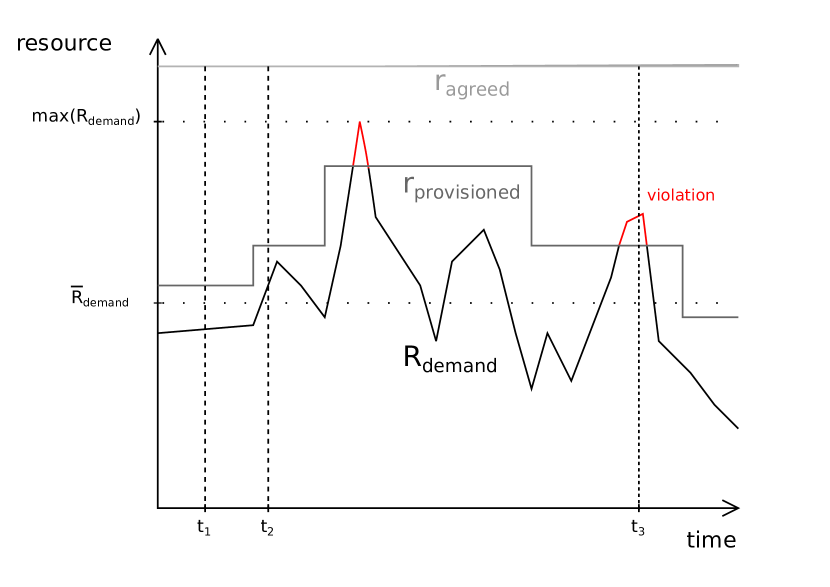
As we can not know how the user’s demand changes over time, we will think of as a random variable. To express in an explicit way, some statistical method would be required and research of users’ behaviour similar to that in [14] to gather real-life data regarding cloud computing resource demand. To stay on a high level of abstraction, though, we assume that it conforms to some statistical distribution and that we can calculate its mean and its maximum . To use this solution in the real world, an appropriate distribution should be input (or better yet – one of several possible distributions should be chosen at runtime that corresponds to the current user or application profile). We know the random variable’s expected value E and variance V for typical statistical distributions and we can express as the expected value and as the sum of with a limited error.
4.2.1 Wastage Costs
Let us see how these variables can be used to model resource wastage costs. We denote the energy price to provision the whole resource amount per time unit and similarly the price . By only using the infrastructure to provision an amount that is estimated the user will require, not the whole amount, we save energy that would have otherwise been wasted and we denote this evaded wastage cost . Since is a fraction of , we can use a percentage to state the percentage that is wasted:
| (1) |
We know what the extreme cases for should be – for provisioning approximately what is needed, ; and the percentage equivalent to the ratio of the distance between and to the total amount if we provision :
| (2) |
We model the distribution of between these extreme values using linear interpolation: average resource utilization - a ratio of the average provisioned resource amount () and the promised resource amount ():
| (3) |
| (4) |
4.2.2 Penalty Costs
Let us now use a similar approach to model penalty costs. If a user demands more resources than the provider has provisioned, an SLA violation occurs. The user gets only the provisioned amount of resources in this case and the provider has to pay the penalty cost . While and can be considered constant for our needs, is a random variable, because it depends on the user’s behaviour which we can not predict with 100% accuracy, so we will be working with , its expected value.
, the expected value of can be calculated as:
| (5) |
where is the constant cost of a single violation (although in reality probably not all kinds of violations would be priced the same) and is the probability of a violation occurring. This probability can be expressed as a function of , and , the random variable representing the user’s behaviour:
| (6) |
Again, same as for , we know the extreme values we want for . If 0 is provisioned, we have 100% violations and if is provisioned, we have 0% violations:
| (7) |
and if we assume a linear distribution in between we get an expression for the probability of violations occuring, which is needed for calculating the penalty costs:
| (8) |
4.2.3 Combining the Two
Now that we have identified the individual costs, we can state our goal function. If the cloud provider provisions too much resources the wastage cost is too high. If on the other hand he provisions too little resources, tightens the grip on the user too much, the penalty cost will be too high. The economical balance occurs when the penalty and wastage costs are equal - it is profitable for the cloud provider to breach the SLA only up to the point where penalty costs exceed wastage savings. We can express this economical balance with the following equation:
| (9) |
The [customer satisfaction factor] could be used to model how our promised-provisioned manipulations affect the user’s happiness with the quality of service and would be dependant of the service cost (because it might influence if the user would be willing to pay for it again in the future). For simplicity’s sake we will say that this factor equals 0, getting:
| (10) |
| (11) |
This formula is basically the economical wastage-penalty balance. All the parameters it depends on are constant as long as the demand statistic stays the same. It shows how much on average should a cloud provider breach the promised resource amounts when provisioning resources to users so that the statistically expected costs for SLA violation penalties do not surpass the gains from energy savings. Vice versa also holds – if a cloud provider provisions more resources than this wastage-penalty balance, he pays more for the energy wastage (energy and price), than what he saves on SLA violations.
4.3 Heuristics for Scheduling Optimisation with Integrated Emission Management
In this section we discuss a possible application of our wastage-penalty model for the implementation of a future-generation data center. Knowing the economical wastage-penalty balance, heuristic functions can be used to optimize resource allocation to maximize the cloud provider’s profit by integrating both service and violation penalty prices and energy and costs. This is useful, because it helps in the decision-making process when there are so many contradicting costs and constraints involved.
A heuristic might state: “try not to provision more than resources than the economical wastage-penalty balance”. This heuristic could easily be integrated into existing scheduling algorithms, such as [21, 20] so that the cloud provider does not stray too far away from the statistically profitable zone without deeper knowledge about resource demand profiles. The benefits of using our wastage-penalty model are:
-
•
a new, expanded cost model covers all of the influences from Fig. 1
-
•
-trading schema-readiness makes it easier to take part in emission trading
-
•
a Kyoto-compliant scheduler module can be adapted for use in resource scheduling and allocation solutions
-
•
the model is valid even without Kyoto-compliance by setting the price to 0, meaning it can be used in traditional ways by weighing only the energy wastage costs against service violation penalties.
The wastage-penalty balance in 11 is a function of significant costs and the demand profile’s statistical properties:
| (12) |
This function enables the input of various statistical models for user or application demand profiles ( and ) and energy (), () and SLA violation market prices (). With different input parameters, output results such as energy savings, environmental impact and SLA violation frequency can be compared. This would allow cloud providers and governing decision-makers to simulate the effects of different scenarios and measure the influence of individual parameters, helping them choose the right strategy.
5 Conclusion
In this paper we presented a novel approach for Kyoto protocol-compliant modeling of data centers. We presented a conceptual model for trading compliant with the Kyoto protocol’s emission trading scheme. We consider an emission trading market (ETM) where obligations are forwarded to data centers, involving them in the trade of credits for emission reduction (CERs). Such measures would ensure a equilibrium and encourage more careful resource allocation inside data centers.
To aid decission making inside this -trading system, we proposed a wastage-penalty model that can be used as a basis for the implementation of Kyoto protocol-compliant scheduling and pricing models. In the future we plan to implement prototype scheduling algorithms for the ETM considering self-adaptable Cloud infrastructures.
5.0.1 Acknowledgements
The work described in this paper was funded by the Vienna Science and Technology Fund (WWTF) through project ICT08-018 and by the TU Vienna funded HALEY project (Holistic Energy Efficient Management of Hybrid Clouds).
References
- [1] Data center energy efficiency calculator, http://www.42u.com/efficiency/energy-efficiency-calculator.htm
- [2] ENERGY STAR data center energy efficiency initiatives : ENERGY STAR, http://www.energystar.gov/index.cfm?c=prod_development.server_efficienc%y
- [3] Environment agency - phase III 2013 to 2020, http://www.environment-agency.gov.uk/business/topics/pollution/113457.a%spx#What_we_need_you_to_do_now
- [4] EU emissions trading system - department of energy and climate change, http://www.decc.gov.uk/en/content/cms/emissions/eu_ets/eu_ets.aspx
- [5] EU ETS 2009 company ratings, http://www.carbonmarketdata.com/cmd/publications/EU%20ETS%202009%20Comp%any%20Rankings%20-%20June%202010.pdf
- [6] Gartner estimates ICT industry accounts for 2 percent of global CO2 emissions, http://www.gartner.com/it/page.jsp?id=503867
- [7] Google’s PPAs: what, how and why, http://static.googleusercontent.com/external_content/untrusted_dlcp/www%.google.com/en/us/green/pdfs/renewable-energy.pdf
- [8] The green grid, http://www.thegreengrid.org/
- [9] The green grid › CUEandWUE, http://www.thegreengrid.org/Global/Content/TechnicalForumPresentation/2%011TechForumCUEandWUE
- [10] The green grid › the green grid metrics: Describing data center power efficiency, http://www.thegreengrid.org/en/Global/Content/white-papers/Green-Grid-M%etrics
- [11] IPCC - intergovernmental panel on climate change, http://www.ipcc.ch/publications_and_data/publications_ipcc_fourth_asses%sment_report_synthesis_report.htm
- [12] Kyoto protocol, http://unfccc.int/kyoto_protocol/items/2830.php
- [13] Kyoto protocol to the united nations framework convention on climate change, http://unfccc.int/essential_background/kyoto_protocol/items/1678.php
- [14] Beauvisage, T.: Computer usage in daily life. In: Proceedings of the 27th international conference on Human factors in computing systems. p. 575–584. CHI ’09, ACM, New York, NY, USA (2009)
- [15] Beloglazov, A., Buyya, R.: Adaptive threshold-based approach for energy-efficient consolidation of virtual machines in cloud data centers. In: Proceedings of the 8th International Workshop on Middleware for Grids, Clouds and e-Science. p. 4:1–4:6. MGC ’10, ACM, New York, NY, USA (2010)
- [16] Coutinho, F., Carvalho, L.A.V.d., Santana, R.: A workflow scheduling algorithm for optimizing Energy-Efficient grid resources usage. In: 2011 IEEE Ninth International Conference on Dependable, Autonomic and Secure Computing (DASC). pp. 642–649. IEEE (Dec 2011)
- [17] Ellerman, D., Joskow, P.: The european union’s emissions trading system in perspective, prepared for the pew center on global climate change, http://www.c2es.org/eu-ets
- [18] Garg, S.K., Yeo, C.S., Anandasivam, A., Buyya, R.: Environment-conscious scheduling of HPC applications on distributed cloud-oriented data centers. Journal of Parallel and Distributed Computing 71(6), 732–749 (Jun 2011)
- [19] Grubb, M., Vrolijk, C., Brack, D.: Kyoto Protocol: A Guide and Assessment. Earthscan Ltd, London (Jul 1999)
- [20] Maurer, M., Brandic, I., Sakellariou, R.: Simulating autonomic SLA enactment in clouds using case based reasoning. Towards a Service-Based Internet p. 25–36 (2010)
- [21] Maurer, M., Brandic, I., Sakellariou, R.: Enacting SLAs in clouds using rules. Euro-Par 2011 Parallel Processing p. 455–466 (2011)
- [22] Wang, Z., Zhang, Y.: Energy-Efficient task scheduling algorithms with human intelligence based task shuffling and task relocation. pp. 38–43. IEEE (Aug 2011)