Trends in the magnetic properties of Fe, Co and Ni clusters and monolayers on Ir(111), Pt(111) and Au(111)
Abstract
We present a detailed theoretical investigation on the magnetic properties of small single-layered Fe, Co and Ni clusters deposited on Ir(111), Pt(111) and Au(111). For this a fully relativistic ab-initio scheme based on density functional theory has been used. We analyse the element, size and geometry specific variations of the atomic magnetic moments and their mutual exchange interactions as well as the magnetic anisotropy energy in these systems. Our results show that the atomic spin magnetic moments in the Fe and Co clusters decrease almost linearly with coordination on all three substrates, while the corresponding orbital magnetic moments appear to be much more sensitive to the local atomic environment. The isotropic exchange interaction among the cluster atoms is always very strong for Fe and Co exceeding the values for bulk bcc Fe and hcp Co, whereas the anisotropic Dzyaloshinski-Moriya interaction is in general one or two orders of magnitude smaller when compared to the isotropic one. For the magnetic properties of Ni clusters the magnetic properties can show quite a different behaviour and we find in this case a strong tendency towards noncollinear magnetism.
pacs:
75.75.-c, 75.75.Lf, 75.70.Tj, 75.70.AkI Introduction
The magnetism of surface supported clusters has been the subject of intense research activities over the last few years as such systems often show peculiar and unexpected magnetic behaviour. These exceptional magnetic properties arise from the reduced dimensionality in combination with spin-orbit coupling (SOC) which can cause complex interactions among the atomic magnetic moments. In this context clusters of magnetic 3d transition metal elements deposited on 5d noble metal substrates are very interesting as for these systems spin-orbit driven effects mediated by substrate atoms with large SOC are most prominent. With technical or chemical applications in focus, there is a growing need to understand the trends and principles behind the manifold of magnetic properities for different cluster and substrate materials as only this will make it possible to anticipate which magnetic properties may result from a particular cluster/substrate combination.
In previous experimental and theoretical investigations on the magnetism of atomic clusters on surfaces it was already demonstrated that their magnetic properties differ strongly from the magnetic properties of the corresponding bulk materials and that this has its main origin in the reduced atomic coordination of cluster sites which in fact has a strong impact on the local spin and orbital magnetic moments GRV+03 ; SBM+07 ; MLB10 . More recently it was also shown that for 3d clusters or monolayers on 5d metal surfaces SOC induced effects on the spin configurations also play an immanent role causing various noncolliniear magnetic structures ALU+08 ; RGDP11 ; MLB+10 . This SOC induced noncolliniear magnetism is, however, intrinsically different from the spin frustrations that may arise e.g. by a competition between ferro- and anti-ferromagnetism or that may be present in systems where the magnetic and geometric symmetries are incompatible LMZ+07 ; RRDP10 .
Unfortunately, each of the theoretical studies published so far were aimed at only one or two combinations of the cluster and substrate materials and often only very few cluster sizes and shapes were investigated. In addition to that comes the fact that many theoretical investigations have focused only on some selected magnetic properties as for instance the magnetic moments and exchange interaction but leaving out important information concerning the magnetic anisotropy energy (MAE). Moreover, due to limitations which are present in all theoretical schemes it is often also problematic to compare results obtained for different systems by different groups which use different methods. Thus, in order to obtain a more complete picture about the trends in the magnetic properties of deposited clusters one needs a sufficiently large self-contained set of results for interrelated systems which are obtained by the same method. This motivated us to calculate a large spectrum of the magnetic properties for sets of Fe, Co, and Ni clusters of 1-7 atoms on Ir(111), Pt(111), and Au(111) surfaces, within a unified fully-relativistic Green’s function formalism. Moreover, we studied also complete monolayers as reference systems for the sequences with increasing cluster size. This enables us to analyse a large pool of data which are directly comparable because they were obtained by the same procedure. We found that the magnetism of Fe and Co clusters on all investigated surfaces follows common patterns that can be understood by considering the coordination numbers of atoms in the clusters and the polarisability of the substrate. For Ni clusters the situation is more complicated and some of the systematic trends observed for Fe and Co clusters are absent.
II Computational framework
The calculations for the investigated cluster and monolayer systems were done within the framework of spin density functional theory (SDFT) using the local spin density approximation (LSDA) with the parametrisation given by Vosko, Wilk and Nusair for the exchange and correlation potential VWN80 . The electronic structure has been determined in a fully relativistic way on the basis of the Dirac equation for spin-polarised potentials which was solved using the Korringa-Kohn-Rostoker (KKR) multiple scattering formalism EKM11 . The calculations for surface deposited clusters consist of two steps. First the host surface is calculated self-consistently with the tight-binding or screened version of the KKR method ZDU+95 using layers of empty sites to represent the vacuum region. This step is then followed by treating the deposited clusters as a perturbation to the clean surface with the Green’s function for the new system being obtained by solving the corresponding Dyson equation BMP+05 . This technique avoids the spurious interactions between clusters which may occur if a supercell approach is used instead SBME10 .
For all systems discussed below the cluster atoms were assumed to occupy ideal lattice sites in the first vacuum layer and no effects of structure relaxation were included. The substrates were simulated by finite slabs which contained 37 atomic layers and we used lattice parameters of 3.84 Å, 3.92 Å and 4.08 Å for Ir(111), Pt(111) and Au(111), respectively. The surface calculations were converged with respect to -point integration. For the surface Brillouin zones a regular -mesh of points was used which corresponds to 1717 -points in the irreducible part of the Brillouin zone. The effective potentials were treated within the atomic sphere approximation (ASA). The occuring energy integrals were evaluated by contour integration on a semicircular path within the complex energy plane using a logarithmic mesh of 32 points. The multipole expansion of the Green’s function was truncated at an angular momentum cutoff of . For selected surface and cluster systems calculations with were also performed which showed that this causes a more-or-less uniform increase of the local spin moments by 3-5% and of the local orbital moments by 3-10%. This indicates that the systematic trends in the spin and orbital magnetic moments are well described by .
For the representation of the interatomic exchange interactions we made use of the rigid spin approximation AKH+96 and mapped the magnetic energy landscape onto an extended classical Heisenberg model for all atomic magnetic moment directions . The corresponding extended Heisenberg Hamiltonian has the form AKL97 ; USPW03 :
| (1) | |||||
where, the exchange interaction tensor has been decomposed into its conventional isotropic part , its traceless symmetric part and its anti-symmetric part which is given in terms of the Dzyaloshinski-Moriya (DM) vector . We calculated the coupling parameters and DM vectors following the scheme by Udvardi et al. USPW03 .
The anisotropy constants account for the on-site magnetic anisotropy energy associated with each individual magnetic moment oriented along . The magnetic anisotropy energy is usually split into two parts, the SOC induced magnetocrystalline anisotropy and the so-called shape anisotropy caused by magnetic dipole-dipole interactions, i.e.
| (2) |
can be determined classically by a lattice summation over the magnetostatic energy contributions of the individual magnetic moments or in an ab-initio way by using a Breit Hamiltonian BMB+12 . Here, we used the classical approach to calculate for the full monolayers while we found that for clusters containing just a few magnetic atoms is negligible. The magnetocrystalline anisotropy energy was extracted from magnetic torque calculations which are described in more detail in Refs. MBM+09 ; SBME10 ; SSB+06 .
As discussed recently by Šipr et al. SBME10 the approximations and truncations mentioned in this Section result in a limited accuracy concerning in particular the values of . However, this does not hinder our analysis of the general trends of with respect to cluster geometries as well as different cluster/substrate combinations.
III Results and Discussion
III.1 Magnetic moments
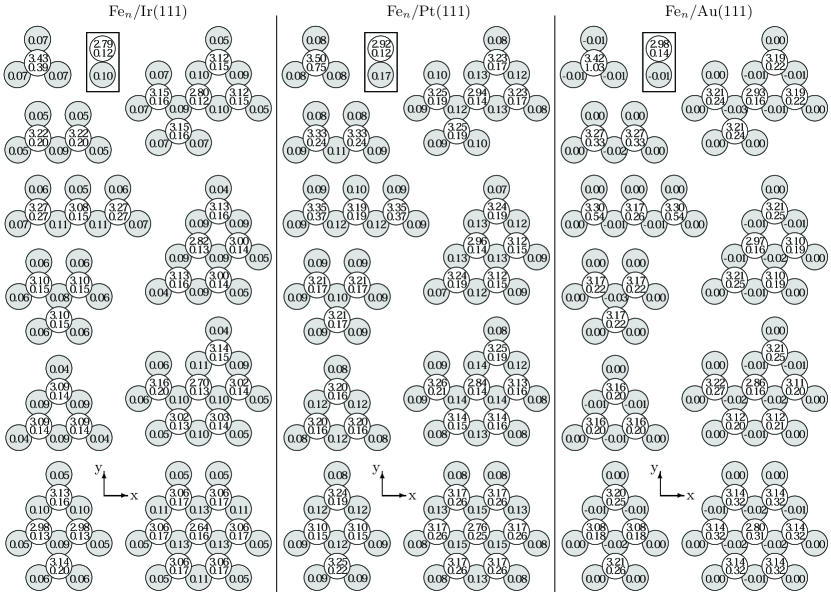
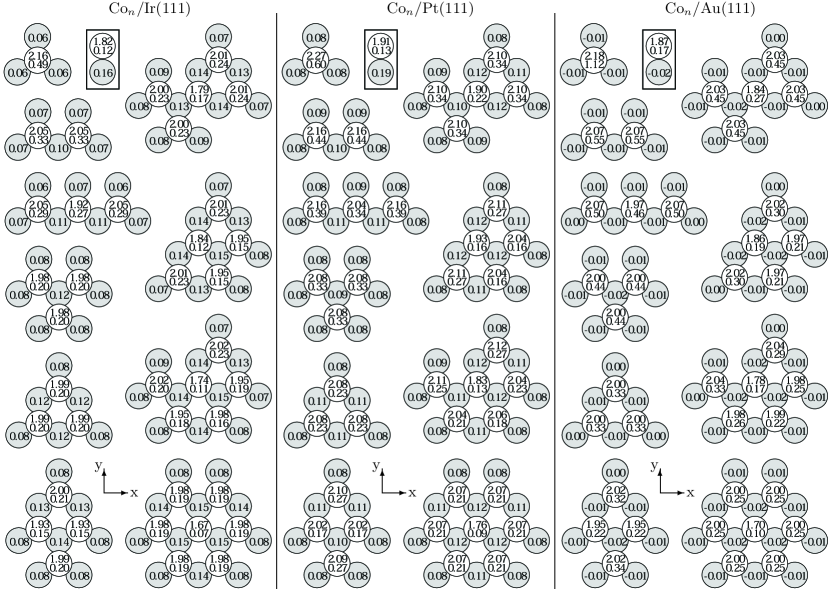
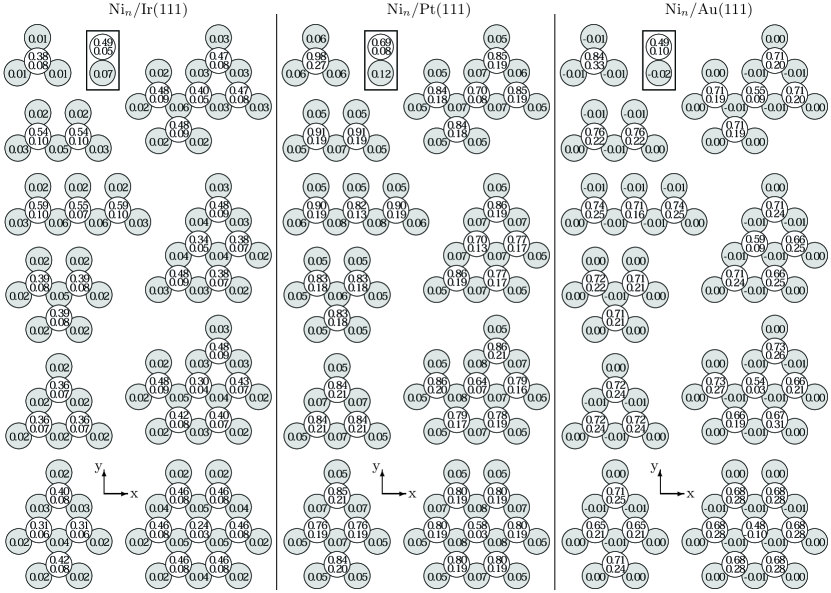
Fig. 1 shows the considered cluster geometries together with the calculated values of local spin () and orbital () magnetic moments for Fe clusters of 1-7 atoms as well as full Fe monolayers deposited on Ir(111), Pt(111) and Au(111). For identical Co and Ni clusters the corresponding data are presented in Figs. 2 and 3. In addition, these figures also show the induced spin magnetic moments of the respective substrate atoms that are adjacent to cluster atoms. One can see that in some cases there are considerable variations of and between the different sites of the deposited clusters. The magnetic moments depend not only on the position of the site with respect to other Fe, Co or Ni atoms but also on their position with respect to the underlying substrate atoms. This can be observed for example when inspecting the two differently located compact trimers or the cross-shaped five atom clusters in Figs. 1, 2 and 3. Clusters supported by Pt(111) have largest when compared with Ir(111) and Au(111) while the values are increasing from Ir to Pt to Au.
There is a big difference between the induced magnetic moments in the Ir(111) and Pt(111) substrates on the one hand and the Au(111) substrate on the other hand. Ir and Pt atoms which are nearest neighbours of any Fe or Co atom have a relatively large of up to 0.15 , while corresponding Au atoms have always small negative , not larger than 0.03 in the absolute value. Substrate atoms with a larger number of Fe, Co or Ni neighbours usually have a larger than substrate atoms with a smaller number of neighbouring cluster atoms. However, this is not a general rule as seen for the substrate atoms adjacent to the central atom of the cross-shaped Fe5 and Co5 or to the differently located compact Fe3 and Co3 clusters on Ir(111) and Pt(111).
The orbital magnetic moments induced in the substrate atoms are always small: they can reach up to 0.03 for Fe and Co on Pt(111) while being smaller than 0.007 for Ir(111) and smaller than 0.004 for Au(111). Except for the Au(111) substrate atoms is found to be always parallel with . The finding that Pt is the most polarisable of the three elements and that Au is less polarisable than Ir is consistent with earlier theoretical GE95 ; TvdLT+03 and experimental works WPC+00 ; WPW+01 ; WAJ+04 ; KSK+06 for multilayer systems. This high spin polarisability of Pt can be ascribed to its high spin susceptibility that in turn is caused by its relatively large density of states at the Fermi level leading to a large Stoner product (see below).
By plotting the local magnetic moments as a function of the coordination number one can visualise the site-dependence of and . Such plots are shown in the insets of Fig. 4, where only neighbouring cluster atoms are considered in defining the coordination number. Sites with a lower coordination number generally have larger and than sites with a higher coordination number, with Ni on Ir(111) being the only exception. For Ni on Ir(111) the magnetic moments quasi-oscillate strongly with changing cluster size or shape and we find that for the adatom (0.38 ) is smaller than for a Ni atom in the full monolayer (0.49 ). For all other cluster/substrate systems considered in our study a quasi-linear relationship between and coordination number is found. Interestingly, increasing the coordination number for the atoms of such small clusters leads to a stronger reduction of when compared to equally coordinated atoms in larger clusters or full monolayers. For example the central atom of a compact 7-atom cluster has always lower than a monolayer atom. One can also see that the corresponding orbital magnetic moments are much more sensitive with respect to coordination than the spin magnetic moments. While the insets in Fig. 4 show a strong decay of with increasing coordination for Fe and Co clusters on all three substrates the orbital magnetism in Ni clusters behaves non-monotonously.
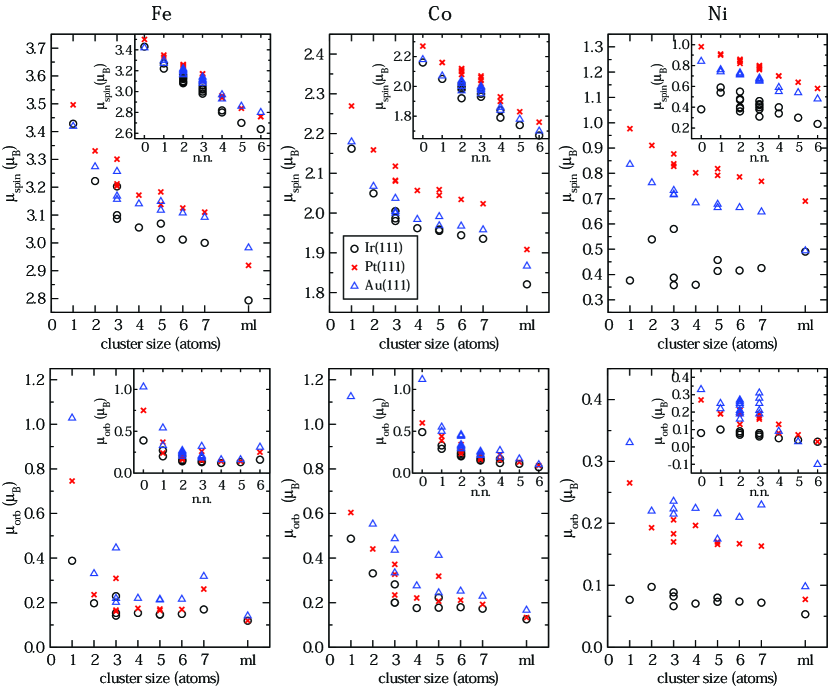
An analysis of the average spin and orbital magnetic moments as function of cluster size is shown in Fig. 4. For the three and five atom clusters the lower and values correspond to the compact clusters. All clusters have largest when deposited on Pt(111) followed by the Au(111) substrate. The lowest values are obtained for deposition on Ir(111). The highest values of , however, are found for clusters deposited on Au(111) where the interaction between cluster and substrate atoms is weak and the lattice constant largest.
Concerning the trend of for the three different substrates there are two competing effects that must be considered. At first there is an increase in the lattice constant when going from Ir (a=3.84 Å) to Pt (a=3.92 Å) to Au (a=4.08 Å), i.e. as the atoms of the clusters occupy ideal lattice sites, their distance from the substrate is largest in the case of Au. This means also that among the discussed substrates, the interaction between adatoms and substrate is smallest for Au and one would therefore expect that clusters deposited on Au(111) would have the largest values. On the other hand hybridisation of the electronic states between adatoms and substrate leads to a small charge transfer of minority 3-electrons from the cluster atoms into empty 5-states of adjacent substrate atoms, thereby increasing for the clusters. This however, happens only for the spatially extended 5-states of Ir and Pt with their 5-states having an appreciable energetic overlap with the minority 3-states of cluster atoms. This can be clearly seen from the density of states curves which are presented in Fig. 5. In contrast to this there is almost no or only little interaction between the minority 3-states of cluster atoms with the energetically low-lying 5-states of Au. Besides, the hybridization between the cluster-derived and substrate-derived states leads to energy lowering of the Fe, Co and Ni 4-states and this lowering is again more pronounced for the Ir and Pt substrates than for the Au substrate.
This causes an additional charge redistribution within the cluster atoms, i.e. 4-states become occupied, again at the cost of minority 3-states. In this way Fe1 deposited on Pt(111) ends up with about 0.1 electrons less in the minority 3-orbitals and thus a slightly larger spin magnetic moment when compared to the deposition on Au(111), with this effect becoming stronger for Co and Ni. Šipr et al. SBM+07 have demonstrated this behaviour for Co clusters on Pt(111) and Au(111) by performing calculations for Co clusters on an Au(111) substrate using the lattice constant of Pt. This also showed that the observed increase in can be solely attributed to the larger lattice constant of Au.
III.2 Density of states
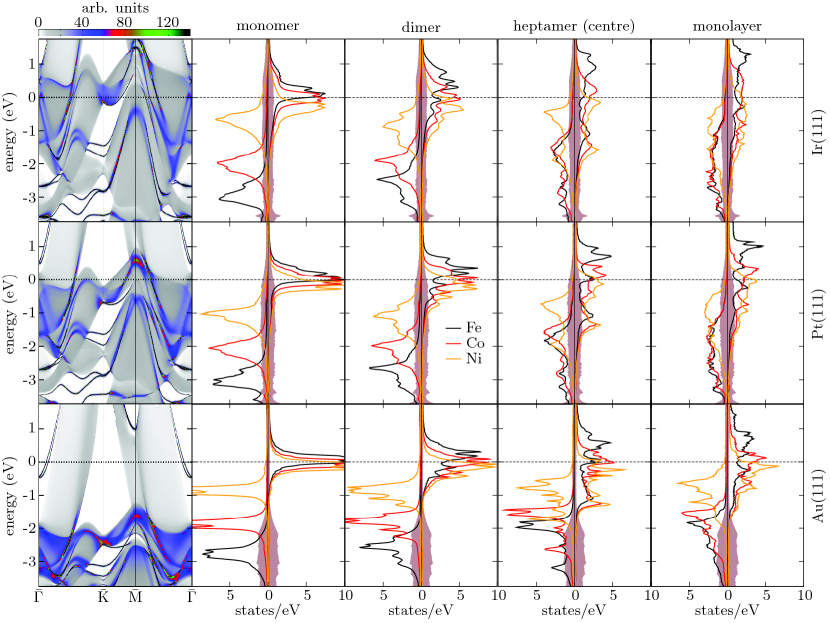
In Fig. 5 we show the spin-resolved density of states (DOS) for the adatoms, dimers and the central atoms of the 7-atom clusters as well as the corresponding full monolayers. The DOS of the respective topmost atomic layer of the clean substrates is also shown by the brown areas together with the respective Bloch spectral function along the high symmetry lines --- in the two-dimensional Brillouin zone presented in the first column. can be interpreted as a -resolved DOS revealing the detailed features in the electronic structure of the three different substrates. The large grey-shaded regions in the diagrams in the first column of Fig. 5 correspond to electronic bulk states of the underlying substrates, while the sharp black lines represent surface states localised within the topmost atomic layer of the clean surfaces. The blue and red regions arise from hybridisations between surface and bulk states. Clearly visible are for instance the Rashba split surface states around for Pt(111) and Au(111).
For Ir and Pt there is an appreciable energetic overlap between electronic states located at the substrate and states located at cluster sites resulting in hybridisation with a prominent broadening in the cluster DOS. The situation is different for the Au substrate, where the energetically low-lying states of Au can only hybridise with the majority states of Fe while for minority states of Fe as well as for all states of Co and Ni, there are no energetically close Au states to hybridize with and hence very distinct atomic-like features prevail in the DOS of cluster atoms in that case. With increasing number of cluster atoms a complex fine structure appears in the DOS which also broadens appreciably with increasing coordination numbers of the cluster atoms. Moreover, the presented DOS curves for the central atom of the 7-atom cluster demonstrate that the DOS of deposited clusters acquires very quickly the main features which are present in the DOS of a complete monolayer. However, as for such small clusters the DOS at the Fermi level varies strongly with changing the number of atoms so do the corresponding chemical and magnetic properties in this finite size regime.
The decreasing overlap between states located in the substrate and located in the clusters when going from Ir to Au explains the finding that is largest for clusters on Au where the atomic-like character of the DOS prevails. In this context, however, the size of cannot always be directly related to the overlap between cluster and substrate DOS as this overlap is smaller for Au(111) than for Pt(111) and yet is largest for clusters on the Pt(111) substrate.
In the same way also the induced magnetisation within the substrate depends on this mutual energetic overlap between 3 and 5-states, which explains the very small induced magnetic moments in the case of Au(111). But also here, one should keep in mind that the polarizability of the substrate atoms is determined by the Stoner product with the exchange integral and the number of states at the Fermi level ( = 0.29 for Ir, 0.59 for Pt and 0.05 for Au) SP94 .
III.3 Exchange Coupling
| Fe | Co | Ni | |||||||
|---|---|---|---|---|---|---|---|---|---|
| Ir | Pt | Au | Ir | Pt | Au | Ir | Pt | Au | |
| 128.8 | 137.8 | 143.8 | 97.5 | 107.7 | 112.8 | 7.9 | 30.4 | 26.7 | |
| 110.5 | 111.8 | 114.6 | 69.8 | 77.6 | 72.5 | 0.8 | 14.6 | 16.1 | |
| 100.3 | 107.9 | 114.2 | 64.5 | 71.0 | 67.4 | 1.8 | 16.4 | 15.7 | |
| 76.8 | 90.9 | 90.6 | 66.9 | 76.9 | 74.8 | 11.2 | 24.9 | 20.9 | |
| -15.9 | -8.4 | -12.2 | 5.2 | 3.9 | -0.4 | 4.3 | 6.1 | 3.4 | |
| 79.5 | 79.2 | 82.3 | 49.5 | 59.8 | 47.5 | 0.4 | 7.6 | 8.0 | |
| 83.0 | 92.1 | 99.4 | 59.3 | 66.1 | 60.5 | 2.0 | 15.9 | 13.5 | |
| 97.2 | 99.4 | 100.7 | 61.4 | 69.7 | 60.2 | 1.4 | 14.6 | 12.7 | |
| -1.2 | -0.8 | -3.8 | 6.7 | 8.4 | 10.1 | 0.4 | 3.3 | 1.6 | |
| 79.6 | 79.2 | 77.0 | 53.4 | 61.5 | 55.4 | 3.8 | 15.1 | 10.8 | |
| 51.2 | 64.9 | 67.0 | 48.4 | 54.0 | 46.3 | 4.2 | 15.1 | 10.2 | |
| 118.3 | 117.4 | 122.2 | 65.7 | 69.3 | 65.1 | 1.0 | 16.1 | 14.0 | |
| 109.6 | 110.2 | 116.3 | 66.3 | 72.2 | 70.0 | 2.8 | 16.7 | 14.2 | |
| 0.7 | 4.2 | 5.9 | 1.5 | 4.2 | 6.9 | -0.6 | 1.5 | 2.2 | |
| -12.4 | -7.6 | -10.4 | 4.7 | 6.2 | 4.0 | 2.2 | 4.9 | 3.5 | |
| 74.2 | 75.6 | 75.9 | 50.3 | 57.9 | 45.1 | 0.8 | 7.9 | 7.1 | |
| 71.8 | 79.3 | 68.8 | 48.6 | 53.8 | 46.2 | 3.8 | 16.9 | 11.7 | |
| 67.8 | 77.1 | 89.8 | 45.1 | 56.0 | 44.8 | 3.3 | 15.1 | 10.0 | |
| 104.0 | 105.5 | 105.4 | 64.0 | 73.0 | 65.9 | 2.1 | 14.4 | 9.6 | |
| 1.2 | 0.3 | -1.9 | 3.1 | 7.9 | 9.4 | 0.1 | 2.4 | 0.9 | |
| -6.3 | -4.4 | -4.3 | 4.0 | 4.6 | 5.4 | 2.1 | 5.4 | 3.5 | |
| 61.0 | 72.9 | 87.9 | 48.2 | 59.1 | 50.8 | 3.9 | 13.1 | 8.8 | |
| 88.8 | 88.1 | 89.9 | 50.6 | 59.4 | 45.0 | 3.4 | 13.1 | 8.6 | |
| 2.4 | 1.6 | 2.2 | 1.0 | 5.3 | 7.8 | 0.4 | 1.8 | 0.1 | |
| 2.4 | 1.6 | 2.2 | 1.0 | 5.3 | 7.8 | 0.4 | 1.8 | 0.1 | |
| -2.4 | -0.0 | 0.7 | 5.8 | 6.3 | 3.0 | 1.3 | 3.6 | 2.5 | |
| 57.0 | 57.2 | 47.5 | 38.4 | 43.7 | 34.8 | 1.4 | 9.1 | 6.6 | |
| ml | 34.9 | 48.9 | 42.6 | 33.4 | 35.7 | 26.0 | 3.7 | 7.7 | 3.4 |
The calculated isotropic exchange coupling constants are presented for all clusters (except for the cross-shaped 5-atom and 6-atom ones) in Tab. 1. Positive and negative values of correspond to ferromagnetic and antiferromagnetic coupling, respectively. In Tab. 2 we show the sum of all couplings related to a particular atom at site .
| (3) |
The effective exchange field can be seen as the total strength by which the magnetic moment at site is held along its direction by all other atoms.
| Fe | Co | Ni | |||||||
|---|---|---|---|---|---|---|---|---|---|
| Ir | Pt | Au | Ir | Pt | Au | Ir | Pt | Au | |
| 267.1 | 297.2 | 289.6 | 210.6 | 236.6 | 203.8 | 16.4 | 62.0 | 42.1 | |
| 190.7 | 201.3 | 196.1 | 131.8 | 147.4 | 132.0 | 6.9 | 39.8 | 30.6 | |
| 153.8 | 180.1 | 180.3 | 126.6 | 142.5 | 128.0 | 9.1 | 40.1 | 30.2 | |
| 296.5 | 317.8 | 290.8 | 204.3 | 228.9 | 182.9 | 9.6 | 51.3 | 37.7 | |
| 174.7 | 188.9 | 169.4 | 126.0 | 145.7 | 127.4 | 8.7 | 41.3 | 25.9 | |
| 252.1 | 266.8 | 271.0 | 168.6 | 199.6 | 165.7 | 6.7 | 41.5 | 27.6 | |
| 348.3 | 351.8 | 286.3 | 235.6 | 267.1 | 208.9 | 8.7 | 55.8 | 39.9 | |
| 215.1 | 230.2 | 232.0 | 151.2 | 184.6 | 149.8 | 11.3 | 44.5 | 26.9 | |
| ml | 205.5 | 285.4 | 244.6 | 227.0 | 233.5 | 190.9 | 27.8 | 58.5 | 27.7 |
From the data given in Tab. 1 one can see that Fe and Co clusters show a strong ferromagnetic nearest neighbour coupling in the range of 40-140 meV while for Ni clusters the values are often much smaller. In the case of Fe and Co the couplings between nearest neighbouring atoms are about one order of magnitude larger than couplings between more distant atoms, i.e. the coupling strength falls off very rapidly with increasing the interatomic distance. For Ni clusters, however, and especially for Ni on Ir(111) where the couplings are very weak this trend is less pronounced. These results also show that there is an occasional weak anti-ferromagnetic coupling between more distant atoms for Fe clusters, which however, gives only an insignificant contribution to the cummulative of each respective atom. As each contains by definition (see the Heisenberg Hamiltonian in Eq. (1)) the product between the involved spin magnetic moments and the coupling is, naturally, largest for Fe and smallest for Ni clusters. Moreover, the nearest neighbour exchange coupling among the Fe, Co and Ni cluster atoms is larger than our corresponding values for standard bcc Fe (37.8 meV), hcp Co (26.3 meV) and fcc Ni (4.8 meV).
Apart from the magnitude of the spin magnetic moments also atomic coordination as well as substrate effects play an important role. Especially for Fe clusters the values between low coordinated cluster atoms are often much larger when compared to atoms with higher coordination. Nevertheless, the effective exchange field increases monotonically with increasing coordination, i.e. given a fixed number of Fe, Co or Ni atoms the most compact structure will form the most stable ferromagnetic state.
As one can clearly see from the data in Table 1 in combination with the cluster geometries given in Figs. 1-3 the isotropic exchange coupling is also affected by the arrangement of cluster atoms with respect to the underlying surface sites. Looking at the two different compact Fe and Co trimers on Ir(111) and Pt(111) for instance we find that the coupling values differ by about 8-10%. For the 7-atom Fe cluster on Ir(111) and Pt(111), however, for nearest neighbouring edge atoms varies by as much as 20-45%, respectively, whereas the corresponding couplings for clusters on Au(111) do in general not exhibit such a pronounced dependence on the atomic position with respect to the substrate atoms. The latter seems also to be the case for Fe and Co 7-atom clusters with an identical configuration on Cu(111). This was studied in detail by Mavropolus et al. MLB10 and the Cu substrate atoms also do not seem to participate in the exchange coupling of the Fe and Co cluster atoms. Therefore, we ascribe this substrate effect to the large spin-polarisation within the the Ir and Pt surface atoms while the weak induced magnetism in Cu and Au causes only minor variations in the exchange coupling of equidistant cluster atoms. These irregularities in the couplings underline that transferring coupling constants obtained from bulk calculations to low-dimensional finite nanostructures will lead in general to unreliable results.
For Fe and Co clusters the magnitude of the isotropic exchange interaction is quite similar for all three investigated substrates. Ni clusters, on the other hand, have comparable nearest neighbour values only when being deposited on Pt(111) and Au(111) while deposition on Ir(111) reduces the coupling strength to just a few meV. This results in a quite small effective exchange field per Ni atom in the order of about 10 meV. As the exchange interaction is so small for these Ni clusters, there is a pronounced tendency that their magnetic ground state deviates strongly from a collinear configuration (see below).
The coupling of magnetic cluster atoms to the induced magnetic moments in the substrate is always very small. is about 2 meV between Fe or Co cluster atoms and topmost layer atoms of an Ir or Pt surface. The small induced moments in the Au(111) substrate couple anti-ferromagnetically to the cluster atoms. Here the nearest neighbour ’s are only in the order of 0.1 meV being of similar magnitude as the ferromagnetic coupling of Ni cluster atoms to Ir or Pt surface sites.
In addition to the isotropic coupling constants Tab. 3 shows the complementary data for the anisotropic exchange interaction. For clarity we present here only the magnitude of the DM vector which can be seen as a measure of the driving force towards a non-collinear spin configuration. Given the fact that the SOC strength is comparable in Ir, Pt and Au one can see from the data in Tab. 3 that for any given cluster there are often strong variations (without any clear trends) in upon deposition onto different substrates. As discussed above for the values, we find here an even more pronounced dependence of on the position of cluster atoms with respect to the underlying substrate atoms and the results show in addition that the relative decay of the DM interaction with increasing interatomic distance is much weaker when compared to the corresonding isotropic exchange coupling.
| Fe | Co | Ni | |||||||
|---|---|---|---|---|---|---|---|---|---|
| Ir | Pt | Au | Ir | Pt | Au | Ir | Pt | Au | |
| 1.17 | 6.93 | 1.61 | 3.48 | 5.47 | 2.34 | 0.26 | 0.24 | 0.49 | |
| 4.60 | 6.16 | 0.70 | 1.06 | 1.17 | 4.18 | 0.39 | 1.45 | 0.99 | |
| 0.94 | 6.31 | 2.45 | 5.76 | 8.31 | 8.66 | 0.24 | 2.35 | 1.32 | |
| 1.83 | 5.64 | 2.77 | 2.06 | 3.51 | 1.27 | 0.48 | 0.63 | 0.48 | |
| 3.62 | 1.19 | 3.78 | 0.38 | 1.79 | 2.91 | 0.40 | 1.20 | 1.42 | |
| 4.86 | 6.02 | 1.52 | 2.29 | 0.67 | 1.73 | 0.14 | 0.97 | 1.45 | |
| 1.76 | 5.64 | 2.26 | 4.33 | 4.24 | 2.85 | 0.20 | 1.09 | 1.57 | |
| 2.54 | 5.30 | 0.98 | 1.19 | 1.39 | 2.14 | 0.26 | 0.28 | 0.39 | |
| 1.58 | 0.64 | 0.75 | 0.34 | 1.75 | 0.99 | 0.09 | 0.58 | 0.19 | |
| 5.75 | 5.81 | 0.63 | 2.97 | 6.03 | 7.98 | 0.54 | 0.87 | 0.26 | |
| 2.25 | 5.12 | 1.85 | 4.81 | 5.63 | 3.29 | 0.52 | 1.42 | 0.73 | |
| 4.67 | 6.97 | 2.51 | 3.43 | 6.24 | 5.82 | 0.51 | 0.88 | 0.90 | |
| 1.39 | 5.46 | 1.45 | 7.55 | 9.98 | 4.72 | 0.50 | 1.06 | 1.48 | |
| 1.30 | 1.03 | 2.24 | 0.83 | 0.80 | 1.95 | 0.37 | 0.63 | 0.23 | |
| 2.34 | 0.77 | 0.86 | 1.40 | 2.21 | 3.11 | 0.16 | 0.61 | 0.40 | |
| 5.60 | 5.26 | 2.00 | 2.30 | 1.82 | 5.39 | 0.15 | 0.88 | 1.21 | |
| 3.33 | 3.64 | 1.19 | 1.14 | 1.47 | 1.34 | 0.26 | 0.54 | 0.34 | |
| 2.51 | 5.22 | 1.43 | 3.83 | 1.54 | 3.81 | 0.39 | 0.42 | 1.19 | |
| 2.90 | 4.90 | 1.21 | 1.46 | 2.58 | 2.40 | 0.31 | 0.28 | 0.76 | |
| 0.79 | 0.35 | 0.73 | 0.40 | 1.73 | 1.10 | 0.17 | 0.40 | 0.49 | |
| 1.49 | 0.46 | 1.45 | 1.12 | 1.31 | 1.74 | 0.35 | 0.74 | 0.27 | |
| 1.00 | 4.99 | 1.08 | 5.01 | 1.86 | 1.99 | 0.45 | 0.26 | 0.72 | |
| 3.72 | 6.00 | 2.55 | 1.44 | 2.88 | 1.56 | 0.26 | 0.23 | 1.22 | |
| 1.28 | 0.43 | 0.97 | 0.57 | 1.20 | 0.80 | 0.10 | 0.27 | 0.39 | |
| 1.28 | 0.43 | 0.97 | 0.57 | 1.20 | 0.84 | 0.10 | 0.29 | 0.38 | |
| 0.58 | 0.43 | 1.70 | 1.97 | 1.56 | 0.86 | 0.12 | 0.33 | 0.33 | |
| 3.81 | 2.52 | 2.55 | 1.48 | 1.75 | 1.67 | 0.13 | 0.35 | 0.45 | |
| ml | 4.17 | 2.54 | 0.66 | 1.33 | 1.68 | 0.71 | 0.13 | 0.20 | 0.04 |
Albeit that is between one or two orders of magnitude smaller than the isotropic exchange coupling, it is not negligible. For Fen on Ir(111) we obtain a relatively strong DM interaction which is in accordance with the recent findings of Heinze et al. MLB+10 and of von Bergmann et al. BHB+06 as well as Deák et al. DSU11 for Fe/Ir(001) which all demonstrate that these systems show a strong tendency towards non-collinear magnetism. Moreover, our results also show large values for Fen and Con clusters from which we conjecture that this may also lead to complex magnetic structures within extended Fe and Co nanostructures on these substrates. In fact the sometimes experimentally observed, unexpected low magnetic moments in Fe- and Co-Pt(111) systems may be caused by this mechanism HLK+09 ; SKZ+10 . For Ni clusters the DM interaction is always very important with respect to the isotropic exchange coupling as both quantities are often of the same order of magnitude. Thus, one can expect the presence of non-collinear magnetic ordering in Ni clusters on all three substrates. It should be stressed that this non-collinearity will not be a consequence of the frustration between the magnetic and geometric order but rather will follow from the influence of spin-orbit effects on the exchange coupling, as manifested by the DM interaction.
III.4 Magnetic Anisotropy Energy
| Fe | Co | Ni | |||||||
| Ir | Pt | Au | Ir | Pt | Au | Ir | Pt | Au | |
| 0.10 | 8.42 | 11.45 | 3.95 | 4.88 | 9.02 | -0.21 | -1.57 | -5.11 | |
| -1.01 | 0.48 | 2.75 | 0.54 | 2.25 | -0.39 | 0.10 | 0.08 | -1.17 | |
| 0.37 | 0.36 | 1.33 | 0.07 | -0.12 | -2.45 | 0.84 | 0.49 | 0.24 | |
| -0.45 | 0.33 | 1.44 | 1.82 | 2.00 | 0.52 | 0.17 | -0.13 | -0.62 | |
| -0.07 | 1.23 | 3.46 | -0.23 | 0.60 | -3.84 | 0.10 | -0.58 | 3.08 | |
| -0.09 | 0.36 | 1.74 | 0.04 | -0.18 | -2.56 | 0.09 | 0.44 | 0.15 | |
| -0.49 | 0.05 | 1.26 | 0.74 | 1.42 | -0.03 | 0.14 | 0.23 | -0.77 | |
| 0.11 | 0.49 | 1.65 | 0.17 | -0.44 | -2.32 | 0.05 | 0.21 | 0.21 | |
| 0.09 | 0.48 | 1.90 | 0.36 | -0.11 | -2.00 | 0.08 | 0.22 | 0.09 | |
| 0.90 | 2.15 | 3.86 | 0.30 | -0.26 | -2.12 | 0.11 | 0.37 | 0.65 | |
| monolayer | |||||||||
| 0.64 | -0.26 | 1.09 | 0.20 | 0.31 | -1.32 | -0.19 | -0.39 | -0.44 | |
| -0.19 | -0.19 | -0.18 | -0.09 | -0.09 | -0.08 | -0.01 | -0.01 | -0.01 | |
| 0.83 | -0.07 | 1.27 | 0.29 | 0.40 | -1.24 | -0.18 | -0.38 | -0.43 | |
| 0.82 | -0.17 | 1.27 | 0.30 | 0.22 | -1.24 | -0.19 | -0.46 | -0.43 | |
| 0.01 | 0.10 | 0.00 | -0.01 | 0.18 | 0.00 | 0.01 | 0.08 | 0.00 | |
The magnetic anisotropy energies (MAE) per atom for all investigated clusters are compiled in Table 4. Positive MAE values denote an out-of-plane anisotropy while negative MAE values correspond to an in-plane magnetic easy axis. Fe clusters on Pt(111) and Au(111) show always an out-of-plane MAE whereas all other cluster substrate systems exhibit a rather nonuniform behaviour of their MAE with varying cluster size or geometry. This complex behaviour arises from the fact that already tiny changes in the electronic structure can cause large changes in the MAE. This can be seen again for example in the case of the compact trimers where one can observe a dramatic dependence of the MAE on their position with respect to the substrate, i.e. depending on whether a substrate atom is underneath the cluster centre or not.
All dimers and linear trimers with in-plane MAE have their magnetic easy axis fixed along the cluster axis which is a result of the strong azimuthal MAE in these systems being in the order of 1-4 meV per atom. For compact symmetric clusters as well as for the full monolayers there remains only a very small azimuthal MAE in the order of eV being thus negligible.
When evaluating the MAE by means of the torque method, contributions stemming from all individual atomic sites of the system are added together. One can therefore technically identify which portion of the MAE comes from the adsorbed atoms and which portion comes from the substrate atoms. We found that the contribution coming from the substrate is negligible in the case of clusters while it can be significant in the case of complete monolayers (e.g. up to 45% of the total value for the Co monolayer on the Pt(111) substrate). This is plausible given the fact that for monolayers, the substrate atoms are subject to interaction with a larger number of adsorbed atoms, meaning that their spin-polarization will be stronger and more robust than in the case of small clusters, contributing thereby more significantly to the MAE. At the same time, one has to bear in mind that energy is not an extensive quantity and that any decomposion of the MAE into parts has only a limited significance.
Concerning the dipole-dipole or shape MAE contribution, for clusters it is negligible while for complete monolayers it attains appreciable values of -0.19 meV and -0.09 meV per atom for Fe and Co monolayers, respectively. Moreover, we find that the substrate as well as the dipole-dipole contribution to the MAE is negligible for clusters, whereas for monolayers both contribution are much more important.
III.5 Comparison with other works
As already mentioned in the introduction it is not always straightforward to directly compare theoretical LSDA results obtained by different computational ab-initio implementations due to differences in the truncation of the wavefunction or Green’s function etc. as well as different technical issues and approches as for example the implementation of spin-orbit coupling as perturbation, the use of a supercell vs. embedding techniques or approximations in the description of the effective potentials and so forth. All this can affect the obtained numerical results, especially for sensitive magnetic quantities like for instance orbital magnetic moments and magnetic anisotropy energies.
Among the cluster/substrate systems discussed in this article, only Fe1 and Con on Pt(111) have been studied extensively by other groups and we find for these systems that our spin magnetic moments agree quantitatively well with the corresponding values given in Refs. GRV+03 ; EZWV08 ; LSW03 ; BST+09 ; SCL+03 ; CFB08 ; BH09 using identical geometries. The same is true for Fe3 on Pt(111) RGDP11 , Fe1 and Co1 on Ir(111) EZWV08 as well as for the monolayer systems Fe/Ir(111) EZWV08 ; BHB+06 , Co/Ir(111) EZWV08 , Fe/Pt(111), Co/Pt(111) EZWV08 and Co/Au(111) USBW96 . Regarding the values of and the MAE, however, the agreement is in general less good, i.e. only qualitative or worse, for the above mentioned reasons. As already analysed by Šipr et al. SBME11 , methods which rely on a supercell approach SCL+03 ; CFB08 ; BH09 produce always significantly higher induced spin magnetic moments within the substrate atoms when compared to methods which apply embedding techniques GRV+03 ; EZWV08 ; LSW03 ; BST+09 .
IV Summary and Conclusions
The evolution of the spin and orbital magnetic moments of the investigated 3 transition metal clusters on 5 noble metal surfaces mostly follows common trends and patterns that can be understood by considering the coordination numbers of atoms in the clusters and the polarizability of the substrate. The average values decrease nearly monotonously with the number of atoms in the cluster being at variance with trends observed for free clusters SME09a . Our results show that may strongly depend on the position of the cluster with respect to the surface atoms, as demonstrated in particular for the triangular 3-atom clusters on Pt(111) and Au(111). The magnetic moments for Ni clusters on Ir are smaller than one would expect judging from the trends for the other cluster/substrate combinations. Moreover, they depend wildly on number of atoms in the cluster and their smallness is compatible with the fact that the peak in minority DOS is below EF.
Apart from Nin/Ir(111) all clusters show a strong ferromagnetic isotropic exchange coupling exceeding the corresponding bulk values of standard bcc Fe, hcp Co and fcc Ni. In addition, there are also strong anisotropic DM interactions present revealing the intrinsic tendencies towards noncollinear magnetism in these systems. Finally, the magnetic anisotropy energies can be very large for some cluster/substrate or surface/substrate combinations, but unfortunately, there are no clear trends visible that would allow any straightforward anticipation of this sensitive quantity.
Acknowledgements.
Financial support by the Bundesministerium für Bildung und Forschung (BMBF) Verbundprojekt Röntgenabsorptionsspektroskopie (05K10WMA und 05K10GU5), Deutsche Forschungsgemeinschaft (DFG) via SFB668 and by the Grant Agency of the Czech Republic (108/11/0853) is gratefully acknowledged.References
- (1) P. Gambardella, S. Rusponi, M. Veronese, S. S. Dhesi, C. Grazioli, A. Dallmeyer, I. Cabria, R. Zeller, P. H. Dederichs, K. Kern, C. Carbone, and H. Brune, Science 300, 1130 (2003).
- (2) O. Šipr, S. Bornemann, J. Minár, S. Polesya, V. Popescu, A. Simunek, and H. Ebert, J. Phys.: Condensed Matter 19, 096203 (2007).
- (3) P. Mavropoulos, S. Lounis, and S. Blügel, phys. stat. sol. (b) 247, 1187 (2010).
- (4) A. Antal, B. Lazarovits, L. Udvardi, L. Szunyogh, B. Újfalussy, and P. Weinberger, Phys. Rev. B 77, 174429 (2008).
- (5) P. Ruiz-Díaz, R. Garibay-Alonso, J. Dorantes-Dávila, and G. M. Pastor, Phys. Rev. B 84, 024431 (2011).
- (6) S. Heinze, K. Bergmann, M. Menzel, J. Brede, A. Kubetzka, R. Wiesendanger, G. Bihlmayer, and S. Blügel, Nature Physics 7, 713 (2011).
- (7) S. Lounis, P. Mavropoulos, R. Zeller, P. H. Dederichs, and S. Blügel, Phys. Rev. B 75, 174436 (2007).
- (8) P. Ruiz-Díaz, J. L. Ricardo-Chávez, J. Dorantes-Dávila, and G. M. Pastor, Phys. Rev. B 81, 224431 (2010).
- (9) S. H. Vosko, L. Wilk, and M. Nusair, Can. J. Phys. 58, 1200 (1980).
- (10) H. Ebert, D. Ködderitzsch, and J. Minár, Rep. Prog. Phys. 74, 096501 (2011).
- (11) R. Zeller, P. H. Dederichs, B. Újfalussy, L. Szunyogh, and P. Weinberger, Phys. Rev. B 52, 8807 (1995).
- (12) S. Bornemann, J. Minár, S. Polesya, S. Mankovsky, H. Ebert, and O. Šipr, Phase Transitions 78, 701 (2005).
- (13) V. P. Antropov, M. I. Katsnelson, B. N. Harmon, M. van Schilfgaarde, and D. Kusnezov, Phys. Rev. B 54, 1019 (1996).
- (14) V. P. Antropov, M. I. Katsnelson, and A. I. Liechtenstein, Physica B 237-238, 336 (1997).
- (15) L. Udvardi, L. Szunyogh, K. Palotas, and P. Weinberger, Phys. Rev. B 68, 104436 (2003).
- (16) S. Bornemann, J. Minár, J. Braun, D. Ködderitzsch, and H. Ebert, Solid State Communications 152, 85 (2012).
- (17) S. Mankovsky, S. Bornemann, J. Minár, S. Polesya, H. Ebert, J. B. Staunton, and A. I. Lichtenstein, Phys. Rev. B 80, 014422 (2009).
- (18) O. Šipr, S. Bornemann, J. Minár, and H. Ebert, Phys. Rev. B 82, 174414 (2010).
- (19) J. B. Staunton, L. Szunyogh, A. Buruzs, B. L. Gyorffy, S. Ostanin, and L. Udvardi, Phys. Rev. B 74, 144411 (2006).
- (20) G. Y. Guo and H. Ebert, Phys. Rev. B 51, 12633 (1995).
- (21) R. Tyer, G. van der Laan, W. M. Temmerman, Z. Szotek, and H. Ebert, Phys. Rev. B 67, 104409 (2003).
- (22) F. Wilhelm, P. Poulopoulos, G. Ceballos, H. Wende, K. Baberschke, P. Srivastava, D. Benea, H. Ebert, M. Angelakeris, N. K. Flevaris, D. Niarchos, A. Rogalev, and N. B. Brookes, Phys. Rev. Letters 85, 413 (2000).
- (23) F. Wilhelm, P. Poulopoulos, H. Wende, A. Scherz, K. Baberschke, M. Angelakeris, N. K. Flevaris, and A. Rogalev, Phys. Rev. Letters 87, 207202 (2001).
- (24) F. Wilhelm, M. Angelakeris, N. Jaouen, P. Poulopoulos, E. T. Papaioannou, C. Mueller, P. Fumagalli, A. Rogalev, and N. K. Flevaris, Phys. Rev. B 69, 220404 (2004).
- (25) V. V. Krishnamurthy, D. J. Singh, N. Kawamura, M. Suzuki, and T. Ishikawa, Phys. Rev. B 74, 064411 (2006).
- (26) M. M. Sigalas and D. A. Papaconstantopoulos, Phys. Rev. B 50, 7255 (1994).
- (27) K. von Bergmann, S. Heinze, M. Bode, E. Y. Vedmedenko, G. Bihlmayer, S. Blügel, and R. Wiesendanger, Phys. Rev. Lett. 96, 167203 (2006).
- (28) A. Deák, L. Szunyogh, and B. Ujfalussy, Phys. Rev. B 84, 224413 (2011).
- (29) J. Honolka, T. Y. Lee, K. Kuhnke, D. Repetto, V. Sessi, P. Wahl, A. Buchsbaum, P. Varga, S. Gardonio, C. Carbone, S. R. Krishnakumar, P. Gambardella, M. Komelj, R. Singer, M. Fähnle, K. Fauth, G. Schütz, A. Enders, and K. Kern, Phys. Rev. B 79, 104430 (2009).
- (30) V. Sessi, K. Kuhnke, J. Zhang, J. Honolka, K. Kern, A. Enders, P. Bencok, S. Bornemann, J. Minár, and H. Ebert, Phys. Rev. B 81, 195403 (2010).
- (31) C. Etz, J. Zabloudil, P. Weinberger, and E. Y. Vedmedenko, Phys. Rev. B 77, 184425 (2008).
- (32) B. Lazarovits, L. Szunyogh, and P. Weinberger, Phys. Rev. B 67, 24415 (2003).
- (33) T. Balashov, T. Schuh, A. F. Takács, A. Ernst, S. Ostanin, J. Henk, I. Mertig, P. Bruno, T. Miyamachi, S. Suga, and W. Wulfhekel, Phys. Rev. Letters 102, 257203 (2009).
- (34) R. F. Sabiryanov, K. Cho, M. I. Larsson, W. D. Nix, and B. M. Clemens, J. Magn. Magn. Materials 258-259, 365 (2003).
- (35) A. M. Conte, S. Fabris, and S. Baroni, Phys. Rev. B 78, 014416 (2008).
- (36) P. Blonski and J. Hafner, J. Phys.: Condensed Matter 21, 426001 (2009).
- (37) B. Újfalussy, L. Szunyogh, P. Bruno, and P. Weinberger, Phys. Rev. Letters 77, 1805 (1996).
- (38) O. Šipr, S. Bornemann, J. Minár, and H. Ebert, Phys. Rev. B 82, 174414 (2010).
- (39) O. Šipr, J. Minár, and H. Ebert, Cent. Eur. J. Phys. 7, 257 (2009).