Molecular line contamination in the SCUBA-2 450 and 850 continuum data
Abstract
Observations of the dust emission using millimetre/submillimetre bolometer arrays can be contaminated by molecular line flux, such as flux from 12CO. As the brightest molecular line in the submillimetre, it is important to quantify the contribution of CO flux to the dust continuum bands. Conversion factors were used to convert molecular line integrated intensities to flux detected by bolometer arrays in mJy beam-1. These factors were calculated for 12CO line integrated intensities to the SCUBA-2 850 and 450 bands. The conversion factors were then applied to HARP 12CO 3–2 maps of NGC 1333 in the Perseus complex and NGC 2071 and NGC 2024 in the Orion B molecular cloud complex to quantify the respective 12CO flux contribution to the 850 dust continuum emission. Sources with high molecular line contamination were analysed in further detail for molecular outflows and heating by nearby stars to determine the cause of the 12CO contribution. The majority of sources had a 12CO 3–2 flux contribution under 20 per cent. However, in regions of molecular outflows, the 12CO can dominate the source dust continuum (up to 79 per cent contamination) with 12CO fluxes reaching 68 mJy beam-1.
keywords:
submillimetre – instrumentation: detectors – dust, extinction – ISM: molecules – stars: formation – ISM: jets and outflows.1 Introduction
Dust continuum is a useful tracer of star formation. The submillimetre (roughly 300 to 1000 ) detection of the dust emission identifies Class 0 and prestellar cores as well as disks, filamentary structure in molecular clouds, and the dust and gas masses of galaxies. In order to quantify the flux from dust in the submillimetre wavelengths, the heat generated by the radiation is measured by bolometers with the detected wavelength range defined by wide-band filters (Holland et al., 2002). These observations of broadband continuum emission from the dust can be contaminated by molecular line flux, particularly from 12CO, which is the second most abundant molecule in the interstellar medium (after H2) with strong emission lines in the submillimetre (Johnstone et al., 2003; Seaquist et al., 2004; Hatchell & Dunham, 2009; Zhu et al., 2003). Since the molecular line contamination depends explicitly on the bandwidth and wavelength of the bolometer, it is important to quantify the potential contribution from molecular lines to make accurate flux measurements of the submillimetre dust emission used to calculate masses.
The CO line contribution can be quantified by comparing observations of the dust continuum emission and the CO line emission (Gordon, 1995). Past research (Johnstone & Bally, 1999; Davis et al., 2000; Papadopoulos & Allen, 2000; Tothill et al., 2002) has studied the Submillimetre Common User Bolometer Array (SCUBA) at the James Clerk Maxwell Telescope (JCMT), where line contribution from the 12CO 3–2 line was found to range from little to tens of per cent in the 850 band. Other studies have examined contamination in various bolometer instruments, including MAMBO-II, Bolocam, and SHARC-II. The Submillimetre High Angular Resolution Camera II (SHARC-II) operates at the same wavelength range as SCUBA (450 and 850 ), but also includes a 350 filter (780 to 910 GHz). The 350 SHARC-II continuum could be potentially contaminated by the 12CO 7–6 line (806 GHz) up to 20 per cent, similar to the 12CO 3–2 contamination to the SCUBA 850 continuum (Hatchell & Dunham, 2009). While Bolocam (operated at Caltech at 1.1 mm with a 250 to 300 GHz filter) has been designed to exclude 12CO line contamination, the Max Planck Millimetre Bolometer II (MAMBO-II; operated by the Max Planck Institut für Radioastronomie at 1.2 mm with a 210 to 290 GHz filter) includes 12CO 2–1 (230 GHz) molecular line emission which could potentially increase flux at most a few percent (Aguirre et al., 2011). Other possible contamination for Bolocam and MAMBO-II could result from other known molecular lines in clouds, including SiO 6–5 (260 GHz) and HCN 3–2 (258 GHz).
The successor to SCUBA is SCUBA-2, a 10,000 pixel submillimetre camera on the JCMT with eight sub-arrays. SCUBA-2 operates at 450 and 850 , like SCUBA, and can be susceptible to significant molecular line contamination. In regards to 12CO, both SCUBA-2 bandpass filters have a central transmission peak near a 12CO line: the 850 bandpass filter centre is at 347 GHz near the 12CO 3–2 line at 345.796 GHz and the 450 bandpass filter centre is 664 GHz near the 12CO 6–5 line at 691.473 GHz. The proximity of the 12CO line frequencies to the centres of the transmission peaks makes significant CO contamination in SCUBA-2 maps likely.
In this paper, we have calculated conversion factors used to convert maps of molecular line integrated intensity (K km s-1) to maps of molecular line flux (mJy beam-1) that contaminates the dust continuum emission. These conversion factors were calculated for 12CO 3–2 contributions to the 850 SCUBA-2 dust continuum emission and for 12CO 6–5 contributions to the 450 SCUBA-2 continuum. Conversion factors were applied to HARP 12CO maps of NGC 1333, a region in the Perseus molecular cloud complex, and NGC 2071 and NGC 2024, regions in the Orion B molecular cloud complex, to calculate the contamination directly by measuring fluxes and masses from a list of sources. Once the 12CO contamination to the source fluxes was calculated, the sources with the highest contamination were analysed in more detail to determine the cause of the molecular flux contribution, e.g. molecular outflows or hot molecular gas from nearby stars.
This paper has six sections. In Section 2, we give details of the calculation of the conversion factors considering different weather grades (Section 2.1). Section 3 presents the resulting conversion factors calculated for 12CO 3–2 (contributing to the 850 continuum band) and 12CO 6–5 (contributing to the 450 continuum band). Section 4 explains how the conversion factors were applied to HARP 12CO 3–2 maps to quantify the amount of contamination to the 850 SCUBA-2 dust continuum maps of three regions, NGC 1333, NGC 2071, and NGC 2024. Section 4.1 and 4.2 introduce flux and mass calculations for a list of sources in the regions, and Section 4.3 presents further analysis of sources with high 12CO contamination. Section 5 discusses the results, including the effects of environment and location (molecular outflows and hot ambient gas from nearby stars) on the 12CO source contamination. This section also includes estimates of the 12CO 6–5 line to the 450 SCUBA-2 dust emission. Lastly, Section 6 summarises the conclusions drawn from this work.
2 Method
Molecular line emission is typically measured as an intensity or surface brightness in terms of the Rayleigh-Jeans (R-J) brightness temperature (in Kelvin), while the dust continuum fluxes are given in Janskys measured over the telescope beam area (Jy beam-1). In order to convert 12CO line intensities to pseudo-continuum fluxes, the intensity of a molecular line must be converted into the flux of the line using the following relation
| (1) |
where is the intensity and is the telescope beam area. The intensity is measured as a main-beam brightness temperature in Kelvin and converted to intensity using
| (2) |
where is the frequency, is the wavelength, and is the Boltzmann constant.
A narrow molecular line within a filter contributes flux over a smaller frequency range () than continuum emission across the filter. To obtain the flux from the molecular line, the average intensity must be calculated over the full filter band, i.e.
| (3) |
where is the intensity of the molecular line, is the filter passband (transmission) at the frequency of the molecular line, and is the integrated filter passband (transmission) across the full range of filter frequencies. Using Equation 2 and the Doppler shift, , Equation 3 can be converted to :
| (4) |
where is the velocity integrated main-beam brightness temperature, or integrated intensity. Using these calculations of intensity, it follows from Equation 1 that
| (5) |
A similar calculation was used in Seaquist et al. (2004).
The main-beam brightness temperature is used rather than the antenna temperature for analysing small-scale emission as long as the continuum calibration accounts for the same beam efficiencies as the molecular line emission. This is true for the SCUBA-2 and HARP pairing at the JCMT. The beam efficiencies are discussed further in Section 4. is related to by the following:
| (6) |
where is the main-beam efficiency factor. The efficiency factor that takes into account emission at larger scales is discussed in Section 2.2. At 345 GHz with HARP on JCMT, is 0.61 (Buckle et al., 2009). The telescope beam area, also discussed further in Section 2.2, is measured in steradians (sterad) and obtained from the full-width-half-maximum (FWHM) of a Gaussian beam using where the FWHM :
| (7) |
Using Equation 5, a molecular line conversion factor, C, can be calculated to convert molecular line maps, measured in the velocity integrated main-beam temperature (K km s-1), into maps of line flux (mJy beam-1) that contributes to the observed continuum emission,
where frequencies are measured in GHz and . Note that the beam size is wavelength dependent, where . The difference in beam size between the 12CO line and the SCUBA-2 filter is not taken into account.
2.1 Line Conversion Factors
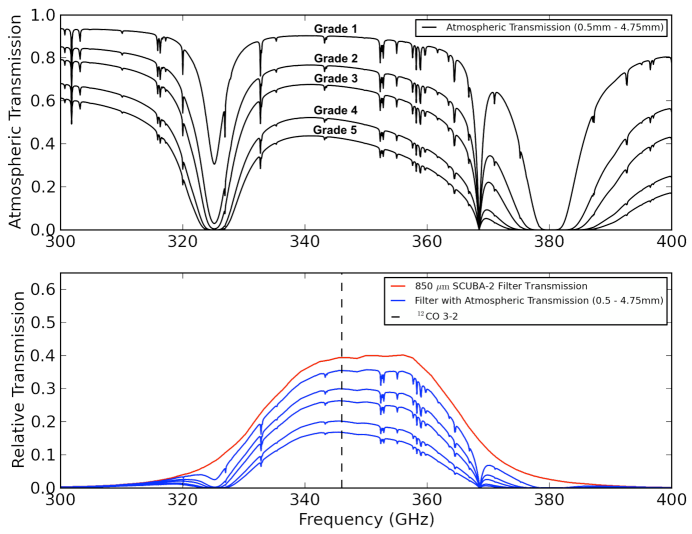
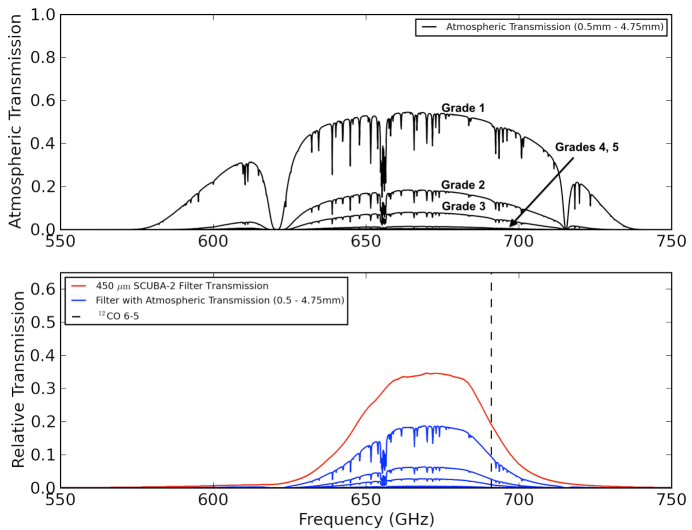
To calculate the conversion factor C from Equation 2, the SCUBA-2 filter profiles and the added atmospheric transmission were used to find and . The SCUBA-2 850 and 450 filter profiles are shown in the bottom plot of Figures 1 and 2. The SCUBA-2 filter profiles are a result of stacking all of the filters (thermal and bandpass filters as well as the cryostat window and dichroic) that form the continuum bandpasses when combined with the atmosphere. The bandpasses are the main filters defining the transmission window, where passbands are the range of frequencies with a signal passing through the filter and stopbands define frequency ranges with a signal attenuated by the filter. The main infrared (IR; thermal) blocking filters are designed to block transmission at higher frequencies (IR and optical). For this study, a constant value for these filters has been assumed due to the high transmission in our frequency range. For further information, see the JCMT website regarding the cryostat window, filter and dichroic specification and measurements111http://www.jach.hawaii.edu/JCMT/continuum/scuba2/filter/.
The JCMT has a system that describes the atmospheric conditions ranging from weather grades 1-5. The atmospheric conditions are based on precipitable water vapour (PWV) levels (in mm) that correspond to different sky opacities at 225 GHz, or . The relation between PWV and is the following (JCMT Telescope Overview website)222www.jach.hawaii.edu/JCMT/overview/tel_overview:
| (9) |
The JCMT weather grades are defined as:
-
•
Grade 1: PWV: mm, :
-
•
Grade 2: PWV: 1 to 1.75 mm, : 0.05 to 0.08
-
•
Grade 3: PWV: 1.75 to 2.75 mm, : 0.08 to 0.12
-
•
Grade 4: PWV: 2.75 to 4.75 mm, : 0.12 to 0.20
-
•
Grade 5: PWV: mm, :
The continuum bandpass transmission of the filter profile and atmosphere combined varies depending on atmospheric conditions. Therefore, the CO contamination was calculated based on these five weather grades. Plots of atmospheric transmission corresponding to these conditions can be found in the top half of Figures 1 and 2 and are labelled according to the respective water vapour levels (for more detail, see CSO Atmospheric Transmission Interactive Plotter website).333http://www.submm.caltech.edu/cso/weather/atplot.shtml The SCUBA-2 850 and 450 filter profiles were multiplied by each individual atmospheric transmission profile to produce continuum bandpass profiles at each weather grade, shown in the bottom of Figures 1 and 2.
In Equation 5, is the integrated SCUBA-2 continuum bandpass and is calculated as the the sum of (where is 0.01 GHz) at each corresponding frequency with units in GHz. The transmission of 12CO, , is the transmission of the SCUBA-2 850 continuum bandpass at 345.7960 GHz (the rest frequency of the 12CO 3–2 line) and the transmission of the SCUBA-2 450 continuum bandpass at 691.4731 GHz (the rest frequency of the 12CO 6–5 line). To calculate conversion factors for redshifted lines, the frequency and transmission (line) (from Figures 1 & 2) in Equation 2 must be changed appropriately. The SCUBA-2 beam size is calculated using Equation 7 assuming the main-beam FWHM is 13.8′′ at 850 and 8.3′′ at 450 . The possibility of an associated secondary beam is discussed in Section 2.2.
| Band | Filter with | Line | Weather | C | |||||
|---|---|---|---|---|---|---|---|---|---|
| Atmospheric Trans. | GHz | ′′ | GHz | Grade | mJy beam-1 per | ||||
| (PWV in mm) | K km s-1 | ||||||||
| SCUBA-2 850 | 0.5 | 19.79 | 13.8 | 12CO 3–2 | 345.7960 | 0.58 | 0.03 | 1 | 0.63 |
| 1.5 | 15.63 | 13.8 | 12CO 3–2 | 345.7960 | 0.49 | 0.07 | 2 | 0.68 | |
| 2.25 | 13.24 | 13.8 | 12CO 3–2 | 345.7960 | 0.43 | 0.10 | 3 | 0.70 | |
| 3.75 | 9.56 | 13.8 | 12CO 3–2 | 345.7960 | 0.33 | 0.16 | 4 | 0.74 | |
| 4.75 | 7.71 | 13.8 | 12CO 3–2 | 345.7960 | 0.28 | 0.20 | 5 | 0.77 | |
| SCUBA-2 450 | 0.5 | 8.49 | 8.3 | 12CO 6–5 | 691.4731 | 0.09 | 0.03 | 1 | 0.64 |
| 1.5 | 2.64 | 8.3 | 12CO 6–5 | 691.4731 | 0.02 | 0.07 | 2 | 0.57 | |
| 2.25 | 1.10 | 8.3 | 12CO 6–5 | 691.4731 | 0.01 | 0.10 | 3 | 0.51 | |
| 3.75 | 0.19 | 8.3 | 12CO 6–5 | 691.4731 | 0.16 | 4 | 0.41 | ||
| 4.75 | 0.06 | 8.3 | 12CO 6–5 | 691.4731 | 0.20 | 5 | 0.35 |
2.2 Telescope Beam Area
The beam profile of the original SCUBA instrument diverged from a single Gaussian and displayed a beam profile of two combined Gaussians: a primary beam roughly corresponding to the assumed FWHM and a secondary beam of 40′′ FWHM (Di Francesco et al., 2008). For the 450 maps, the primary beam had a 8.5′′ FWHM with a 0.90 relative amplitude and the secondary beam had a 0.10 relative amplitude. For the 850 maps, the primary beam had a 13.5′′ FWHM with a 0.96 relative amplitude and the secondary beam had a 0.04 relative amplitude.
It is possible that the total beam of SCUBA-2 also includes a broader secondary component. As explained in Section 2.1, the telescope beam areas for this study were calculated assuming FWHMs for the 450 (8.3′′) & 850 (13.8′′) SCUBA-2 beams. The primary beam is appropriate for studying the CO contamination in compact sources (small-scale emission), e.g. protostars and small outflows. However, if the CO emission is both bright and extended, then it may be necessary to include the secondary beam in the calculation. By fitting a two component Gaussian to coadded SCUBA-2 maps of Uranus, the 450 primary FWHM is 8.7′′ (relative amplitude 0.83) and secondary FWHM is 20.4′′ (relative amplitude 0.17) and the 850 primary FWHM is 13.9′′ (relative amplitude 0.97) and secondary beam FWHM is 39.1′′ (relative amplitude 0.03).444Measured primary beam sizes are slightly larger than the sizes quoted in Section 2.1. This is potentially due to small pointing shifts between coadded maps. The effective FWHM becomes 11.6′′ and 15.3′′ for 450 and 850 beams respectively. This would cause the total beam area for 450 to be higher by a factor of 2.0 and the 850 total beam area to be higher by a factor or 1.2.
If it is necessary to incorporate the secondary beam into the beam area calculation, then a new conversion factor can be calculated using Equation 2. The conversion factors are directly proportional to the telescope beam area. Assuming is the the conversion factor with the inclusion of both a primary and secondary beam () and is the relation shown in Equation 2, then it follows from Equation 2:
| (10) |
where FWHM′ is the effective FWHM. For large-scale and extended emission on scales significantly larger than the size of the telescope beam (greater than 13.8′′, the 850 FWHM), it is also more appropriate to use , the forward spillover and scattering efficiency, to calibrate the CO emission instead of the main-beam efficiency . The forward spillover and scattering efficiency measures the amount of coupling to an extended source up to a 30′ diameter (measured by observing the Moon). Equation 10 becomes
| (11) |
The increase of telescope beam area caused from the inclusion of the secondary beam is somewhat counterbalanced by the use of rather than , accounting for the more efficient telescope coupling to large-scale emission ( compared to ).
The secondary beam and potential changes in conversion factors for large-scale emission are further discussed in Section 5.
3 Results
The 12CO conversion factors, C, for SCUBA-2 are listed in Table 1. The 12CO 3–2 conversion factors (in mJy beam-1 per K km s-1) range from 0.63 (Grade 1) to 0.77 (Grade 5) with a mid value of 0.70 (Grade 3). The conversion factors change depending on the atmospheric conditions that affect the continuum bandpass profile. Since each increase in causes the 850 continuum bandpass profile to become narrower with less overall transmission, in Equation 5 shrinks faster than the transmission of 12CO, . Therefore, the 12CO 3–2 line contribution to the flux is lowest in Grade 1 weather and steadily increases with each step to Grade 5 weather.
For the 450 continuum bandpass profile, the opposite trend is seen. The 12CO line contribution to the 450 flux is highest in Grade 1 but steadily decreases with each step to Grade 5 weather. In most cases, observations using SCUBA-2 450 would only be taken in Grade 1 to 3 weather due to the decreased transmission in higher weather grades. The 12CO 6–5 conversion factors range from 0.64 (Grade 1) to 0.35 (Grade 5) with a mid value of 0.51 (Grade 3).
Note that the contamination is expected to have different behaviour between the 450 and 850 filters. The 12CO 3–2 line is in the centre of the 850 filter with the bulk of the transmission while the 12CO 6–5 line is close to the edge of the 450 filter with lower transmission. The molecular line contribution to the 450 band decreases with weather grade because of the increasing attenuation of the 12CO 6–5 line.
4 Applications to Observations
The conversion factors calculated in Section 3 were applied to HARP 12CO 3–2 maps and compared to SCUBA-2 850 dust emission maps to measure the 12CO contamination directly. Three different regions were used for this study: NGC 1333, NGC 2071, and NGC 2024. By quantifying the percentage of contamination to the dust continuum flux, we can determine regions more likely to be contaminated by CO (i.e. regions with molecular outflows or nearby stars).
4.1 Flux Calculations
The continuum observations were taken with SCUBA-2 at 450 and 850 in each region in 2010 during the SCUBA-2 Shared Risk Observing (S2SRO) campaign when SCUBA-2 had two science grade arrays (one at 450 and one at 850 ) installed. Observations were taken in Grade 2 weather conditions.
The Heterodyne Array Receiver Programme (HARP) is a 16 pixel array receiver (16 receptors separated by 30′′ and a footprint of 2′). The 12CO 3–2 data cube for NGC 1333 was observed in January 2007 using raster mapping techniques (for details see Curtis et al. 2010). The 12CO 3–2 data cubes for NGC 2071 and NGC 2024 were observed in November 2007 using raster mapping techniques as well (see Buckle et al. 2010). Both datacubes were rebinned to 0.42 km s-1 velocity channels and converted to using a main-beam efficiency of 0.61.
Similar to other ground-based bolometer arrays, the limited, single-subarray version of SCUBA-2 available for S2SRO reproduced maps that are not sensitive to large-scale emission, in this case on scales larger than the single subarray field-of-view (4′). However, the HARP 12CO maps still contain this large-scale flux. A simple application of the CO conversion factors from Table 1 to the HARP maps would retain the large-scale structure and overestimate the CO contamination. In order to account for the spatial filtering inherent in bolometer array reconstruction in a simple way and subtract the large-scale flux from the maps, a Gaussian smoothing mask (GSM) filter was applied to both the 12CO HARP integrated intensity maps (in K km s-1) and the 850 maps (mJy beam-1) of the regions. The GSM filter was designed to minimise emission from structure on scales inaccessible to SCUBA-2 at this time. For the HARP maps, GSM filters were created by convolving a HARP 12CO contamination map directly with a Gaussian a few arc minutes FWHM in size and subtracting the resulting smoothed map from the original map. For the SCUBA-2 maps, it was necessary to first create a thresholded map for masking bright protostars and convolve the thresholded map with a Gaussian the same FWHM in size. The resulting smoothed map was then subtracted from the original map.
A FWHM Gaussian was chosen for generating GSM maps after analysing to GSM filter sizes, further discussed in Section 4.1.4. Figure 3 shows examples of the SCUBA-2 GSM processed maps for protostellar cores LBS-MM18 (NGC 2071-IRS) in NGC 2071 (see Motte et al. 2001), FIR 1-7 in NGC 2024(see Richer et al. 1989; Buckle et al. 2010), and SVS13 in NGC 1333 (see Hatchell et al. 2007). The brightest CO features in the maps are the result of molecular outflows driven by the dense cores in the regions. Dust emission contours in the outflows of these regions clearly follow the 12CO 3–2 emission, indicating the CO contamination is strong enough to be directly detected in the dust continuum.
To study the CO contamination quantitatively, aperture photometry with a 15′′ radius was applied to lists of known submillimetre sources, listed in Table LABEL:table:source_list and further discussed in Sections 4.1.1, 4.1.2, and 4.1.3. A 15′′ aperture radius was chosen based on source proximity and the possibility of the aperture diameter extending to a neighbouring source. Integrated flux densities are calculated by assuming a sky background of zero with flux uncertainties based on the sky RMS and include a correction for the Gaussian beam (Enoch et al., 2006). Therefore, a point-source has the same integrated flux density in any size aperture.
4.1.1 Application to NGC 1333
NGC 1333 is a reflection nebula in the Perseus molecular cloud and is characterised by early stage star formation of age less than 1 Myr (Lada et al., 1996; Wilking et al., 2004). The flux calibration for the S2SRO maps of this region was the CRL618 nebula and pointing checks were from the active galactic nucleus 3C84. A flux conversion factor (FCF) of 500 Jy beam-1 pW-1 was used for NGC 1333 to convert the maps into mJy beam-1. Sources were chosen from a list of cores in NGC 1333 (Hatchell et al., 2007) that had been previously identified in the submillimetre using SCUBA (Hatchell et al., 2005) and Bolocam (Enoch et al., 2006) with a total of 35 sources in the area covered by the SCUBA-2 map. These sources include a mixture of protostellar and starless cores. For further information regarding HARP observations, see Curtis et al. (2010).
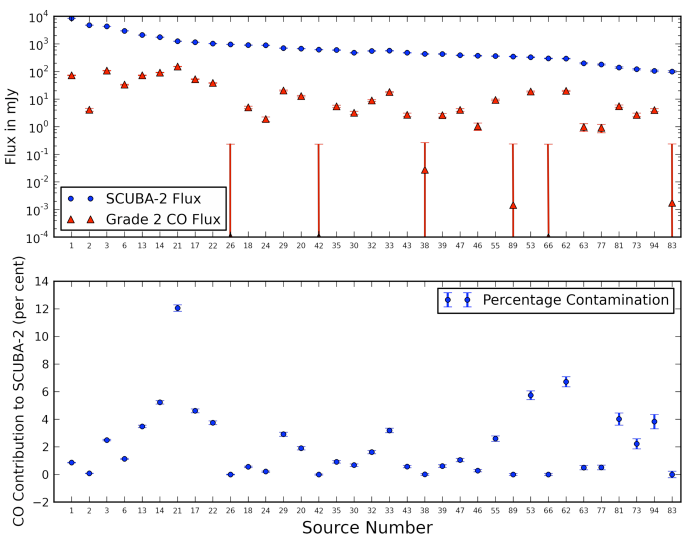
Figure 4 shows the source fluxes from the SCUBA-2 850 and 12CO 3–2 Grade 2 contamination maps and the percentage contribution of 12CO 3–2 flux to 850 SCUBA-2 flux. It should be noted that all of the sources have 12CO contributions less than 20 per cent and every source except one (source 21) has a contribution less than 10 per cent. Source 21 is further discussed in Section 4.3.
4.1.2 Application to NGC 2071
NGC 2071 is a region in the Orion B molecular cloud. Sources were chosen from a list of young stellar objects that had been previously identified using SCUBA (Nutter & Ward-Thompson, 2007) with a total of 50 sources in the area covered by the SCUBA-2 map. A flux conversion factor of 685 Jy beam-1 pW-1 was used for NGC 2071 as well as NGC 2024 (FCF value valid for October 2010 reduction, equivalent to Nutter et al, in prep.). For further information on HARP observations of NGC 2071, see Buckle et al. (2010).
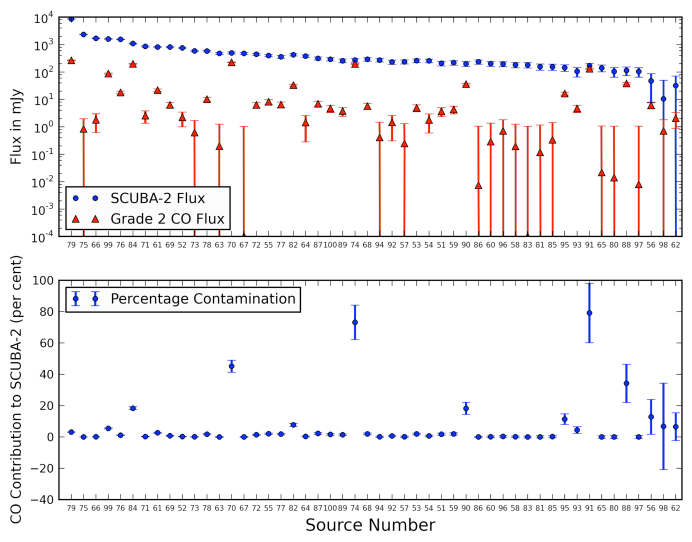
Figure 5 shows the source fluxes from the SCUBA-2 850 and 12CO 3–2 Grade 2 contamination maps and the percentage contribution of 12CO 3–2 flux to SCUBA-2 850 flux. Note that the majority of sources have 12CO contributions of less than 20 per cent in Grade 2 weather. Four sources (sources 70, 74, 88, and 91) have 12CO contributions greater than 20 per cent (ranging from 34 to 79 per cent). Sources with a higher 12CO contamination are further discussed in Section 4.3.
4.1.3 Application to NGC 2024
NGC 2024 is another emission nebula in the Orion B molecular cloud. Sources were chosen from a list of young stellar objects in NGC 2024 that had been previously observed using SCUBA (Nutter & Ward-Thompson, 2007) with a total of 24 sources in the area covered by the SCUBA-2 map. As stated in Section 4.1.2, a FCF of 685 Jy beam-1 pW-1 was used to correspond with current studies of Orion B (FCF value valid for October 2010 reduction, equivalent to Nutter et al, in prep.). For further information on HARP observations of NGC 2024, see Buckle et al. (2010).
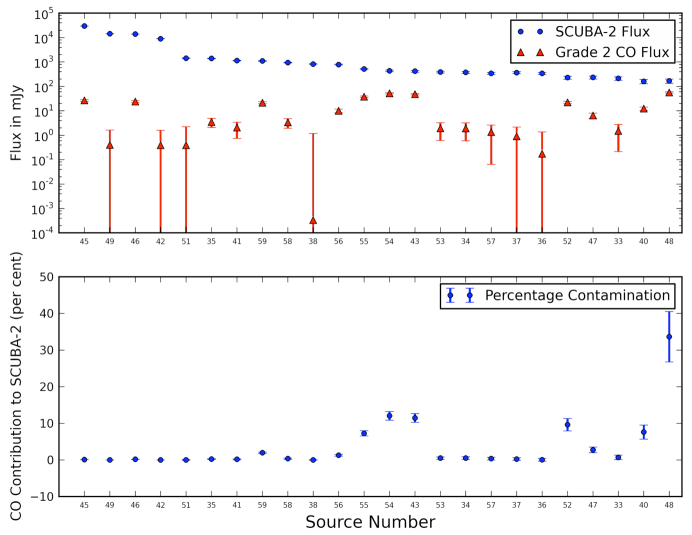
Figure 6 shows the source fluxes from the SCUBA-2 850 and 12CO 3–2 Grade 2 contamination maps and the percentage contribution of 12CO 3–2 flux to SCUBA-2 850 flux. Note that the majority of sources have 12CO contributions of less than 20 per cent. One source (source 48) has a 12CO contribution more than 20 per cent (34 per cent contamination), further discussed in Section 4.3.
4.1.4 GSM Analysis
For SCUBA-2, GSM filters were created by applying upper thresholds to the original SCUBA-2 maps which acted as a mask for source emission and convolving the thresholded maps with a Gaussian a few arcminutes in FWHM size (similar to Reid & Wilson 2005; Kirk et al. 2006); this is a standard technique for the SCUBA-2 data. Negative regions of flux, known as negative ‘bowls,’ surround very strong sources in the SCUBA-2 maps and are produced in the map reconstruction process (see Johnstone et al. 2000). SCUBA-2 thresholding was necessary to prevent introducing new negative bowls in the image caused by smoothing and subtracting bright continuum sources. Without thresholding, artificial negative bowling would have been further added to the map, causing negative flux to lower source fluxes and increase the calculated 12CO 3-2 contamination. To test the effects of changing the filter size, S2SRO maps were analysed with an upper threshold of 15 mJy beam-1 for NGC 1333 and 30 mJy beam-1for NGC 2071 and NGC 2024 (used to mask out bright sources) and to FWHM Gaussian smoothing. Aperture fluxes from each of the GSM maps (, , and ) and the original, unsmoothed S2SRO maps were found to agree within uncertainties, indicating that the emission on scales which would have been affected by the GSM filter had been filtered out by the SCUBA-2 map reconstruction. The and GSM filters were further analysed with application to the HARP 12CO maps based on the similarity between S2SRO and SCUBA maps, for which scales greater than are known to be poorly reproduced (Hatchell et al., 2007).
For the HARP 12CO maps, thresholding was not required because 12CO mainly traces molecular outflows which have bright, extended structures on scales not fully reproduced by SCUBA-2. To generate the 12CO GSM maps, GSM filters with and FWHM Gaussians were directly applied and subtracted from the original maps. Negative flux regions in the final HARP maps resulting from the oversubtraction of background flux estimated by the GSM filter was set to 0 mJy beam-1 to prevent biasing the source fluxes in the aperture photometry process. The S2SRO and GSM maps were subtracted from the corresponding 12CO GSM maps (Grade 2 contamination) to analyse the GSM filter effectiveness in matching the spatial filtering of the SCUBA-2 maps. Positive flux in the residuals indicates higher 12CO flux than 850 dust continuum flux, suggesting that the GSM filter size should be scaled down to subtract smaller scale emission. In each of the regions, the GSM residuals were found to overestimate the 12CO flux contribution to the dust continuum. On average, the GSM map residuals were 1.4 to 1.5 times greater than the GSM. The GSM filters were applied to both the S2SRO and HARP maps for consistency in eliminating flux on scales of and above.
With the full complement of subarrays, SCUBA-2 is likely to recover more large-scale structure and continuum fluxes may increase further. A comparison of 12CO contamination on scales of 1′ or greater will have to wait for full SCUBA-2 operations.
4.2 Mass Calculations
The calculation of the dust continuum flux from pre- and protostellar sources in a molecular cloud can be used to obtain source masses (Hildebrand, 1983). Depending on the molecular cloud environment surrounding the sources, contamination from the 12CO line emission may affect low- and high-mass sources, leading to a varying level of source contamination. Therefore, the masses of sources were calculated using the relation between the dust and gas mass and the total source dust continuum flux (e.g. Seaquist et al. 2004; Enoch et al. 2006),
| (12) |
where is the flux from 15′′ radius aperture photometry at 850 , is the distance to the source, is the dust opacity at 850 and is the Planck function at 850 for the dust temperature .
4.2.1 Mass Calculations for NGC 1333
For NGC1333, a distance of 250 pc was assumed for the mass calculations. Hatchell et al. (2007) used a distance of 320 pc, which would increase masses by a factor of 1.6. A temperature of 10 K was used as an estimate of the dust temperature, where dense regions that do not have internal heating are colder on the inside and warmer on the outside (Evans et al., 2001). Cores with internal heating are warmer in the inner regions. For example, Class 0 and Class I protostars are found from models to have K (Shirley et al., 2002; Young et al., 2003), but most of the dust mass is found in areas of lower temperatures. To cover pre- and protostellar sources, K is a commonly used average. It should be noted that this value can overestimate the masses of protostellar sources by a factor of 2 to 3 if the temperature is warmer (Enoch et al., 2006).
The dust opacity is also uncertain for individual regions. Hatchell et al. (2007) assumed a dust opacity of 0.012 cm2g-1 for the 850 SCUBA dust emission maps of NGC 1333 based on a gas/dust ratio of 161 (see Ossenkopf & Henning 1994). This dust opacity is at the low end of the assumed values and a dust opacity of 0.02 cm2g-1 at 850 could have been used (Kirk et al., 2006). Here, we choose a dust opacity of 0.012 cm2g-1. If 0.02 cm2g-1 were used, then our masses would decrease by a factor of 1.7.
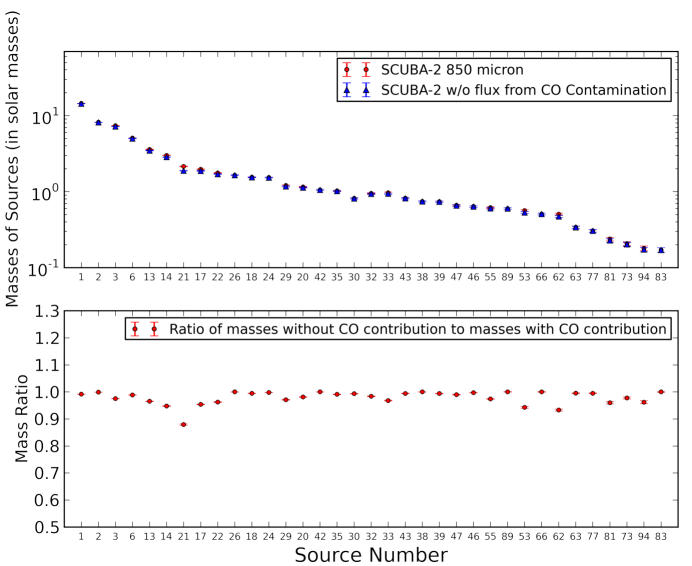
Masses were calculated from source fluxes obtained from continuum emission with and without 12CO contamination taken into account. The bottom portion of Figure 7 shows the ratio between these masses. Due to the CO flux contamination, the calculated source masses are being overestimated by up to a factor of 1.2.
4.2.2 Mass Calculations for NGC 2071 and NGC 2024
For NGC 2071 and NGC 2024, parameters from past mass estimates (Nutter & Ward-Thompson, 2007) were used to calculate source masses. A distance of 400 pc was assumed for both regions (Brown et al., 1994) and a temperature of 20 K was assumed as an estimate of the dust temperature (Launhardt et al., 1996; Mitchell et al., 2001; Johnstone & Bally, 2006). An 850 dust opacity of 0.01 cm2 g-1 was used (André et al., 2003; Andre et al., 1996; Ward-Thompson et al., 1999), similar to the dust opacity used for NGC 1333. As in NGC 1333, the assumption of a single temperature for each source does introduce a potential bias in the masses. If 10 K was assumed, as for NGC 1333, then masses for NGC 2071 and NGC 2024 sources would be larger by a factor of 2.
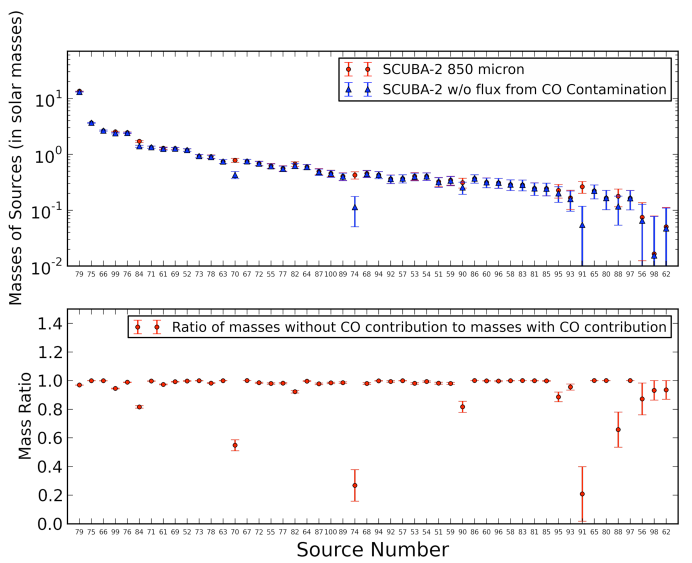
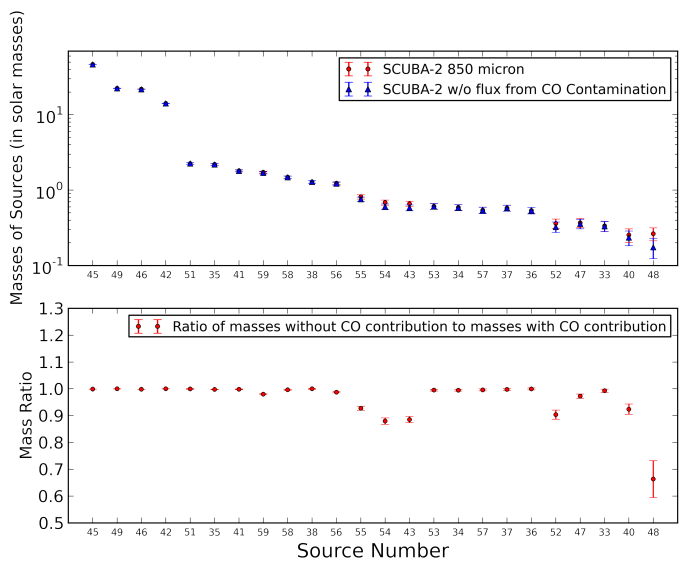
Masses were calculated from the source fluxes of the 850 continuum emission (see Section 4) with and without 12CO 3–2 contribution taken into account. The bottom portion of Figures 8 and 9 show the ratio between these masses for NGC 2071 and NGC 2024 respectively. Due to the CO flux contamination, the calculated source masses are being overestimated by a factor up to 4.8 for NGC 2071 and 1.5 for NGC 2024.
4.3 Molecular Outflow Analysis
The location of protostellar sources can help identify the potential causes of 12CO contamination. The presence of protostellar molecular outflows and hot ambient gas from nearby stars results in bright 12CO emission, making regions with these characteristics rife with CO contamination.
Sources with high 12CO contamination were examined in further detail using the HARP data cubes. In each of the three regions, sources with greater than 20 per cent contamination were defined as ‘sources with high contamination.’ For NGC 1333, there were no sources with greater than 20 per cent contamination, excluding it from this portion of the high contamination study. In NGC 2071, four sources fulfilled the high contamination criterion and one source in NGC 2024 fulfilled the criterion. In order to identify the cause of high contamination, the 12CO spectra were extracted and analysed for molecular outflows.
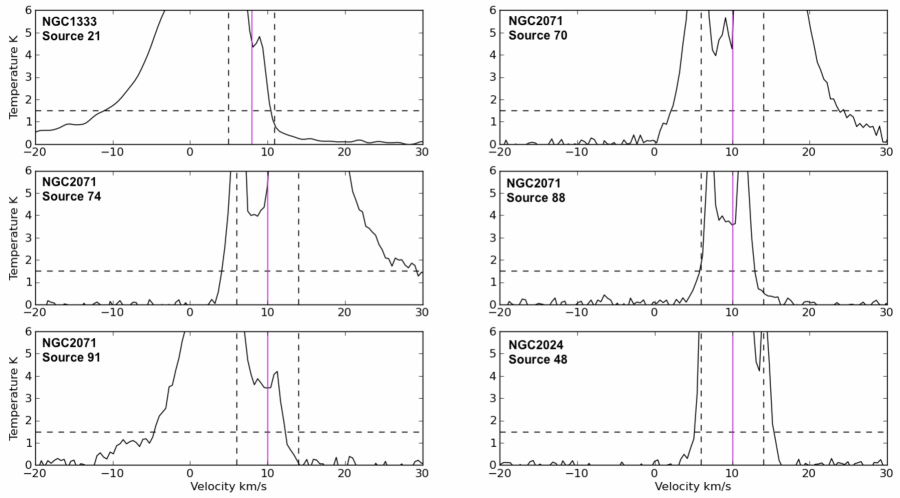
For NGC 2071 and NGC 2024, the linewing criterion used to identify a molecular outflow candidate was a linewing above 1.5 K () at 4 km s-1 from the core velocity, . This linewing criterion method follows the method in Hatchell et al. (2007). A core velocity of 10 km s-1 was used for all of the sources in NGC 2024 and NGC 2071 based on C18O 3–2 data (Buckle et al., 2010). Linewing criteria were based on RMS values for the regions ().
The linewing criterion identifies not only protostars driving molecular outflows, but also sources which are contaminated by outflows along the line of sight. Outflow candidates were identified using the above criteria and examined further to determine if the source or another protostar was the outflow driving source. Sources with high contamination that were not outflow candidates were further analysed to determine if there were other causes behind the 12CO contamination, such as a nearby star heating the gas.
Highly contaminated sources are listed in Table 2. Table 2 includes the region, source number, RA and Dec, flux calculated from aperture photometry in mJy, 12CO flux contamination in Grade 2 weather in mJy, percentage contamination from 12CO, core velocity in km s-1, and the final molecular outflow candidate result. The outflow naming convention follows Hatchell & Dunham (2009), where a ‘y’ is given when an outflow is present and ‘n’ is given when an outflow is not present. Sources are marked ‘?’ when there is confusion as to the source of the outflow. In this case, the potential source causing the outflow detection is listed in a footnote.
| Region | Source | RA | Dec | Flux111SCUBA-2 fluxes appear to be lower than seen by SCUBA due to the subtraction of large-scale flux by SCUBA-2. | 12CO (Grade 2) | Percentage Cont. | Outflow? | |
|---|---|---|---|---|---|---|---|---|
| (J2000) | (J2000) | mJy | mJy | (Grade 2) | km s-1 | |||
| NGC2071 | 70 | 05:46:57.6 | 00:20:09 | 495 40 | 224 6 | 46 5 | 10.0 | y |
| 74 | 05:47:01.0 | 00:20:42 | 268 40 | 196 6 | 73 13 | 10.0 | y | |
| 88 | 05:47:06.7 | 00:23:14 | 112 39 | 38 3 | 34 14 | 10.0 | y? 222Could be due to a large, central blue outflow from source at (J2000) 05:47:06.9, 00:22:39 (source 84; LBS-MM19) or a source at (J2000) 05:47:04.1, 00:21:58 (LBS-MM18; NGC2071-IRS), where LBS-MM18 was found to be responsible for driving the outflow in Motte et al. (2001) and both sources are confirmed Class 1 protostars detected using IRAC (Nutter & Ward-Thompson, 2007). | |
| 91 | 05:47:08.9 | 00:23:56 | 166 40 | 132 5 | 79 22 | 10.0 | y? | |
| NGC2024 | 48 | 05:41:19.9 | -01:54:16 | 168 33 | 56 3 | 34 9 | 10.0 | y |
4.3.1 Sources in NGC 1333
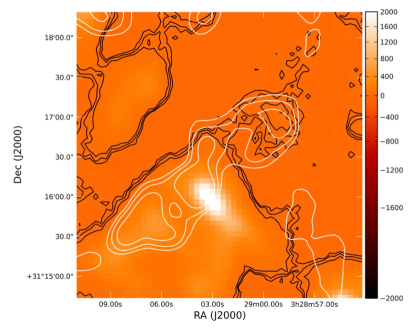
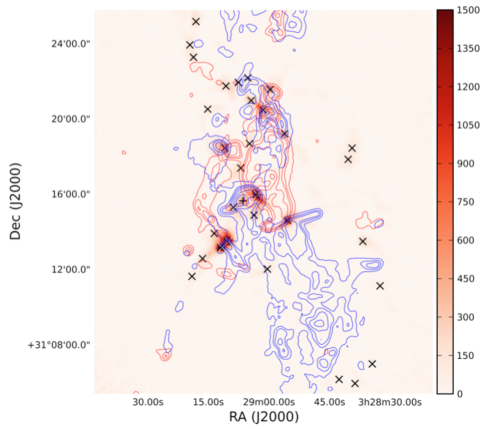
Figure 10 shows the 850 SCUBA-2 map with blue contours tracing the blueshifted 12CO HARP intensity (integrated from -2.5 to 4.5 km s-1) and red contours tracing the redshifted 12CO intensity (integrated from 10.5 to 16.5 km s-1). Sources in NGC 1333 are denoted by the percentage contamination, where ‘’ denotes sources with 0 to 10 per cent contamination and ‘’ denotes sources with 10 to 20 per cent contamination. Source 21 had the highest percentage contamination at 12 per cent. According to the linewing criteria used to identify a molecular outflow candidate (linewing above 1.5 K for at 3 km s-1 from the core velocity 7.9 km s-1, following the criterion for NGC 1333 used in Hatchell et al. 2007), source 21 is a molecular outflow candidate that could potentially be the result of a source at (J2000) 03:29:03.2, 31:15:59.0 (SVS13) or source at (J2000) 03:29:08.8, 31:15:18.1 (SK-16) (Hatchell & Dunham, 2009). A 12CO spectrum for this source is included in Figure 13.
4.3.2 Sources in NGC 2071
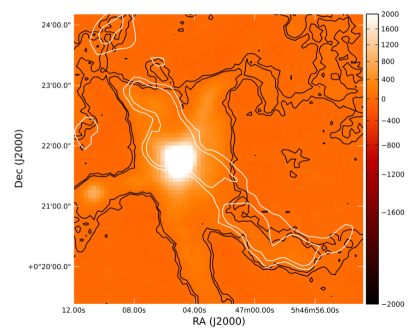
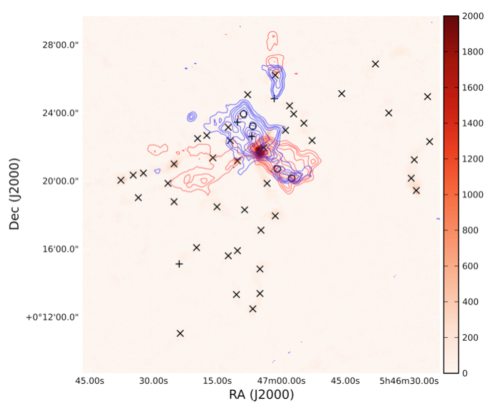
Figure 11 shows 850 SCUBA-2 map with blue contours tracing the blueshifted 12CO HARP intensity (integrated from -2.0 to 6.0 km s-1) and red contours tracing the redshifted 12CO intensity (integrated from 14.0 to 22.0 km s-1). Sources in NGC 2071 are denoted by the percentage contamination, where ‘’ denotes sources with 0 to 10 per cent contamination, ‘’ denotes sources with 10 to 20 per cent contamination, and ‘’ denotes sources with greater than 20 per cent contamination. According to the linewing criteria used, all four sources with high contamination are molecular outflow candidates. Even though sources 70 and 74 have clear blue- and redshifted spectral linewings, all four sources appear to trace a large central outflow that could be driven by a source at (J2000) 05:47:06.9, 00:22:39 (source 84; LBS-MM19) or a source at (J2000) 05:47:04.1, 00:21:58 (source 79; LBS-MM18; NGC2071-IRS), where LBS-MM18 was found to be responsible for driving the outflow in Motte et al. (2001) and both sources are confirmed Class 1 protostars detected using IRAC (Nutter & Ward-Thompson, 2007). Note that sources 84 (LBS-MM19) and 90, both with 18 per cent contamination, also correlate with the central outflow. The 12CO spectra for these sources are displayed in Figure 13.
4.3.3 Sources in NGC 2024
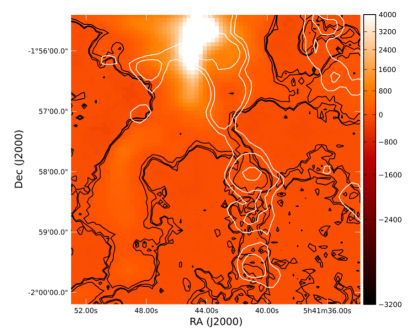
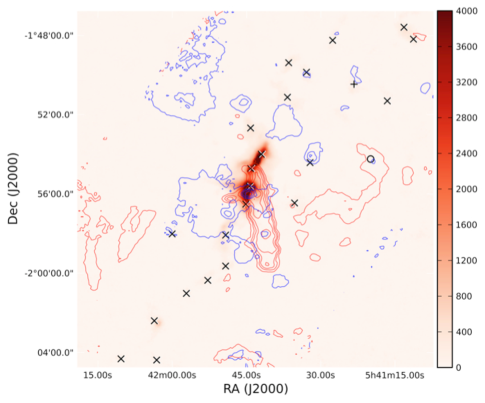
Figure 12 shows 850 SCUBA-2 map with blue contours tracing the blueshifted 12CO HARP intensity (integrated from -2.0 to 6.0 km s-1) and red contours tracing the redshifted 12CO intensity (integrated from 14.0 to 22.0 km s-1). Sources in NGC 2024 are denoted by the percentage contamination, where ‘’ denotes sources with 0 to 10 per cent contamination, ‘’ denotes sources with 10 to 20 per cent contamination, and ‘’ denotes sources with greater than 20 per cent contamination. According to the linewing criteria used, the single source with a high contamination is a molecular outflow candidate. The 12CO spectrum for this source is listed in Figure 13.
5 Discussion
Typical 12CO contamination levels in the observed SCUBA-2 850 emission from NGC 1333, NGC 2071, and NGC 2024 are under 20 per cent (this includes 95 per cent of sources, and 88 per cent of all sources have under 10 per cent contamination). Similar results were found for SCUBA, where Johnstone et al. (2003) suggested that 12CO line contamination is typically under 10 per cent for submillimetre sources in Orion and Davis et al. (2000) suggested contamination was 10 per cent near the source V380 Orion NE.
In locations where molecular outflows are present, 12CO contamination can rise above 20 per cent and dominate the dust continuum (up to 79 per cent contamination), corresponding to a CO contribution ranging from 16 to 68 mJy beam-1 for the sources analysed in this study. Peak 12CO fluxes found in the molecular outflows of NGC 1333, NGC 2071, and NGC 2024 maps reach even higher fluxes of 84 mJy beam-1, 154 mJy beam-1, and 94 mJy beam-1 respectively. Our study suggests that molecular outflows can influence line contamination in sources with both high and low continuum fluxes ( 100 to 500 mJy). This result agrees with that of Johnstone et al. (2003), where they concluded that the areas with warmer molecular gas temperatures and higher velocities (i.e. shocks and molecular outflows) were the only locations where 12CO emission dominated the dust continuum flux due to the higher molecular line integrated intensities associated with such regions. In addition, Gueth et al. (2003) found a 20 per cent contamination for the well-known outflow source L1157. Hatchell & Dunham (2009) similarly found a 20 to 30 per cent 12CO contamination level in the IRAS 03282+3035 outflow in Perseus.
The 12CO contamination combined with contamination from other molecular lines allows outflows to potentially be seen in continuum maps with a similar appearance as protostellar cores or filamentary structure, which may be the case for SVS13 in NGC 1333 and the large, central outflows in NGC 2071 and NGC 2024 that have strong evidence of molecular outflow lobes detected in the dust continuum emission maps (see Figure 3). Other studies have suggested that regions involving molecular outflows can reach 50 per cent 12CO contamination, e.g. in the extended outflow lobes of V380 Orion NE (Davis et al., 2000), and even up to 100 per cent contamination, e.g. the central blue outflow region in NGC 2071 driven by source LBS-MM18 (NGC2071-IRS; Motte et al. 2001).
The FCF uncertainty from calibrator observations for the 850 S2SRO maps is 18 per cent (SMURF SCUBA-2 Data Reduction Cookbook)555http://star-www.rl.ac.uk/star/docs/sc19.htx/node40.html. The calibration uncertainty of HARP observations at JCMT is estimated to be 20 per cent by Buckle et al. (2009). With contamination levels to SCUBA-2 850 less than or equal to 20 per cent for the majority of the sources, the typical contamination is less than or equivalent to the calibration uncertainty. Problems arise when the contamination is greater than than calibration uncertainties, contributing a significant portion of flux and potentially dominating the dust continuum. For bright sources, it should be possible to use the subtracted 12CO background to estimate the column density and hence the potential CO contamination to the 850 SCUBA-2 dust emission, as suggested by Tothill et al. (2002).
For faint sources, the insensitivity of SCUBA-2 to the large-scale dust emission introduces additional uncertainties. The spatially filtered maps created here do not appear to entirely subtract the total large-scale flux detected by HARP. Excess 12CO flux seen as positive flux in residuals (Section 4.1.4) point to the need for a more detailed model of SCUBA-2 structure response. The large-scale reconstruction issues limit analysing contamination where the SCUBA-2 flux is faint. This analysis is something we will consider for the full SCUBA-2 array, but not for the limited S2SRO data. If the SCUBA-2 and HARP maps were subtracted in order to account for the molecular line contamination, there is a possibility that an overcompensation for the molecular line flux would occur, creating regions of negative flux in the dust continuum map.
An additional uncertainty in the contamination due to large-scale CO emission is the inclusion of the secondary beam in the calculation of the telescope beam area in Equation 2, which increases the beam area by a factor of 1.2 at 850 (determined from a new FWHM calculated in Section 2.2). Large-scale emission couples to the telescope beam as the efficiency factor instead of (as in Equation 11). Therefore, the conversion factor for 12CO 3–2 would increase by a factor of 1.1, which is insignificant compared to other uncertainties. The scales of large-scale emission that could cause significant signal without being taken out by the S2SRO common-mode subtraction range from (the FWHM of the 850 beam) to (the Gaussian FWHM used in the GSM masking process). For the full SCUBA-2 array, CO emission on scales up to 8′ in size could contribute.
CO is not the only possible contributor in the 850 and 450 bands. Studies of other molecular lines found SCUBA 850 line contamination from HCN, HNC, CN and methanol add together to form roughly 40 per cent of the total line contamination when observing other more energetic sources, like the shocked region SK1-OMC3 (Johnstone et al., 2003) . Similar contamination was found in the Kleinmann-Low nebula, from SO and SO2 emission that was 28 to 50 per cent of the total line contamination at 850 (Serabyn & Weisstein, 1995; Groesbeck et al., 1994). Other studies have found the total line contamination by other molecular lines to be a factor of 2 to 3 times that from CO in outflows (Tothill et al., 2002; Gueth et al., 2003). Since molecular line contamination from other molecules is also likely, some features with low flux in the dust continuum may entirely be the result of line emission.
5.1 12CO 6–5 Contamination
For the 450 band, we have no 12CO 6–5 maps with which to estimate the CO contamination directly. Using the line intensities from the 12CO 3–2 HARP maps, we can instead predict the potential line contamination from 12CO 6–5 to the SCUBA-2 450 dust continuum signal.
Assuming local thermodynamic equilibrium, we can estimate the ratio of the main-beam brightness temperatures TMB for 12CO 6–5 and 12CO 3–2. We assume the excitation temperature, , is equal to the kinetic temperature of the region, and is therefore the same for both 12CO 3–2 and 12CO 6–5. We also assume the partition function and the Gaussian line shape , yielding the relation (in CGS units):
| (13) | |||||
where is Planck’s constant, is the permanent electric dipole moment of the molecule, is the lower rotational level of a linear molecule, and is the ground-state temperature () at 5.5 K. Using Equation 13, the ratio 12CO 6–5/12CO 3–2 is:
| (14) | |||||
where for and for .
Assuming the source dust temperatures of 10 K, as in Section 4.2, are equal to the excitation temperature in the protostellar envelope, it follows from Equation 14 the ratio 12CO 6–5/12CO 3–2 is 0.001 in the optically thin case. The ratio between the two lines is low due to the low temperature of the region, indicating there is less likelihood of detecting 12CO 6–5 in cooler regions of the cloud. The sources analysed in NGC 1333, NGC 2071, and NGC 2024 with high 12CO 3–2 contamination correspond to molecular clouds at temperatures of 20 to 25 K. At 25 K, the ratio of 12CO 6–5/12CO 3–2 is 0.147 in the optically thin case. However, outflows can contain even higher temperatures, ranging from 50 to 150 K (Hatchell et al., 1999; van Kempen et al., 2009). At 50 K, the ratio is 0.769, indicating 12CO 6–5 is much more likely to be detected from outflows. If, on the other hand, both lines are optically thick, then the ratio tends to 1 as is known to be the case for 12CO 3–2 (Buckle et al., 2010; Curtis et al., 2010).
Using the ratio 12CO 6–5/12CO 3–2, we can estimate typical peak fluxes for 12CO 6–5: an excitation temperature of 25 K and a source with a typical 12CO 3–2 integrated intensity of 100 K km s-1 will produce a corresponding 12CO 6–5 flux contribution of 8 mJy beam-1 for Grade 2 weather in the 450 SCUBA-2 map. With the SCUBA-2 450 sensitivity for the Gould Belt Survey (Ward-Thompson et al., 2007) at a RMS of 35 mJy beam-1 for Grade 2 weather, the 12CO 6–5 flux contribution would not be detected. Even in the case of optically thick emission where the ratio 12CO 6–5/12CO 3–2 is 1, the 12CO 6–5 is estimated to be 57 mJy beam-1, which is under the 5 detection limit.
Using published observations, 12CO 6–5 contamination can be studied in further detail. 12CO 6–5 data were taken for IRAS 2A, 4A, and 4B in NGC 1333 by Yıldız et al. (2010). These sources are particularly bright and possibly intermediate-mass protostars. 12CO 6–5 integrated intensities at the positions of the protostars were 57 K km s-1, 122 K km s-1, and 43 K km s-1 respectively. Using the 12CO 6–5 conversion factors calculated in this study for Grade 2 weather, the corresponding CO contamination to the SCUBA-2 450 dust continuum would be 32 mJy beam-1 (IRAS 2A), 70 mJy beam-1 (IRAS 4A), and 25 mJy beam-1 (IRAS 4B) for the CO contamination to the SCUBA-2 450 dust continuum. Peak fluxes from SCUBA were 2355 mJy beam-1, 7000 mJy beam-1, and 3025 mJy beam-1 respectively (Hatchell et al., 2005). The SCUBA-2 450 dust emission peaks are a factor of several hundred times larger than the 12CO 6–5 contribution. For these bright protostars, the CO contamination is insignificant at 450 .
Dust continuum fluxes in the 450 SCUBA-2 band are estimated to be a factor of 6 to 12 higher than fluxes in the 850 band. In the Rayleigh-Jeans approximation, the dust optical depth increases as with between 1 and 2 and the corresponding flux density increases as to (Wilson, 2009). The increase in continuum flux at 450 clearly outweighs the expected contribution from 12CO 6–5. At most the 12CO 6–5 integrated main-beam emission is the same as the 12CO 3–2 emission assuming optically thick emission. This situation corresponds to a molecular line ratio of 1 and a contamination flux ratio of 0.84 (assuming Grade 2 weather). Since 450 continuum fluxes increase with respect to the 850 continuum, 450 continuum measurements would more likely be contaminated by strong molecular outflows instead of other means, i.e. nearby stars or ambient cloud emission. Nonetheless, potential contamination could occur in particularly low flux sources with nearby molecular outflows, such as the sources in NGC 2071 that were near to confirmed outflow candidates (see Section 4.3).
In the case of large-scale 12CO 6–5 emission, it is also necessary to include the secondary beam in the calculation of the 450 telescope beam (Equation 2). The total beam area for 450 increases by a factor of 2.0 (determined from an effective FWHM calculated in Section 2.2). Using Equation 11 with the the efficiency factor , the 12CO 6–5 conversion factor would increase by a factor of 1.7. The increase in the expected 450 dust continuum flux still exceeds any change in the 12CO line conversion factors. Therefore, our conclusion that there is little CO contamination in the 450 maps, as discussed above, still holds.
6 Conclusions
In this study, the 12CO line contamination factors for the 450 and 850 SCUBA-2 continuum bands were calculated under different atmospheric conditions (weather grades 1 to 5). These contamination factors were then applied to three different regions, NGC 1333, NGC 2071, and NGC 2024, in order to study the HARP 12CO 3–2 flux contribution to the SCUBA-2 850 measurements using a list of sources for each region. Sources with high 12CO contamination (greater than 20 per cent) were analysed in further detail to determine the cause of the contamination. The following can be concluded from this study:
-
1.
For the 850 SCUBA-2 filter profile, the 12CO 3–2 contamination factors increase as the sky opacity increases. The contamination factors (mJy beam-1 per K km s-1) of 12CO to the 850 dust emission are, by weather grade, (Grade 1) 0.63; (Grade 2) 0.68; (Grade 3) 0.70; (Grade 4) 0.74; (Grade 5) 0.77.
-
2.
For the 450 SCUBA-2 filter profile, the 12CO 6–5 contamination factors decrease as the sky opacity increases due to the atmosphere transmission steeply declining at higher opacity grades. The contribution factors (mJy beam-1 per K km s-1) of 12CO to the 450 dust emission are, by weather grade, (Grade 1) 0.64; (Grade 2) 0.57; (Grade 3) 0.51; (Grade 4) 0.41; (Grade 5) 0.35.
-
3.
The 12CO 3–2 contribution to the 850 SCUBA-2 dust continuum is typically under 20 per cent for all of the regions studied. However, in regions of molecular outflows, the 12CO can reach a flux contribution of 68 mJy beam-1 for the sources studied, dominating the dust continuum in sources with both high and low continuum flux densities (up to 500 mJy beam-1) with a contribution up to 79 per cent contamination. Peak 12CO fluxes in molecular outflows in the regions reached even higher levels, up to 154 mJy beam-1. There is strong evidence that 12CO 3–2 contamination, while mostly minimal, is a major potential source of confusion that can be observed directly in the 850 dust continuum maps resembling protostellar cores or filamentary structure (as may be the case in NGC 1333, NGC 2071, and NGC 2024).
-
4.
Even though we have no 12CO 6–5 molecular line maps to study in further detail, in hot (50 K) regions, e.g. molecular outflows, the ratio of main-beam temperature for 12CO 6–5/12CO 3–2 is 0.769. However, CO contamination to the 450 source fluxes is not expected to be as much of an issue because of the expectation for the 450 dust emission to be a factor of 6 to 12 times brighter than the 850 fluxes.
7 Acknowledgments
We would like to thank Antonio Chrysostomou and Simon Coudé for their helpful input for this paper. The JCMT is operated by the Joint Astronomy Centre (JAC) on behalf of the Science and Technology Facilities Council (STFC) of the United Kingdom, the National Research Council of Canada, and the Netherlands Organisation for Scientific Research. This work made use of SIMBAD that is operated at CDS, Strasbourg, France. We acknowledge the data analysis facilities provided by the Starlink Project which is run by CCLRC on behalf of PPARC. In addition, the following Starlink package AUTOPHOTOM has been used. This research made use of APLpy, an open-source plotting package for Python hosted at http://aplpy.github.com. ED acknowledges the support of a college studentship from the University of Exeter.
References
- Aguirre et al. (2011) Aguirre J. E., Ginsburg A. G., Dunham M. K., Drosback M. M., Bally J., Battersby C., Bradley E. T., Cyganowski C., Dowell D., Evans II N. J., Glenn J., Harvey P., Rosolowsky E., Stringfellow G. S., Walawender J., Williams J. P., 2011, ApJ, 192, 4
- André et al. (2003) André P., Bouwman J., Belloche A., Hennebelle P., 2003, in C. L. Curry & M. Fich ed., SFChem 2002: Chemistry as a Diagnostic of Star Formation Submillimeter Studies of Prestellar Cores and Protostars: Probing the Initial Conditions for Protostellar Collapse. pp 127–+
- Andre et al. (1996) Andre P., Ward-Thompson D., Motte F., 1996, A&A, 314, 625
- Brown et al. (1994) Brown A. G. A., de Geus E. J., de Zeeuw P. T., 1994, A&A, 289, 101
- Buckle et al. (2010) Buckle J. V., Curtis E. I., Roberts J. F., White G. J., Hatchell J., 2010, MNRAS, 401, 204
- Buckle et al. (2009) Buckle J. V., Hills R. E., Smith H., Dent W. R. F., Bell G., 2009, MNRAS, 399, 1026
- Curtis et al. (2010) Curtis E. I., Richer J. S., Swift J. J., Williams J. P., 2010, MNRAS, 408, 1516
- Davis et al. (2000) Davis C. J., Dent W. R. F., Matthews H. E., Coulson I. M., McCaughrean M. J., 2000, MNRAS, 318, 952
- Di Francesco et al. (2008) Di Francesco J., Johnstone D., Kirk H., MacKenzie T., Ledwosinska E., 2008, ApJS, 175, 277
- Enoch et al. (2006) Enoch M. L., Young K. E., Glenn J., Evans II N. J., Golwala S., Sargent A. I., Harvey P., Aguirre J., Goldin A., Haig D., Huard T. L., Lange A., Laurent G., Maloney P., Mauskopf P., Rossinot P., Sayers J., 2006, ApJ, 638, 293
- Evans et al. (2001) Evans II N. J., Rawlings J. M. C., Shirley Y. L., Mundy L. G., 2001, ApJ, 557, 193
- Gordon (1995) Gordon M. A., 1995, A&A, 301, 853
- Groesbeck et al. (1994) Groesbeck T. D., Phillips T. G., Blake G. A., 1994, ApJS, 94, 147
- Gueth et al. (2003) Gueth F., Bachiller R., Tafalla M., 2003, A&A, 401, L5
- Hatchell & Dunham (2009) Hatchell J., Dunham M. M., 2009, A&A, 502, 139
- Hatchell et al. (1999) Hatchell J., Fuller G. A., Ladd E. F., 1999, A&A, 344, 687
- Hatchell et al. (2007) Hatchell J., Fuller G. A., Richer J. S., 2007, A&A, 472, 187
- Hatchell et al. (2007) Hatchell J., Fuller G. A., Richer J. S., Harries T. J., Ladd E. F., 2007, A&A, 468, 1009
- Hatchell et al. (2005) Hatchell J., Richer J. S., Fuller G. A., Qualtrough C. J., Ladd E. F., Chandler C. J., 2005, A&A, 440, 151
- Hildebrand (1983) Hildebrand R. H., 1983, QJRAS, 24, 267
- Holland et al. (2002) Holland W., Duncan W., Griffin M., 2002, in S. Stanimirovic, D. Altschuler, P. Goldsmith, & C. Salter ed., Single-Dish Radio Astronomy: Techniques and Applications Vol. 278 of Astronomical Society of the Pacific Conference Series, Bolometers for Submillimeter and Millimeter Astronomy. pp 463–491
- Johnstone & Bally (1999) Johnstone D., Bally J., 1999, ApJL, 510, L49
- Johnstone & Bally (2006) Johnstone D., Bally J., 2006, ApJ, 653, 383
- Johnstone et al. (2003) Johnstone D., Boonman A. M. S., van Dishoeck E. F., 2003, A&A, 412, 157
- Johnstone et al. (2000) Johnstone D., Wilson C. D., Moriarty-Schieven G., Joncas G., Smith G., Gregersen E., Fich M., 2000, ApJ, 545, 327
- Kirk et al. (2006) Kirk H., Johnstone D., Di Francesco J., 2006, ApJ, 646, 1009
- Lada et al. (1996) Lada C. J., Alves J., Lada E. A., 1996, AJ, 111, 1964
- Launhardt et al. (1996) Launhardt R., Mezger P. G., Haslam C. G. T., Kreysa E., Lemke R., Sievers A., Zylka R., 1996, A&A, 312, 569
- Mitchell et al. (2001) Mitchell G. F., Johnstone D., Moriarty-Schieven G., Fich M., Tothill N. F. H., 2001, ApJ, 556, 215
- Motte et al. (2001) Motte F., André P., Ward-Thompson D., Bontemps S., 2001, A&A, 372, L41
- Nutter & Ward-Thompson (2007) Nutter D., Ward-Thompson D., 2007, MNRAS, 374, 1413
- Ossenkopf & Henning (1994) Ossenkopf V., Henning T., 1994, A&A, 291, 943
- Papadopoulos & Allen (2000) Papadopoulos P. P., Allen M. L., 2000, ApJ, 537, 631
- Reid & Wilson (2005) Reid M. A., Wilson C. D., 2005, ApJ, 625, 891
- Richer et al. (1989) Richer J. S., Hills R. E., Padman R., Russell A. P. G., 1989, MNRAS, 241, 231
- Seaquist et al. (2004) Seaquist E., Yao L., Dunne L., Cameron H., 2004, MNRAS, 349, 1428
- Serabyn & Weisstein (1995) Serabyn E., Weisstein E. W., 1995, ApJ, 451, 238
- Shirley et al. (2002) Shirley Y. L., Evans II N. J., Rawlings J. M. C., 2002, ApJ, 575, 337
- Tothill et al. (2002) Tothill N. F. H., White G. J., Matthews H. E., McCutcheon W. H., McCaughrean M. J., Kenworthy M. A., 2002, ApJ, 580, 285
- van Kempen et al. (2009) van Kempen T. A., van Dishoeck E. F., Güsten R., Kristensen L. E., Schilke P., Hogerheijde M. R., Boland W., Menten K. M., Wyrowski F., 2009, A&A, 507, 1425
- Ward-Thompson et al. (2007) Ward-Thompson D., Di Francesco J., Hatchell J., Hogerheijde M. R., Nutter D., Bastien P., Basu S., Bonnell I., Bowey J., Brunt C., 2007, PASP, 119, 855
- Ward-Thompson et al. (1999) Ward-Thompson D., Motte F., Andre P., 1999, MNRAS, 305, 143
- Wilking et al. (2004) Wilking B. A., Meyer M. R., Greene T. P., Mikhail A., Carlson G., 2004, AJ, 127, 1131
- Wilson (2009) Wilson T. L., 2009, ArXiv e-prints
- Yıldız et al. (2010) Yıldız U. A., van Dishoeck E. F., Kristensen L. E., Visser R., Jørgensen J. K., Herczeg G. J., van Kempen T. A., Hogerheijde M. R., Doty S. D., 2010, A&A, 521, L40+
- Young et al. (2003) Young C. H., Shirley Y. L., Evans II N. J., Rawlings J. M. C., 2003, ApJS, 145, 111
- Zhu et al. (2003) Zhu M., Seaquist E. R., Kuno N., 2003, ApJ, 588, 243
| Region | Source | RA | Dec | Other Source ID |
|---|---|---|---|---|
| (J2000) | (J2000) | |||
| NGC 1333 | 1 | 03:29:10.4 | 31:13:30 | HRF41 |
| 2 | 03:29:12.0 | 31:13:10 | HRF42 | |
| 3 | 03:29:03.2 | 31:15:59 | HRF43 | |
| 6 | 03:28:55.3 | 31:14:36 | HRF44 | |
| 13 | 03:29:01.4 | 31:20:29 | HRF45 | |
| 14 | 03:29:11.0 | 31:18:27 | HRF46 | |
| 17 | 03:28:59.7 | 31:21:34 | HRF47 | |
| 18 | 03:29:13.6 | 31:13:55 | HRF48 | |
| 20 | 03:28:36.7 | 31:13:30 | HRF49 | |
| 21 | 03:29:06.5 | 31:15:39 | HRF50 | |
| 22 | 03:29:08.8 | 31:15:18 | HRF51 | |
| 24 | 03:29:03.7 | 31:14:53 | HRF52 | |
| 26 | 03:29:04.5 | 31:20:59 | HRF53 | |
| 29 | 03:29:10.7 | 31:21:45 | HRF54 | |
| 30 | 03:28:40.4 | 31:17:51 | HRF55 | |
| 32 | 03:29:07.7 | 31:21:57 | HRF56 | |
| 33 | 03:29:18.2 | 31:25:11 | HRF57 | |
| 35 | 03:29:16.5 | 31:12:35 | HRF59 | |
| 38 | 03:28:39.4 | 31:18:27 | HRF60 | |
| 39 | 03:29:17.3 | 31:27:50 | HRF61 | |
| 42 | 03:29:07.1 | 31:17:24 | HRF62 | |
| 43 | 03:29:18.8 | 31:23:17 | HRF63 | |
| 46 | 03:29:25.5 | 31:28:18 | HRF64 | |
| 47 | 03:29:00.4 | 31:12:02 | HRF65 | |
| 53 | 03:29:05.3 | 31:22:11 | HRF66 | |
| 55 | 03:29:19.7 | 31:23:56 | HRF67 | |
| 62 | 03:28:56.2 | 31:19:13 | HRF68 | |
| 63 | 03:28:34.4 | 31:06:59 | HRF69 | |
| 66 | 03:29:15.3 | 31:20:31 | HRF70 | |
| 73 | 03:28:38.7 | 31:05:57 | HRF71 | |
| 77 | 03:29:19.1 | 31:11:38 | HRF72 | |
| 81 | 03:28:32.5 | 31:11:08 | HRF74 | |
| 83 | 03:28:42.6 | 31:06:10 | HRF75 | |
| 89 | 03:29:04.9 | 31:18:41 | Bolo44 | |
| 94 | 03:28:32.7 | 31:04:56 | Bolo26 | |
| NGC 2071 | 51 | 05:47:23.7 | 00:11:02 | BN-547237+01102 |
| 52 | 05:47:06.8 | 00:12:30 | BN-547068+01230 | |
| 53 | 05:47:10.6 | 00:13:18 | BN-547106+01318 | |
| 54 | 05:47:05.1 | 00:13:21 | BN-547051+01321 | |
| 55 | 05:47:05.0 | 00:14:49 | BN-547050+01449 | |
| 56 | 05:47:23.9 | 00:15:07 | BN-547239+01507 | |
| 57 | 05:47:12.4 | 00:15:37 | BN-547124+01537 | |
| 58 | 05:47:10.4 | 00:15:53 | BN-547104+01553 | |
| 59 | 05:47:19.9 | 00:16:03 | BN-547199+01603 | |
| 60 | 05:47:04.8 | 00:17:07 | BN-547048+01707 | |
| 61 | 05:47:01.5 | 00:17:55 | BN-547015+01755 | |
| 62 | 05:47:08.7 | 00:18:17 | BN-547087+01817 | |
| 63 | 05:47:15.2 | 00:18:30 | BN-547152+01830 | |
| 64 | 05:47:25.3 | 00:18:48 | BN-547253+01848 | |
| 65 | 05:47:33.6 | 00:19:02 | BN-547336+01902 | |
| 66 | 05:46:28.3 | 00:19:28 | BN-546283+01928 | |
| 67 | 05:47:03.4 | 00:19:50 | BN-547034+01950 | |
| 68 | 05:47:26.7 | 00:19:53 | BN-547267+01953 | |
| 69 | 05:47:37.7 | 00:20:01 | BN-547377+02001 | |
| 70 | 05:46:57.6 | 00:20:09 | BN-546576+02009 | |
| 71 | 05:46:29.4 | 00:20:10 | BN-546294+02010 | |
| 72 | 05:47:34.9 | 00:20:20 | BN-547349+02020 | |
| 73 | 05:47:32.5 | 00:20:26 | BN-547325+02026 | |
| 74 | 05:47:01.0 | 00:20:42 | BN-547010+02042 | |
| 75 | 05:47:25.2 | 00:20:59 | BN-547252+02059 | |
| 76 | 05:47:10.3 | 00:21:12 | BN-547103+02112 | |
| 77 | 05:46:28.7 | 00:21:14 | BN-546287+02114 | |
| 78 | 05:47:16.0 | 00:21:23 | BN-547160+02123 | |
| 79 | 05:47:04.1 | 00:21:58 | BN-547041+02158 | |
| 80 | 05:46:25.3 | 00:22:20 | BN-546253+02220 | |
| 81 | 05:46:52.8 | 00:22:23 | BN-546528+02223 | |
| 82 | 05:47:11.9 | 00:22:23 | BN-547119+02223 | |
| 83 | 05:47:19.7 | 00:22:31 | BN-547197+02231 | |
| 84 | 05:47:06.9 | 00:22:39 | BN-547069+02239 | |
| 85 | 05:47:17.5 | 00:22:40 | BN-547175+02240 | |
| 86 | 05:46:59.1 | 00:22:59 | BN-546591+02259 | |
| 87 | 05:47:12.4 | 00:23:11 | BN-547124+02311 | |
| 88 | 05:47:06.7 | 00:23:14 | BN-547067+02314 | |
| 89 | 05:46:54.7 | 00:23:24 | BN-546547+02324 | |
| 90 | 05:47:10.4 | 00:23:27 | BN-547104+02327 | |
| 91 | 05:47:08.9 | 00:23:56 | BN-547089+02356 | |
| 92 | 05:46:57.2 | 00:23:56 | BN-546572+02356 | |
| 93 | 05:46:34.7 | 00:23:59 | BN-546347+02359 | |
| 94 | 05:46:58.0 | 00:24:26 | BN-546580+02426 | |
| 95 | 05:47:01.7 | 00:24:52 | BN-547017+02452 | |
| 96 | 05:46:25.7 | 00:24:56 | BN-546257+02456 | |
| 97 | 05:47:08.0 | 00:25:05 | BN-547080+02505 | |
| 98 | 05:46:45.9 | 00:25:07 | BN-546459+02507 | |
| 99 | 05:47:01.4 | 00:26:14 | BN-547014+02614 | |
| 100 | 05:46:38.0 | 00:26:53 | BN-546380+02653 | |
| NGC 2024 | 33 | 05 42 03.0 | -02 04 23 | BS-542030-20423 |
| 34 | 05 42 10.3 | -02 04 20 | BS-542103-20420 | |
| 35 | 05 42 03.5 | -02 02 24 | BS-542035-20224 | |
| 36 | 05 41 57.1 | -02 01 00 | BS-541571-20100 | |
| 37 | 05 41 52.9 | -02 00 21 | BS-541529-20021 | |
| 38 | 05 41 49.3 | -01 59 38 | BS-541493-15938 | |
| 40 | 05 42 00.0 | -01 58 01 | BS-542000-15801 | |
| 41 | 05 41 49.1 | -01 58 03 | BS-541491-15803 | |
| 42 | 05 41 45.2 | -01 56 31 | BS-541452-15631 | |
| 43 | 05 41 35.4 | -01 56 29 | BS-541354-15629 | |
| 45 | 05 41 44.5 | -01 55 39 | BS-541445-15539 | |
| 46 | 05 41 44.2 | -01 54 43 | BS-541442-15443 | |
| 47 | 05 41 32.1 | -01 54 26 | BS-541321-15426 | |
| 48 | 05 41 19.9 | -01 54 16 | BS-541199-15416 | |
| 49 | 05 41 42.0 | -01 53 59 | BS-541420-15359 | |
| 51 | 05 41 44.2 | -01 52 41 | BS-541442-15241 | |
| 52 | 05 41 16.6 | -01 51 19 | BS-541166-15119 | |
| 53 | 05 41 36.7 | -01 51 06 | BS-541367-15106 | |
| 54 | 05 41 23.4 | -01 50 27 | BS-541234-15027 | |
| 55 | 05 41 32.9 | -01 49 53 | BS-541329-14953 | |
| 56 | 05 41 36.4 | -01 49 24 | BS-541364-14924 | |
| 57 | 05 41 27.6 | -01 48 13 | BS-541276-14813 | |
| 58 | 05 41 11.3 | -01 48 12 | BS-541113-14812 | |
| 59 | 05 41 13.3 | -01 47 35 | BS-541133-14735 |
Appendix A Molecular Outflow Spectra Criteria
The full version of this Appendix is available as Supporting Information to the online version of this article.