Appendix
1 Monte Carlo Simulation of the Patterns of Selection and Diversity
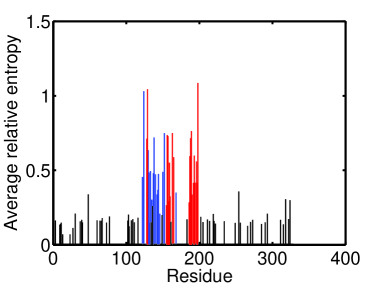
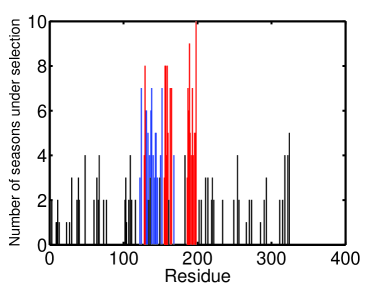
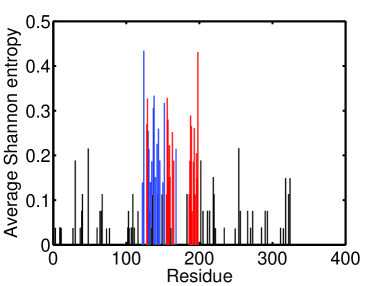
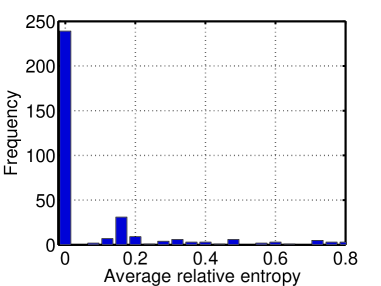
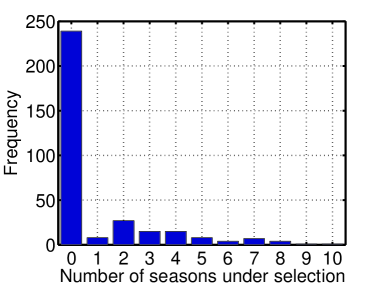
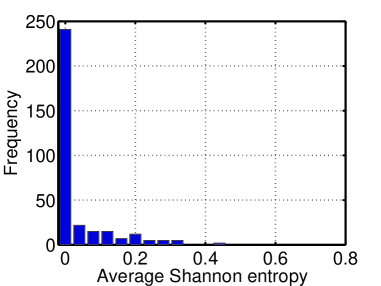
We introduce a Monte Carlo model aiming to regenerate the patterns of selection and diversity shown in Figure 4 in the main text. In this model, the sequence of the HA1 domain contains a dominant epitope bound by the antibody and possessing a high evolutionary rate , with the other amino acid positions with a low evolutionary rate (Ferguson et al. 2003). In each season, the numbers of positions in and out of the dominant epitope were defined as and , respectively. An ensemble of 1000 HA1 sequences was created with identical amino acid identity in each of the 329 positions, and was simulated from the 1969–1970 season to the 2009–2010 season. The historical dominant epitopes of H3 hemagglutinin were epitopes A and B, each of which was dominant for about seven seasons (Gupta et al. 2006). Therefore, the dominant epitope in the model was initialized as epitope A, and shifted between epitopes A and B every seven seasons. In each season, the numbers of amino acid substitutions in and out of the dominant epitope were randomly determined from two Poisson distributions with mean values and , respectively. The positions of amino acid substitutions and the new amino acid identities were then randomly assigned. This process was repeated for all the 1000 sequences in each season. Following this procedure, we calculated for each position the average relative entropy , the number of seasons under selection , and the average diversity , using the simulated sequences between the 1993–1994 season and the 2009–2010 season. We also present the histograms of , , and . The results of these calculations are shown in Figure S1.
The general picture depicted by this Monte Carlo simulation model reflects natural influenza evolution. The similarity between the results from the historical sequences in Figure 4 and those from the Monte Carlo simulation model in Figure S1 suggests that the Monte Carlo simulation model captures a major part of the picture of influenza evolution. The Monte Carlo simulation model also suggests that the binding of antibody and the increased substitution rate in the dominant epitope are the significant features of influenza evolution.
The annual evolution in the dominant epitope bound by the antibody decreases the affinity between virus and antibody and enables the virus to escape the immune memory of the virus circulating in the previous seasons. The evolutionary rate in the dominant epitope is (Ferguson et al. 2003). Both the historical sequences of the HA1 domain (Shih et al. 2007) and the Monte Carlo simulation model suggest that substitutions of amino acid identities have occurred randomly across the dominant epitope. The relative frequency of each amino acid in each position in each season shows that the amino acid substitutions were in random positions in each season and displayed few visible correlation between two positions (Shih et al. 2007). The Monte Carlo simulation model randomly selects the positions in which the amino acid is mutated, and generates similar patterns of selection and diversity to the historical data.
References
- Ferguson et al. (2003) Ferguson, N. M., Galvani, A. P. & Bush, R. M. 2003 Ecological and immunological determinants of influenza evolution. Nature, 422, 428–433. (doi:10.1038/nature01509)
- Gupta et al. (2006) Gupta, V., Earl, D. J. & Deem, M. W. 2006 Quantifying influenza vaccine efficacy and antigenic distance. Vaccine, 24, 3881–3888. (doi:10.1016/j.vaccine.2006.01.010)
- Shih et al. (2007) Shih, A. C., Hsiao, T. C., Ho, M. S. & Li, W. H. 2007 Simultaneous amino acid substitutions at antigenic sites drive influenza A hemagglutinin evolution. Proc. Natl. Acad. Sci. USA, 104, 6283–6288. (doi:10.1073/pnas.0701396104)