A multi-scale model for correlation in B cell VDJ usage of zebrafish
Abstract
The zebrafish (Danio rerio) is one of the model animals for study of immunology because the dynamics in the adaptive immune system of zebrafish are similar to that in higher animals. In this work, we built a multi-scale model to simulate the dynamics of B cells in the primary and secondary immune responses of zebrafish. We use this model to explain the reported correlation between VDJ usage of B cell repertoires in individual zebrafish. We use a delay ordinary differential equation (ODE) system to model the immune responses in the 6-month lifespan of a zebrafish. This mean field theory gives the number of high affinity B cells as a function of time during an infection. The sequences of those B cells are then taken from a distribution calculated by a “microscopic” random energy model. This generalized model shows that mature B cells specific to one antigen largely possess a single VDJ recombination. The model allows first-principles calculation of the probability, , that two zebrafish responding to the same antigen will select the same VDJ recombination. This probability increases with the B cell population size and the B cell selection intensity. The probability decreases with the B cell hypermutation rate. The multi-scale model predicts correlations in the immune system of the zebrafish that are highly similar to that from experiment.
pacs:
87.23.Kg, 87.10.Ed1 Introduction
B cell-mediated adaptive immunity exists in jawed animals [1]. B cells protect hosts by secreting antibodies that recognize and neutralize pathogens and foreign substances. Immunity generated by B cells is hence indispensable to the hosts’ survival. The primary immune response occurs when a novel type of antigen is detected by the immune system. The antigen is processed and presented to naïve B cells, which mature in the germinal center. In the maturation process, the B cells acquire the capability to recognize and neutralize a specific antigen. First, a naïve B cell recombines one V gene segment, one D gene segment, and one J gene segment in the genome to create the nucleotide sequence encoding the antibody. Second, this nucleotide sequence undergoes multiple rounds of somatic hypermutation, and B cells with high affinity to the antigen are selected. The selected mature B cells differentiate into the antibody-secreting plasma cells or long-lived memory B cells that activate the secondary immune response against the same antigen in the future. We will use the generalized model, discussed in more detail below, to describe this maturation process. Janeway et al. provide a more detailed review of the B cell-mediated immune reaction [2]. Understanding the dynamics of and relationship between VDJ recombination and somatic hypermutation informs one about the central mechanism of B cell immunity.
Recent experimental studies provide information on the B cell maturation process in zebrafish. Zebrafish (Danio rerio) have been increasingly used as a model animal to study the immune system because experiments on zebrafish are easy to perform, zebrafish reproduce quickly, and zebrafish possess one of the most primitive adaptive immune systems, which is a model for the adaptive immune systems in humans and mice [3, 4, 5]. The genome of zebrafish contains 39 V gene segments, five D gene segments, and five J gene segments, which together encode the V region of immunoglobulin IgM heavy chain in zebrafish [6, 7]. High-throughput sequencing of the complete IgM repertoires in 14 six-month-old zebrafish revealed that one fish carries up to 5000–6000 distinct nucleotide sequence of IgM with VDJ recombinations [8]. VDJ usage, the probability that each of the 975 possible VDJ recombinations is used in the IgM repertoire, has a correlation coefficient between individual zebrafish up to [8].
We seek to explain these experimental data from reasonably first principles. We use delay ordinary differential equations (ODEs) to describe the immune response of a zebrafish as it encounters antigens over its lifetime. The mean field number of B cells predicted by the ODE model are then assigned sequences based upon the results of the more “microscopic” generalized (GNK) model. The generalized model is used to analyze correlations in different zebrafish exposed to similar antigens. The model describes the dynamics and the localization of the VDJ recombination in primary and secondary immune responses. The immune response in a single fish usually localizes upon a single VDJ recombinant, with some hypermutational diversity in sequences that are progeny of the VDJ recombination. We use the model presented here to calculate the probability, , that two fish localized on the same VDJ recombination.
For our calculations, we use the GNK model as it has been derived in the literature. The original model was constructed to describe evolution of short peptide fragments in phage display experiments [9, 10]. The GNK model was introduced to model protein evolution experiments [11]. In particular, it accounts for the formation of and interaction between secondary structures of a protein and for the presence of an active or binding site in the protein. The GNK model was used to validate the performance of a new, hierarchical protocol for protein molecular evolution. We will be using the GNK model without change of parameter values, and so calculations in the present work are predictions. The GNK model was used to compute the expected efficacy of B cell vaccines, as a function of the difference between the vaccine and infecting virus [12]. The GNK model was generalized to T cell immunity and parametrized on altered peptide ligand experiments [13]. Averages and correlations in the immune response were predicted. The GNK model was used to look at autoimmune disease [14]. The GNK model was applied to T cell immunodominance data, and the predictions were within the error bars of human clinical trial data [15]. The GNK model was used to predict influenza H3N2 vaccine efficacy, and the predictions were within 10% of human efficacy data [16]. The GNK model was used to examine the T cell response to cancer [17]. A mechanism was put forward to explain immunodominance in cancer vaccine studies, and a quantitative comparison of GNK model predictions to specific lysis data was made. The GNK model was further used to predict tumor escape and immune elimination probabilities as a function of expressed epitopes and vaccination strategy [18]. It was shown that allele loss is more significant than point mutation for tumor escape. The GNK model was used to predict the usefulness of reduced alphabets in protein evolution experiments [19]. The GNK model was used to predict immunity in an agent-based influenza epidemiology model, predicting epidemic progression in accordance with WHO data [20]. The theory was used to predict the impact of vaccination strategy, time of vaccination, and extent of vaccination on epidemic progression. Finally, a review of the GNK model, with a table of parameter values, can be found in [21] and [22]. A discussion of the theory behind the spin-glass approach to biological evolution can be found in [23]. Mora et al. fit a random energy model, similar to the model, with a large number of parameters, approximately , to experimentally measured probabilities of D gene segment usage in zebrafish [24]. We here use the much smaller subset of parameters that have been determined in the GNK model.
The purpose of this study is to model the B cell-mediated immune response and to explain the correlations in the VDJ usage between pairs of zebrafish. The theory presented here is used to describe the mechanism of B cell-mediated immunity and to depict a snapshot of B cell repertoires at any time point in the host’s life span. The Materials and Methods section describes the ODE model as it is applied to multiple types of antigen and the generalized model as it is applied to a single type of antigen. The Results and Discussion section compares the predictions to experimental data. Finally, we present our conclusions and outlook.
2 Materials and methods
2.1 Motivation and description of the multi-scale model
We seek to explain Weinstein et al.’s data [8] from first principles. We develop a model to predict the B cell-mediated immune response in a zebrafish living in an environment with multiple types of antigen. We also predict the correlations in the immune response between a pair of such zebrafish. The immune response of zebrafish contains quantities covering many orders of magnitude. First, the zebrafish were raised for six months in the experiment [8]. On the other hand, the duration of a primary or secondary immune response is about 10 days [2]. The number of B cells in a zebrafish is on the order of [8], although only a small fraction of these B cells react to a given antigen [2].
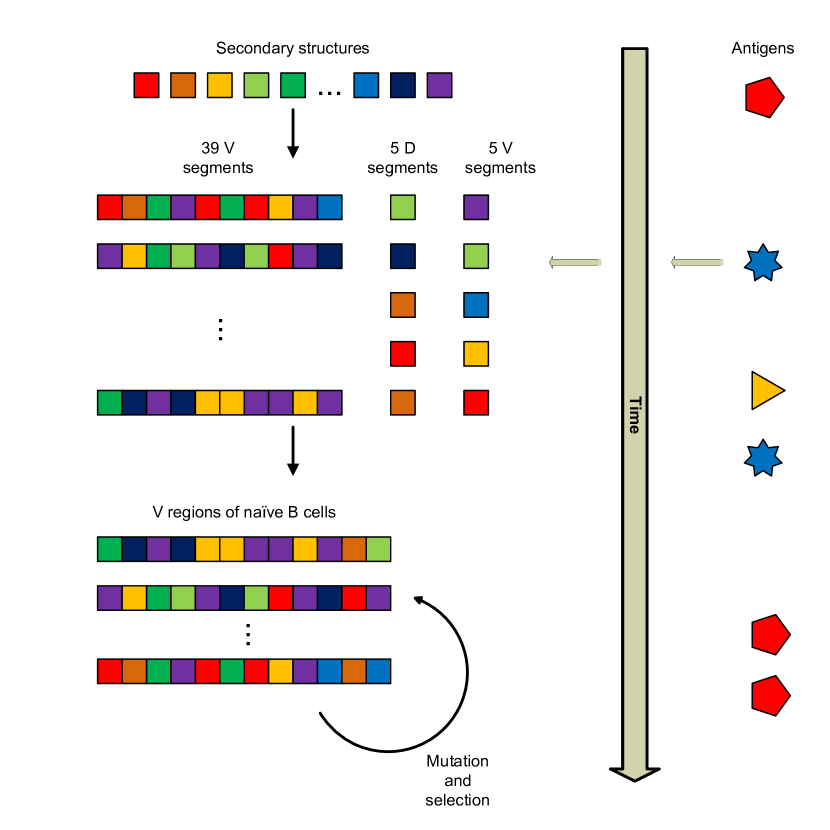
Due to this wide range of scales, we use multi-scale modeling to describe these data. The delay ODE system computes the dynamics of the number of mature B cells in the zebrafish during exposure to antigen. The delay ODE gives the average number of plasma cells, , and memory B cells, , specific to antigen as a function of time. Note that is identical in a pair zebrafish, and so is in this mean field theory. The generalized model computes the immune responses in a pair of zebrafish against an antigen. One result from the generalized model is that due to selection, the VDJ usage in one fish after the primary response is almost always localized to a single VDJ recombination. The generalized model computes the probability, , that this VDJ recombination is the same in a pair of fish. The output of the generalized model, , is used to assign the sequences of the B cells computed in the delay ODE model. We consider a pair of zebrafish, because we will compute pairwise correlations for comparison to the experimental data. We assign the same VDJ sequence to the pair with probability , otherwise we assign a different VDJ sequence to each fish. Table 1 provides the comparison between these two models. Figure 1 illustrates these two models.
2.2 ODE model
The delay ordinary differential equation (ODE) system computes the dynamics of the immune response triggered by antigens. The ODE system computes the average, mean-field number of B cells responding to antigen as a function of time. The number of mature B cells in a zebrafish can reach the order of magnitude of [8]. Zebrafish lived in an environment with types of antigens. For one zebrafish, inoculation of antigen triggers the immune response that boosts the number of relatively short-lived B cells and long-lived memory B cells in a zebrafish. The immune response of each zebrafish against antigen is modeled by two delay ODEs:
| (1) | |||||
| (2) |
in which state variables and are the numbers of antigen specific plasma cells, which secret antibodies, and memory B cells, respectively. The initial conditions at the time of hatching are , since hatchlings are assumed not to have seen antigen. The level of antigen received by the zebrafish, , is the result of a random process. Antigen inoculation is random, but the same when a pair of zebrafish is considered, since the environment is common for both zebrafish. We assume that distinct types of antigen exist in the environment. The zebrafish are in one of two states, the normal state in which the antigen is absent, and the infected state in which the antigen is present in the zebrafish. A newborn zebrafish is not inoculated by antigens and so it is in the normal state, . During antigen inoculation, both zebrafish receive one randomly selected type of antigen, denoted antigen . The average time span between antigen inoculations is days. The value of jumps from 0 to 100 at antigen inoculation, and the zebrafish transit from the normal state to the infected state. The antigen presentation lasts for approximate one week [25]. Therefore, the zebrafish transit from the infected state to the normal state, and falls back to zero after seven days if the host was not inoculated by antigen in the past seven days. The zebrafish stay in the infected state if it is reinnoculated with antigen during the seven days. The ODE system described above contains equations for a pair of zebrafish.
When the host receives antigen at time , a primary immune response is triggered if the host is naïve to this antigen (). Otherwise a secondary immune response is triggered. Antigen stimulates production of antigen specific plasma cells with rate and memory B cells with rate , according to Eqs. (1) and (2). In the primary immune response, B cells appear around days after the initial contact of antigen, and memory B cells appear around days after the contact [2]. In the secondary immune response, existing memory B cells mount an immediate reaction to the corresponding antigen with a rate , which is higher than the rate in the primary immune response because . The first order term in equation 1 quantifies the decay of antigen specific plasma cells with rate , because most B cells in germinal centers live a short time before apoptosis [2]. We set s , , and .
We solve the ODE system by numerical integration. The solution gives the composition of mature B cells in a zebrafish challenged by multiple types of antigen during its life history. The naïve repertoire plus the mature B cells at days represent the B cell repertoire of a 6-month-old zebrafish.
2.3 Generalized model
The generalized model defines the rugged random potential energy landscape, which defines the B cell fitness for the evolutionary process as it depends on the antibody variable region [11, 12, 26, 13, 27, 19]. The generalized model assigns a secondary structure and energy to each antibody variable region. Sequences undergo somatic hypermutation, and selection causes the lower energy sequences to be propagated [11]. The energy of an antibody variable region is expressed by
| (3) |
in which is the number of secondary structural subdomains, is the number of amino acids contributing to the antibody-antigen binding process. The energy is the sum of three components: secondary structural subdomain energies (), subdomain-subdomain interaction energies (), and chemical binding energies (). The parameters of the generalized model are fixed in our previous papers [11, 12, 21] and [22]. The secondary structural subdomain energy is expressed by
| (4) |
in which is the number of amino acids in a subdomain and each amino acid in the subdomain interact with other amino acids in the same subdomain. Here and . An antibody V region contains approximately 120 amino acids [2] or equivalently secondary structures. The identity of the subdomain is denoted by . There are types of subdomains, which are helices, strands, loops, turns, and others, Therefore . The identity of amino acid in position is represented by . The 20 amino acids are categorized into classes, which are negative, positive, polar, hydrophobic, and other. So . For each of types of subdomains, is a -dimensional quenched Gaussian array with zero mean and unit standard deviation.
The subdomain-subdomain interaction energy is expressed by
| (5) |
Between subdomains and subdomain (), interactions occurs. Each interaction involves interacting amino acids in subdomain and interacting amino acids in subdomain . For each pair of subdomains , is a -dimensional quenched Gaussian array with zero mean and unit standard deviation.
The chemical binding energy is expressed by
| (6) |
in which is the identity of one of the amino acids in the antibody variable region contributing to the binding to the antigen. The quantity is a quenched Gaussian with zero mean and unit standard deviation.
The generalized model is used to compute the VDJ distribution in a single fish and in a pair of zebrafish. We set the number of B cells responding to a particular antigen as because the number of B cells in a germinal center is in the order of magnitude of [28, 29]. These VDJ recombinants undergo evolution and selection [16]. The variable region contains approximately 120 amino acids in which 100, 10, and 10 amino acids are encoded by the V, D, and J gene segment, respectively. Thus the generalized model fixes the length of variable region to 120 amino acids and defines amino acid 1–100, 101–110, and 111–120 as encoded by the V, D, and J gene segment, respectively. By randomly selecting and recombining VDJ fragments [11], we created 39 V segments consisting of 10 secondary structures, five D segments consisting of one secondary structure, and five J segments consisting of one secondary structure. The initial structures are created by recombination from these V, D, and J segments. These sequences then undergo rounds of somatic hypermutation. The mutation rate in this process is roughly amino acid/structure/generation [2]; thus we set the number of mutated amino acid in each generation in each structure to follow a Poisson distribution with mean . Cutoff selection is used, with of the structures with the lowest energy propagated to the next generation [12]. The primary immune response lasts about 10 days, or equivalently 30 generations of B cells [25, 2]; thus we apply the generalized model for 30 rounds of somatic hypermutation and selection. A secondary immune response is another 30 rounds of somatic hypermutation. The distribution of VDJ usage in each zebrafish and in a pair of zebrafish is computed.
The general scheme of the model is shown in figure 1.
2.4 Model usage
The ODE system models the number of antigen specific B cells in each zebrafish in a mean-field approach. The duration of primary and secondary immune responses, which are explicitly modeled by the number of iterations in the generalized model, are respectively treated with the duration and in the ODE system. The distribution of VDJ usage in the generalized model is used to assign sequences to each of these B cells.
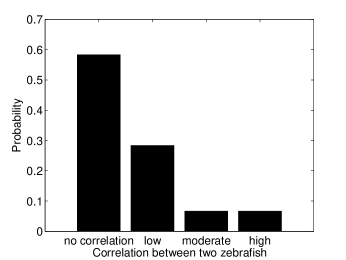
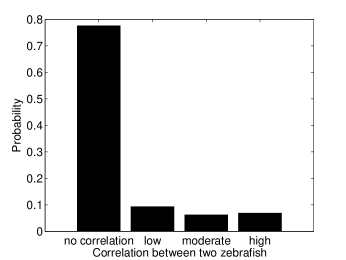
The predictions for correlations in VDJ usage between a pair of fish from this model of the immune response were compared to experiment [8].The high-throughput sequencing experiment by Weinstein et al. measured the IgM heavy chain frequencies of 975 VDJ recombination in each zebrafish. The experiment also measured the correlation in VDJ between all pairs of zebrafish. The experimentally measured correlation coefficients were classified into four bins: independence (correlation coefficient ), low correlation (), moderate correlation (), and high correlation (). This histogram of the correlation coefficients will be one of the predictions of our model.
3 Results and discussion
3.1 Overview of the results
In subsection 3.2 we present the results of the generalized model for the distribution and correlation of VDJ genotypes. Subsection 3.3 presents a sensitivity analysis to the number of naïve B cells reacting to the antigen, the somatic hypermutation rate, and the selection intensity. In subsection 3.4, the distribution of energy changes of single mutations in the generalized model is presented. The results of the delay ODE model in response to random antigen challenge are presented in subsection 3.5. Combining the results of the two models, we present the correlation coefficient between the VDJ usage in a pair of zebrafish. We will show that the predicted distribution of correlation coefficients of VDJ usage in a pair of fish matches the experimentally one [8] (, Pearson test).
3.2 Primary and secondary immune response against one antigen
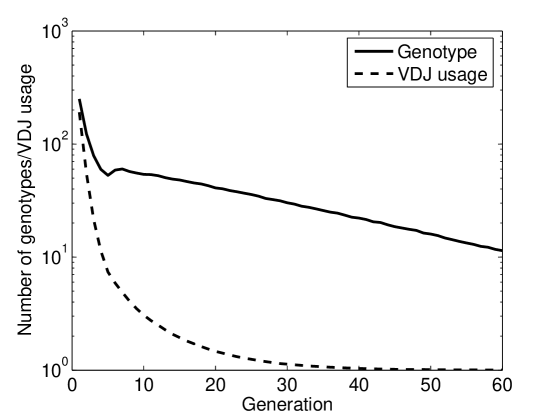
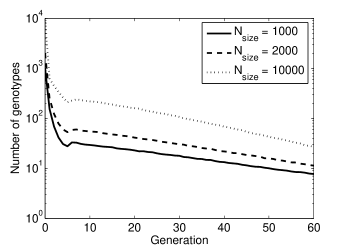
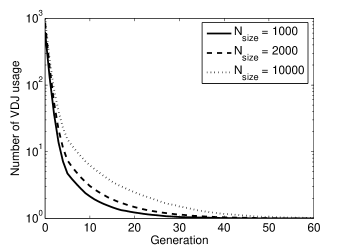
A distribution of immune responses is calculated in the generalized model. The diversity of VDJ recombinants decreases as the immune response proceeds, as shown in figure 22. Initially, the average number of VDJ recombinations was 849.6. During the primary immune response, the average number of genotypes rapidly decreased to 30.2 at generation 30 in an exponential way. In the secondary immune response, the average number of genotypes decreased from the value of 30.2 to 11.4 at generation 60 following the same exponential function of time. As shown in figure 22, localization in the VDJ recombination space occurred prior to that in the sequence space. Most of the sequence diversity in a single fish at the end of the primary response is the result of a single initial VDJ recombinant. The average number of VDJ recombinations reduced from the initial value of 849.6 to 1.13 at generation 30 at the end of the primary immune response, and further to 1.003 at generation 60 at the end of the secondary immune response. Thus, the B cells converged to one dominant VDJ recombination in nearly all immune responses. A dominant VDJ recombination exists in the 2000 B cells at the end of both the primary and the secondary immune response. In a sample of 1000 runs, 950 runs have the fraction of sequences that match the dominant one greater than 0.85 at the end of the primary immune response, and over 950 runs have the fraction equal to 1 at the end of the secondary immune response. The dominant VDJ recombination in two different zebrafish is identical at the end of the primary and the secondary immune responses with probability and , respectively. Because and are similar, we defined as the probability that two different zebrafish have the same dominant VDJ recombination at the end of an antigen-specific immune response, whether primary or secondary.
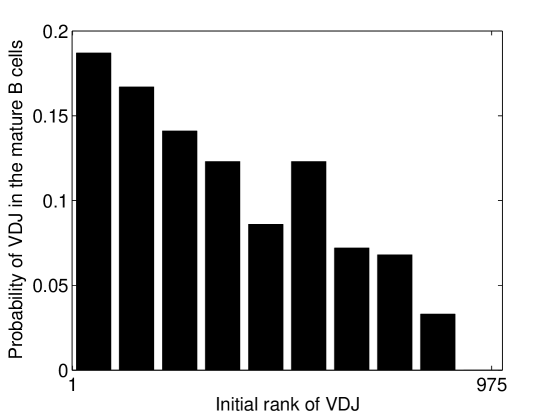
We calculate the probability with which an initially highly fit VDJ recombinant becomes the dominant VDJ recombination in the immune response. Figure 22 shows how the probability of becoming dominant depends on the initial fitness ranking. VDJ recombinations with higher ranks tend to be eventually fixed. This correlation of fitness with fixation is what creates correlation in the VDJ usages between a pair of fish that was observed in experiment [8].
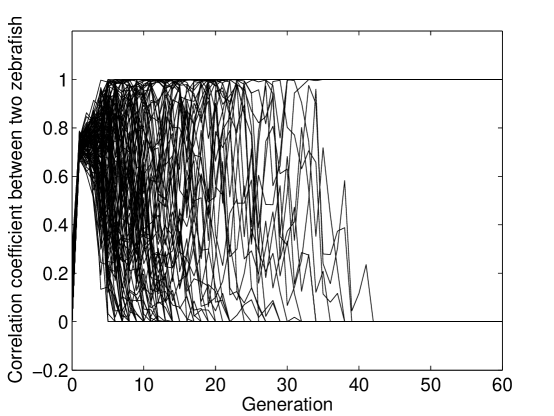
We now calculate the correlation in VDJ usage in a pair of zebrafish infected with the same antigen. As described in figure 3, naïve B cells at generation 0 in a pair of zebrafish show uncorrelated VDJ usage. The correlation coefficient increases rapidly to around 0.5 in the first three generations and after that showed large variation in different pairs. At the end of the primary immune reaction with 30 generations, most mature B cells in a single fish are evolved from the same VDJ recombination. The probability for the correlation in a pair of fish to be at the end of the primary and secondary immune responses is 0.301 and 0.327, respectively. The probability for at the end of the primary and secondary immune responses is 0.641 and 0.672, respectively.
These results show that each VDJ recombination initially in the naïve repertoire expands in a local neighborhood by somatic hypermutation. Eventually, only one of these clouds exists in the final mature repertoire. The initial energy is modestly correlated with whether the VDJ recombinant will survive in the mature repertoire. The trajectories of correlation coefficients in figure 3 converge to or 1 because the mature B cells against one antigen in most individuals show only one VDJ recombination, see figure 22. The correlation coefficient between VDJ usage in two zebrafish is if the mature B cells have distinct VDJ recombinations in the two zebrafish. The correlation coefficient is 1 if the VDJ recombination is identical in the two zebrafish. Correlations and 1 are, therefore, two absorbing states in the random process of correlation coefficients in the immune response. Figure 3 shows that the VDJ usage in B cells is localized by the end of the primary immune response; the secondary immune responses does not change the VDJ usage in most cases.
3.3 Parameter sensitivity in the generalized model
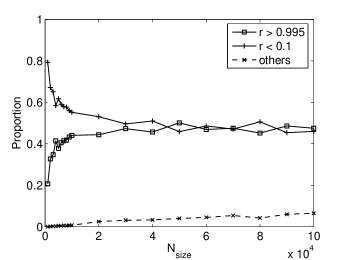
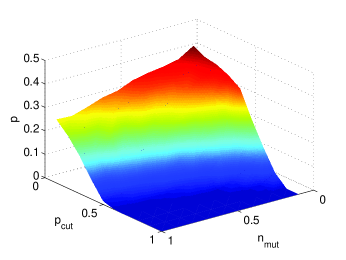
As shown in section 3.2, B cells in a pair of zebrafish converge to the same VDJ recombination with probability and converged to two different VDJ recombinations with probability . There exists a small probability that greater than two VDJ recombinations exist in the pair. Figure 44 plots , , and as the function of . The value of increased rapidly from 0.207 when to 0.475 when and were insensitive to with . The probability for non-converged VDJ recombinations increased with . The increasing trends of and come from the delayed localization of the VDJ recombination with larger . As illustrated by figures 44 and 44, localization in the sequence and recombination space occurs more slowly for larger . The B cells thus explore the energy landscape associated with the sequence space, around each VDJ recombinations, for a longer period of time for larger . That is, a larger value of enables the B cells to generate more mutants and to explore a broader subregion of the energy landscape, and fixation to a single VDJ recombination occurs more slowly. For small , the B cells in a pair of zebrafish, both of which explore the energy landscape more intensively, have a higher chance to evolve to the same local minimum in the energy landscape.
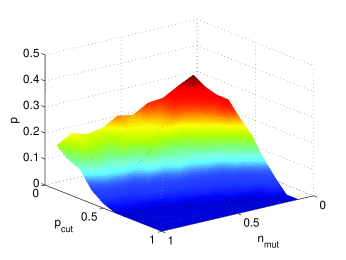
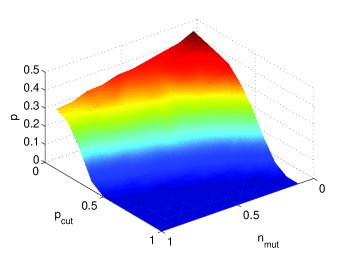
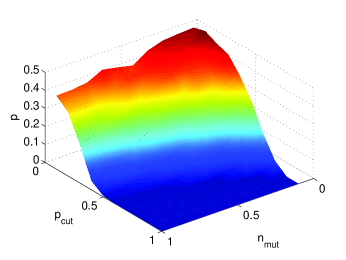
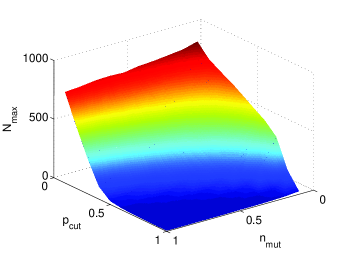
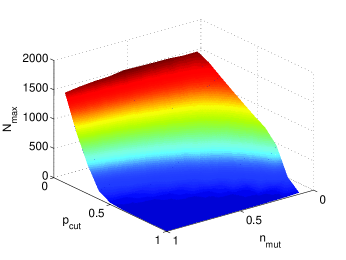
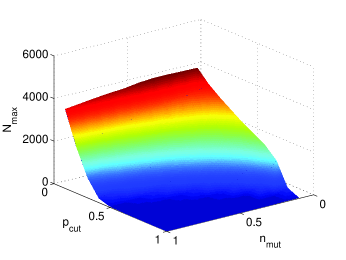
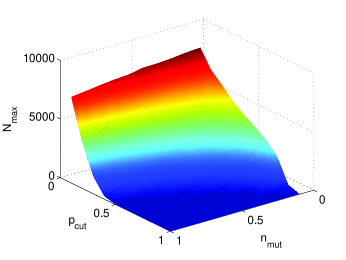
For fixed , the values of and affect the B cell maturation process. The effect of Both and , defined as the maximum number of B cells with identical sequence at the end of the primary immune response, depend on and . If is close to , most of the mature B cells from the primary immune response share the same genotype. The values used in the generalized model are and . Figures 5 and 6 show the dependence on and . The values of both and decrease quickly with . The values of and fall to near zero with . Both and are less sensitive to .
The two parameters and define the mutation and selection in B cell somatic hypermutation. The values of mutation rate, , and selection pressure, , observed in experiment have evolved during the evolutionary history of the immune systems [30]. The low sensitivity to in figures 5 and 6 indicates that with a hypermutation rate on the order of magnitude /sequence/generation, the immune system maintains the capability to explore the sequence space and to locate the local minima in the energy landscape. On the other hand, the selection pressure controls the B cell exploration in the rugged energy landscape. A small value of confines the B cells in compact regions in the sequence space by only allowing B cell genotypes with lowest energy to propagate to the next generation and causing premature localization. Smaller values of cause both zebrafish to have a higher chance to reach the same local energy minima, as described in figure 6, and result in increased correlation in the VDJ usage, as illustrated in figure 5.
3.4 Distribution of the energy change, , due to a point mutation
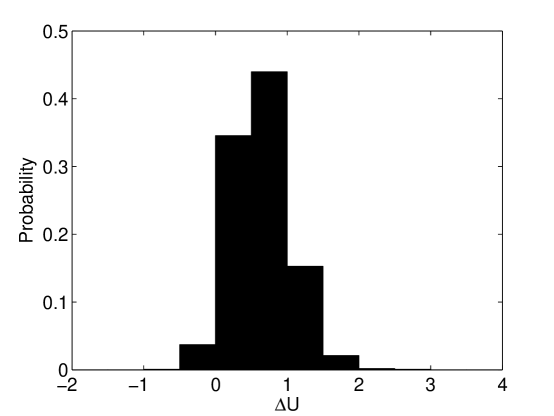
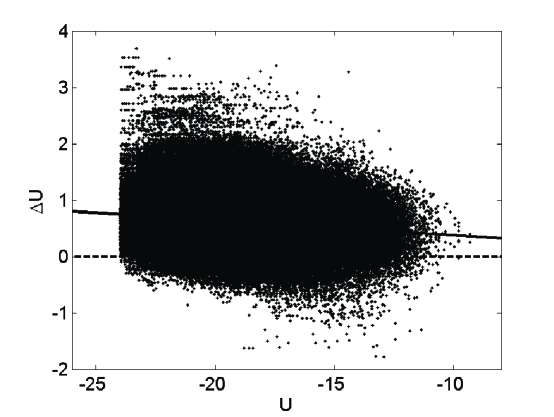
The generalized model used in this work was used to compute the distribution of energy and , the energy difference caused by a point mutation. At each generation from 0 to 60, was calculated by introducing a random mutation in each B cell. Figure 77 describes the distribution of . The point mutations with comprise 3.8% of the distribution. Experimentally, this fraction is observed to be 4.9% of the distribution [30]. Figure 77 plots the data points generated in the simulation in a two-dimensional space. The linear regression between and produces a trend line:
| (7) |
The slope of this trend line is significantly different from zero (). The negative slope is expected because is expected to have a symmetric distribution with center zero when equals to zero but to be skewed for negative in the generalized model [11, 12]. Equation 7 is consistent with this expectation within error bars. Figure 77 shows that the correlation between and is weak (). Weak correlation between and is observed in the PINT database of experimental data of affinity-related amino acid mutations [30].
3.5 Immune response to multiple antigens
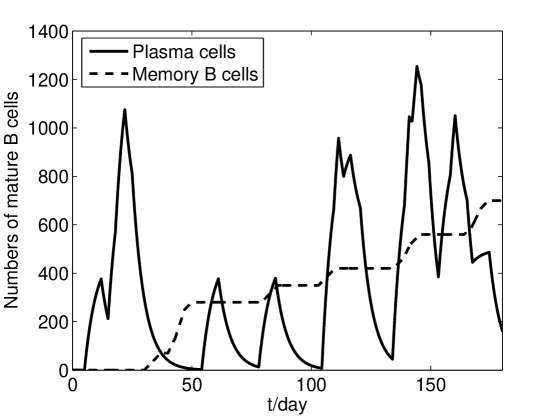
In the aquatic environment of the experiment, the fish are challenged by multiple antigens over their lifespan. Each type of antigen induces a distinct immune response and produces different mature B cells. The solution of the ODE model defined by equations 1 and 2 is determined by the presence of each antigen denoted by . In the simulation, we first randomly selected antigens to which the zebrafish were exposed at several time points, from a diversity of 10 total antigens. As discussed in Section 2.2, the rate of encountering antigen is 1/30 day-1. Figure 8 shows the dynamics of the total plasma cells and the total memory B cells in one run of the simulation. Each peak of plasma B cells corresponds to an antigen inoculation. In the particular instance shown in Figure 8, the zebrafish is stimulated 12 times with 8 distinct antigens, leading to 8 primary responses and 4 secondary responses in its six-month life span. The first innoculation with antigen induces a primary immune response response. Subsequent innoculations with antigens induce a primary immune response if it is a new antigen or a secondary immune response if the zebrafish was previously infected by an antigen of that type. The VDJ recombinants are assigned in the primary response and remain the same in any secondary response to the same antigen .
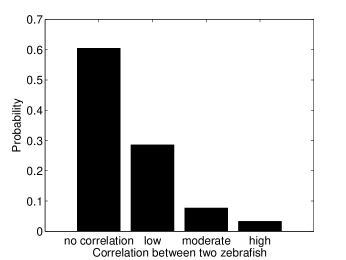
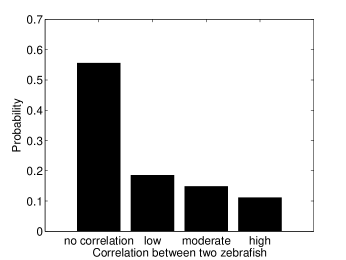
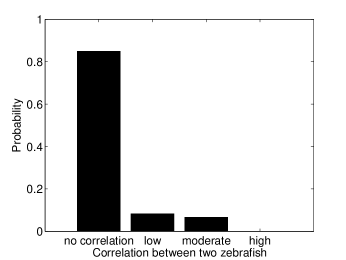
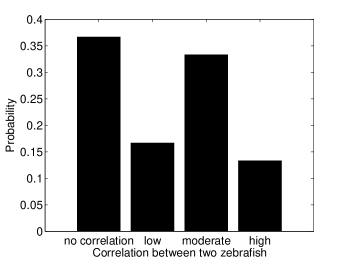
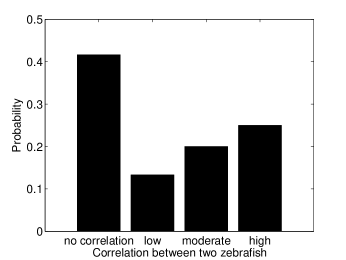
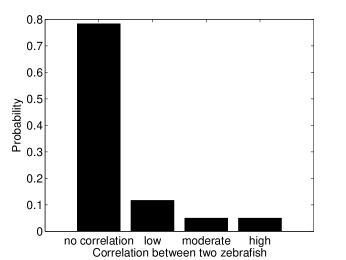
There is substantial similarity between the predicted distribution of the correlation coefficients of VDJ usages in pairs of fish and that measured in experiment [8]. We adopted the experimental categorization scheme for the correlation coefficient [8], which classifies the correlation coefficients in four bins: no correlation with , low correlation with , moderate correlation with , and high correlation with . The 14 zebrafish belonged to four different families, and each family lived in a separate aquarium. There are correlation coefficients between all pairs of the 14 zebrafish. Figure 99 shows the relative frequency of all 91 correlation coefficients in experiment in each of the four bins. We also calculate the 27 correlation coefficients between the VDJ usages in the zebrafish from the same family. Figure 99 shows the relative frequency of these 27 correlation coefficients in experiment in each of the four bins. Figure 99 shows the distribution of correlation coefficients from the simulation. The predicted and measured histograms are similar: Figure 99 and Figure 99 (, Pearson test) and Figure 99 and Figure 99 (, Pearson test).
The prediction relies on the value of , calculated from first principles from the generalized model. No adjustment of the generalized model from prior literature form or parameter values was done. The generalized model is well established based on the experimental data in immunology [2] and has successfully simulated the immune responses to influenza [12] and peptides [13]. In this study, we do not arbitrarily change the form of the generalized model or add any assumption. So is a first-principles calculation. We make two assumptions on the experimental data: (1) there are distinct types of antigen in the environment, and (2) the average time span between two events of infection is days. These two assumptions are necessary because we do not have information on the antigens infecting the zebrafish in experiment [8].
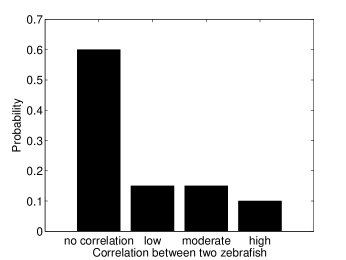
We performed a one-way analysis to test the sensitivity of the correlation histogram to the length of the experiment, the number of antigen types, and the frequency of antigen infection. Figure 10 shows the results. First, we find that increasing the length of experiment leads to higher correlation in VDJ usage in a pair of zebrafish, as shown in Figures 1010 and 10. Selection in the immune system is what causes the correlation, and a longer experiment allows for more selection. Second, Figures 1010 and 10 indicate that increasing the number of antigen types slightly decreases the correlation in VDJ usage. This is presumably because a greater antigen diversity leads to greater primary responses and random VDJ assignments rather than secondary responses, in which the VDJ usage remains unchanged from the primary response. Third, Figures 1010 and 10 indicate that increasing the frequency of antigen infection results in higher correlation in VDJ usage. This is because the selection that causes correlation is initiated only by exposure to antigen. Both a longer experiment and a higher frequency of antigen infection cause more primary and secondary immune responses in the fish. The sensitivity analysis in Figure 10 implies that repeated antigen exposure gradually localizes the VDJ usage in a pair of fish to the same region.
4 Conclusion and outlook
In this work, a multi-scale model is developed to describe the diversity of VDJ recombinations in zebrafish exposed to a diversity of antigens over their lifespan. The multi-scale model comprises a delay ODE model and a generalized model. The delay ODE model is a mean-field approximation averaging over the genotypes of B cells specific to one type of antigen. The dynamical system defined by the ODEs describes the average B cell response to the challenge of antigen infection. The solution of the ODE system gives the composition of the mature B cell repertoire at any time point between 0 and 180 days. The correlation between VDJ usage in the B cell repertoires in a pair of zebrafish is calculated. The predicted correlation of VDJ usage, Figure 9, is similar to that from the experiments [8], and predictions for different experimental conditions are presented, Figure 10.
The generalized model describes evolution of B cells specific to a single type of antigen. Each type of antigen in the environment leads to distinct memory B cell evolution. Selection over B cells removes genotypes with high energy and hence substantially localizes the B cells in the rugged energy landscape and in the sequence and VDJ recombination space. The localization, however, is not a deterministic process. The primary immune response has a probability to localize to the same VDJ recombination in a pair of zebrafish, and this is calculated by the generalized model. The probability increases with the number of B cells reacting to a specific type of antigen, while decreasing with the somatic hypermutation rate and the survival rate in the selection. A higher mutation rate increases the uncertainty in the B cell maturation process. A high level of selection in the immune system increases the tendency to fix the B cell in the current location in the energy landscape. We found the probability p to decrease with mutation rate and increase with selection intensity.
The correlation between VDJ usage in a pair of zebrafish shows that evolution in the immune system is not a completely random process. Somatic evolution is not an unbiased random walk. The finite VDJ repertoire size of the fish mean that a pair of fish have a nonzero probability, , to localize upon the same VDJ recombination. In the ODE model, correlation of the VDJ usage in the B cell repertoire on day 180 also shows that the B cell somatic evolution in a pair zebrafish may be correlated if they are challenged by the same antigen at the same time. Consequently, closely related antigen challenges may induce immune responses with similar characters in distinct individuals. Longer expeirments or more frequent antigen exposure significantly increases the correlation between fish, while reduced antigen diversity in the environment more modestly increases this correlation between fish.
This multi-scale model is flexible and extensible to analyze the immune system dynamics in zebrafish under different conditions or in other species. This study on the zebrafish B cell repertoire can be extended by analyzing the immune system in zebrafish at different ages. The B cell repertoire in these individuals may reveal the dynamics of development of immune systems challenged by various types of antigen, and allow for further tests of the model. Study of VDJ correlations in fish with closely related genomes may be interesting. We propose sequencing of the B cell repertoire of zebrafish in different families living in different controllable environments to test the contribution to VDJ usage of two factors: zebrafish genome and antigens in the environment. If the correlation of VDJ usage in distinct zebrafish strongly depend on their genetic similarity in other than by obvious dependence on the VDJ region, their genomes are a determinant of VDJ usage. If not, VDJ usage is independent of the genome of each individual.
Acknowledgments
This work was partially supported by DARPA grant HR 00110910055.
References
References
- [1] T. Matsunaga and A. Rahman. What brought the adaptive immune system to vertebrates? — The jaw hypothesis and the seahorse. Immunol Rev, 166:177–186, 1998.
- [2] C. Janeway, P. Travers, M. Walport, and M. Shlomchik. Immunobiology: The Immune System in Health and Disease. Garland Science, New York, 6th edition, 2005.
- [3] N. S. Trede, D. M. Langenau, D. Traver, A. T. Look, and L. I. Zon. The use of zebrafish to understand immunity. Immunity, 20:367–379, 2004.
- [4] C. Thisse and L. I. Zon. Organogenesis—heart and wood formation from the zebrafish point of view. Science, 295:457–462, 2002.
- [5] J. A. Yoder, M. E. Nielsen, C. T. Amemiya, and G. W. Litman. Zebrafish as an immunological model system. Microbes Infect, 4:1469–1478, 2002.
- [6] N. Danilova, V. S. Hohman, E. H. Kim, and L. A. Steiner. Immunoglobulin variable-region diversity in the zebrafish. Immunogenetics, 52:81–91, 2000.
- [7] N. Danilova, J. Bussmann, K. Jekosch, and L. A. Steiner. The immunoglobulin heavy-chain locus in zebrafish: Identification and expression of a previously unknown isotype, immunoglobulin Z. Nat Immunol, 6:295–302, 2005.
- [8] J. A. Weinstein, N. Jiang, R. A. White, D. S. Fisher, and S. R. Quake. High-throughput sequencing of the zebrafish antibody repertoire. Science, 324:807–810, 2009.
- [9] S. Kauffman and S. Levin. Towards a general theory of adaptive walks on rugged landscapes. J Theor Biol, 128:11–45, 1987.
- [10] S. A. Kauffman and E. D. Weinberger. The NK model of rugged fitness landscapes and its application to maturation of the immune response. J Theor Biol, 141:211–245, 1989.
- [11] L. D. Bogarad and M. W. Deem. A hierarchical approach to protein molecular evolution. Proc Natl Acad Sci USA, 96:2591–2595, 1999.
- [12] M. W. Deem and H. Y. Lee. Sequence space localization in the immune system response to vaccination and disease. Phys Rev Lett, 91:068101, 2003.
- [13] J. M. Park and M. W. Deem. Correlations in the T-cell response to altered peptide ligands. Physica A, 341:455–470, 2004.
- [14] J. Sun, D. J. Earl, and M. W. Deem. Glassy dynamics in the adaptive immune response prevents autoimmune disease. Phys Rev Lett, 95:148104, 2005.
- [15] H. Zhou and M. W. Deem. Sculpting the immunological response to dengue fever by polytopic vaccination. Vaccine, 24:2451–2459, 2006.
- [16] V. Gupta, D. J. Earl, and M. W. Deem. Quantifying influenza vaccine efficacy and antigenic distance. Vaccine, 24:3881–3888, 2006.
- [17] M. Yang, J. M. Park, and M. W. Deem. Evolutionary design in biological physics and materials science. Lect Notes Phys, 704:541–562, 2006.
- [18] M. Yang, J. M. Park, and M. W. Deem. A theory of multi-site vaccination for cancer. Physica A, 366:347–364, 2006.
- [19] E. Muñoz and M. W. Deem. Amino acid alphabet size in protein evolution experiments: better to search a small library thoroughly or a large library sparsely? Protein Eng Des Sel, 21:311–317, 2008.
- [20] H. Zhou, R. Pophale, and M. W. Deem. Computer-assisted vaccine design. In Qinghua Wang and Yizhi Jane Tao, editors, Influenza: Molecular Virology, pages 173–191. Caister Academic Press, 2009.
- [21] J. Sun, D. J. Earl, and M. W. Deem. Localization and glassy dynamics in the immune system. Mod Phys Lett B, 20:63–95, 2006.
- [22] M. H. Zaman. Statistical Mechanics of Cellular Systems and Processes. Cambridge University Press, 2009.
- [23] D. M. Lorenz, A. Jeng, and M. W. Deem. The emergence of modularity in biological systems. Phys Life Rev, 8:129–160, 2011.
- [24] T. Mora, A. M. Walczak, W. Bialek, and C. G. Callan. Maximum entropy models for antibody diversity. Proc Natl Acad Sci USA, 107:5405–5410, 2010.
- [25] C. Berek, A. Berger, and M. Apel. Maturation of the immune response in germinal centers. Cell, 67:1121–1129, 1991.
- [26] D. J. Earl and M. W. Deem. Evolvability is a selectable trait. Proc Natl Acad Sci USA, 101:11531–11536, 2004.
- [27] J. Sun and M. W. Deem. Spontaneous emergence of modularity in a model of evolving individuals. Phys Rev Lett, 99:228107, 2007.
- [28] J. Jacob, R. Kassir, and G. Kelsoe. In situ studies of the primary immune-response to (4-hydroxy-3-nitrophenyl)acetyl. I. The architecture and dynamics of responding cell populations. J Exp Med, 173:1165–1175, 1991.
- [29] K. G. C. Smith, A. Light, G. J. V. Nossal, and D. M. Tarlinton. The extent of affinity maturation differs between the memory and antibody-forming cell compartments in the primary immune response. EMBO J, 16:2996–3006, 1997.
- [30] J. S. Zhang and E. I. Shakhnovich. Optimality of mutation and selection in germinal centers. PLoS Comput Biol, 6:e1000800, 2010.
Table and figures
| The delay ODE model | The generalized model | |
|---|---|---|
| Number of zebrafish used | 1 | 2 |
| Type of antigens | Multiple | 1 |
| Type of antigen-specific mature B cells | Multiple | 1 |
| Number of primary/secondary immune responses simulated | Multiple (primary) Multiple (secondary) | 1 (primary) 1 (secondary) |
| Simulation length | 180 days, as in the experiment [8] | 10 days for the primary immune response, 10 days for the secondary immune response |
| Information on the mature B cells given by the model | Numbers of plasma cells and memory B cells | Number of mature B cell (including plasma cells and memory B cells), amino acid sequence of each B cell, binding affinity to the certain antigen of each B cell |
| Minimal component in the model | B cell | Amino acid residue in the V region of the antibody |
| Mathematical basis | Delay ODE | Spin-glass theory [11, 12] |
| Input | (1) A series of antigens, each of which infect the zebrafish in one or more time points (2) The probability that the mature B cells in two zebrafish have the same VDJ recombination | None |
| Output | Dynamics of plasma cells and memory B cells specific to each type of antigen | The probability |
| Connection of the two models | (1) For each type of antigen , gives the number of plasma cells and memory B cells specific to any antigen at any time point (2) Assigns identical (probability: ) or distinct (probability: ) VDJ recombination to () mature B cells specific to antigen in either zebrafish. | For each type of antigen , gives the probability |