Single crystal growth and optical conductivity of SrPt2As2 superconductors
Abstract
SrPt2As2 single crystals with CaBe2Ge2-type structure were synthesized by self-melting technique. X-ray diffraction, transmission electron microscopy, electrical resistivity, magnetic susceptibility, specific heat and optical spectroscopy measurements were conducted to elucidate the properties of SrPt2As2. SrPt2As2 single crystals undergo a structural phase transition well above the room temperature (about 450 K) and become superconducting at 5.18 K. The superconducting and structural phase transition temperatures are reduced by 6 Iridium doping. Both the pure SrPt2As2 and the Ir-doped single crystals are demonstrated to be highly metallic with rather high plasma frequencies. In particular, the optical spectroscopy measurement revealed two gap-like suppression structures: a stronger one at high energy near 12000 cm-1 (1.5 eV), and a less prominent one at lower energy near 3200 cm-1 (0.4 eV) for the pure compound. We elaborate that the former is related to the correlation effect, while the latter could be attributed to the partial energy gap formation associated with structural phase transition.
pacs:
71.45.Lr, 74.25.Gz, 74.70.-bI Introduction
The discovery of high-temperature superconductivity in iron-pnictide compounds has generated tremendous interest in the condensed matter community.Hosono Following the initial discovery in LaOFeAs, a number of different structure types of iron-based superconducting compounds that shared similar properties were quickly discovered. Among the different systems, the ThCr2Si2-type 122 pnictide compounds have attracted much attention 122-1 ; 122-2 ; homes due to their wide range of dopings either by holes or electrons, as well as the easy growth of single crystals with sufficient sizes for various experiments. The peculiar properties of iron-pnictides come from the edge-sharing Fe2As2 tetrahedral layers where Fe ion locates in the center of each As tetrahedron (FeAs4). Those tetrahedral layers are separated by alkaline-earth elements Ca, Sr, and Ba or Eu in those 122 structures. In addition, to gain further insight into the nature of the materials, many efforts were also made to explore other 3d, 4d or 5d transitional metal based 122 compounds.
The 5d-transition metal Pt-pnictide SrPt2As2 appears to be a very interesting material. It shows superconductivity at 5.2 K.polymorph Different from other 122 superconducting compounds, SrPt2As2 does not crystallize in a ThCr2Si2 structure but adopt a tetragonal CaBe2Ge2-type structure. The major difference between ThCr2Si2 and CaBe2Ge2-type structures is that the former contains two separate Fe2As2 tetrahedral layers with Fe ion locating in the center of each As tetrahedron (FeAs4), while the latter contains only one Pt2As2 layer with Pt ion locating in the center of each As tetrahedron (PtAs4) in an unit cell. Another Pt2As2 tetrahedral layer is replaced by the As2Pt2 tetrahedral layer with As ion locating in the center of each Pt tetrahedron (AsPt4) (see the structure in the inset of Fig. 1). Looking along the c-axis, the AM2As2 with ThCr2Si2-type structure contains stacking of a sequence of atomic sheets of [As-M2-As]-A-[As-M2-As]…, while the SrPt2As2 with CaBe2Ge2-type structure contains stacking of a sequence of atomic sheets of [As-Pt2-As]-Sr-[Pt-As2-Pt]….
Another significant feature for the SrPt2As2 is that the compound experiences a structural phase transition at about 470 K. XRD Below this temperature, a superstructure with a modulation vector q=0.62a* is formed. Notably, the modulation appears in the layers of the PtAs4 tetrahedra, the other atoms are only slightly affected by the modulation. XRD The structural phase transition was identified as a charge-density-wave (CDW) instability in earlier work. As a result, SrPt2As2 was argued to exhibit a coexistence of superconductivity and CDW instability. polymorph
It would be very interesting to explore the electronic properties of SrPt2As2. Up to now there have been only a few experimental studies on this compound. All of them were performed on polycrystalline samples. In this work, we report on single crystal growth of pure and 6 Iridium-doped SrPt2As2 compounds and investigation of their physical properties by different experimental probes. We find that the structural phase transition leads to a removal of about 17 spectral weight at low frequency in optical conductivity spectra, suggesting a reconstruction of the Fermi surfaces.
II Crystal growth and characterizations
Single crystals of SrPt2As2 were synthesized by self-melting technique. Sr (99.99%) pieces, sponge Pt (99.99%) grains and As (99.99%) grains were used as starting materials. PtAs precursor was first fabricated by heating Pt grains and As powder at 700 sealed in a quartz tube. The fabricated PtAs was grounded, mixed with Sr pieces in an atomic ratio of 2:1, and placed in an alumina crucible which was sealed in an tantalum tube under Ar gas at the pressure of 1 bar. The mixture was heated at 900 and then at 1330 for 15 hours respectively, and then slowly cooled to 1030 at a rate of 3/. We also tried to prepare SrPt2As2 polyctystalline first and melt it at 1330. Both methods can yield big shiny plate-like single crystals. It is worth to mention that the resultant single crystals are quite three dimensional (3D) and hard to be cleaved. The observations are quite different from iron pnictide compounds crystallized in ThCr2Si2 structure, which are plate-like and very easy to cleave from the melts. Those seem to indicate that the Pt-As bonding strength between neighboring As2Pt2 and Pt2As2 tetrahedral layers may be comparable to the Pt-As bonding strength within As2Pt2 or Pt2As2 tetrahedral layers, a result being consistent with the first principle calculations by Shein et al..calculation We also grew single crystals of Ir-doped SrPt2As2 by the same method. The obtained samples have similar characteristics as SrPt2As2.
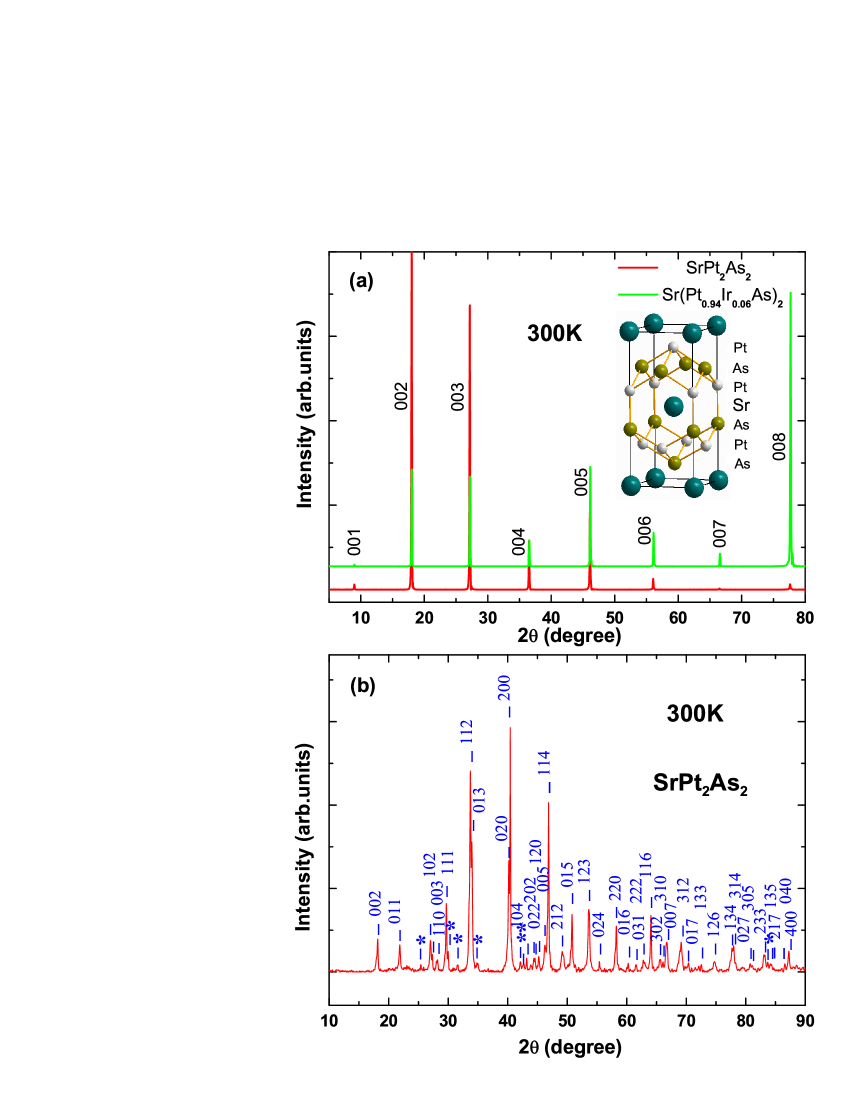
Figure 1 (a) shows the X-ray diffraction (XRD) patterns of SrPt2As2 and Sr(Pt0.94IrAs2 single crystals at 300 K. The (00) (=) diffraction peaks indicate a good c-axis orientation. Thus the largest face of the single crystals is the ab-plane. The lattice parameters 1=9.834 and 2=9.824 are obtained from the single crystal XRD data of SrPt2As2 and Sr(Pt0.94IrAs2 respectively. The slight reduction in -axis lattice parameter comes possibly from the slight smaller ionic radius of element Iridium. We also ground the crystal and performed power XRD measurement. Figure (b) shows the XRD pattern of SrPt2As2 at 300 K. Since 300 K is already below the structural phase transition, the superstructural modulation would lead to a structural distortion from the high-temperature tetragonal phase with the CaBe2Ge2-type structure to a phase with the average structure of the orthorhombic space group Pmmn.XRD ; polymorph The powder XRD pattern of Fig. 1 (b) could be indexed by such averaged structure with lattice parameters =4.47, =4.50 and =9.82, being consistent with the previous report.polymorph The minor extra peaks labeled by asterisks were from the contamination of impurity phases As and PtAs2. The structural characterizations reveal good quality of the obtained single crystals.
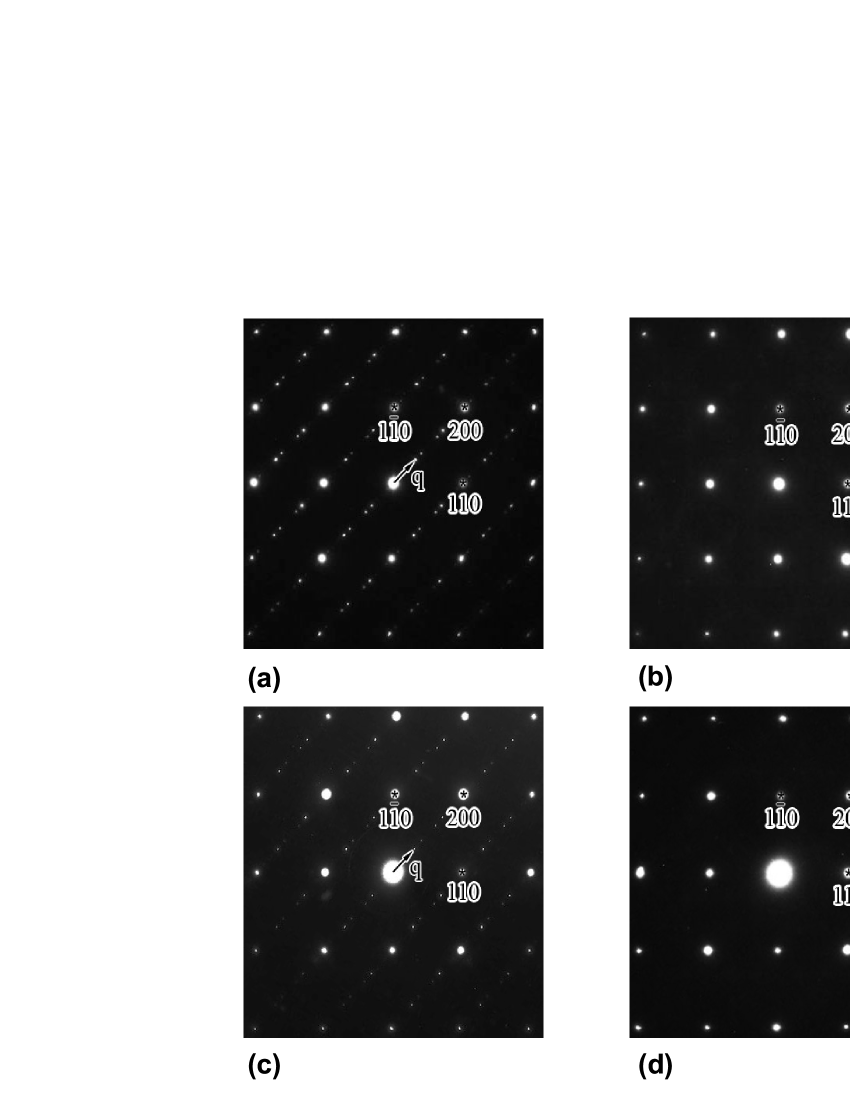
The electron diffraction patterns were taken on a FEI Tecnai-F20 (200 kV) transmission electron microscope (TEM). The TEM samples were prepared by crushing the single crystals, and then the resultant suspensions were dispersed on a holey copper grid coated with a thin carbon film. Figure 2 displays the room-temperature electron diffraction patterns taken along [001] zone axis of SrPt2As2 ((a) and (b)) and Sr(Pt0.94IrAs2 ((c) and (d)), respectively. The most striking structural phenomenon in this pattern is the appearance of a series of satellite spots aligned with the main diffraction spots, as clearly illustrated in Fig. (a) and (c). These satellite spots in general can be characterized by the modulation wave vector q0.62a* for SrPt2As2, as reported by Imre et. al.,XRD . A slight reduction of the modulation wave vector (roughly q0.60a*) is observed for Sr(Pt0.94IrAs2. The satellite spots were not visible when measurements were performed at 470 K and 400 K on the two samples, respectively.
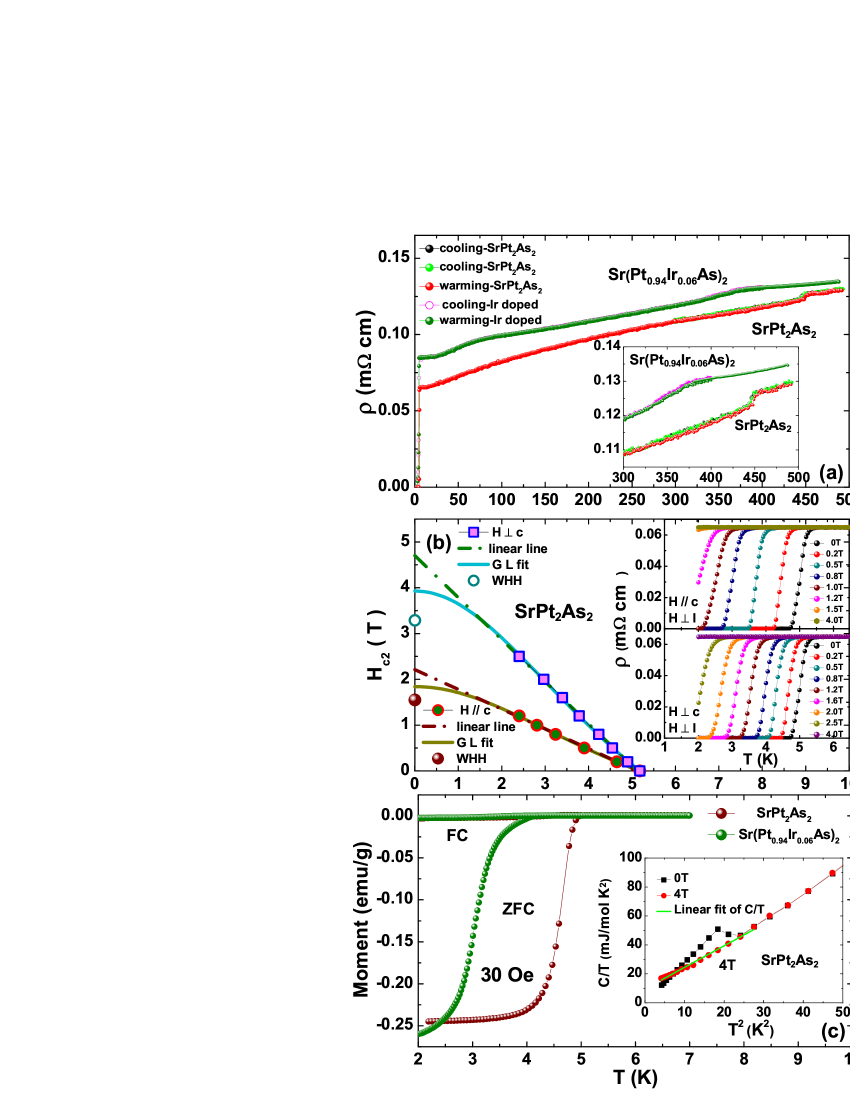
Resistivity measurements were performed in both Quantum Design physical properties measurement system (PPMS) (below 350 K) and a home-made transport measurement system (up to 500 K) by a standard dc four-probe method. Figure 3 presents the temperature dependence of resistivity for SrPt2As2 and Sr(Pt0.94IrAs2. The two samples show sharp superconducting transitions at 5.18K and 4.73K (90 of the normal state resistivity), respectively. At high temperatures, a small resistivity jump near 450 K is seen for pure SrPt2As2 crystal with almost no hysteresis upon warming and cooling processes, while only a slope change could be seen near 375 K for Sr(Pt0.94IrAs2 sample. The high temperature anomalies are of the characteristic of the first order phase transition.
The insets of Fig. 3 (b) shows the temperature-dependent resistivity curves in magnetic fields up to 4 T with and , respectively. The superconducting transition shifts toward lower temperature with an increase of the magnetic field, indicating a field-induced pair breaking effect. Taking the criterion of 90% of , the upper critical field can be obtained as displayed in the middle panel of Fig. 3. According to the Werthaner-Helfand-Hohenberg (WHH) formula,WHH the zero-temperature upper critical field can be estimated by
| (1) |
Taking = 5.18 K, ( T/K and ( T/K, T, T, and can be achieved. Different from the quite high upper critical field of the FeAs-based superconductors,Hc2-1 ; Hc2-2 this PtAs-based superconductor is quite sensitive to the magnetic field. The anisotropic ratio is comparable to that of BaNi2P2 BaNi2P2 . The ratio =3.29/5.18 T/K T/K is far less than the Pauli limit T/K, representing the singlet pairing if assuming a weak spin-orbital coupling.Pauli limit Therefore SrPt2As2 may be the conventional superconductor in accord with the estimated result of the average electron-phonon coupling constant.calculation We also determine using the formula based on the Ginzburg-Landau(GL) equation, . The obtaining values are T, T and , which are close to the value obtained by WHH analysis.
The superconducting transition could also be seen clearly in the magnetization and specific heat measurements, yielding evidence for bulk superconductivity, as presented in Fig. 3(c). The magnetic susceptibility was measured in a Quantum Design superconducting quantum interference device vibrating-sample magnetometer system (SQUID-VSM). At the temperature where resistivity drops to zero, the magnetic susceptibility displays a sharp superconducting transition. The specific-heat coefficient vs relation for SrPt2As2 is shown in the inset of Fig. 3(c). In agreement with the measurement on polycrystalline sample,polymorph the superconductivity is completely suppressed by a magnetic field of 4 T. From the linear fit of relation at low temperature, we get the electronic specific heat coefficient and . The extracted Debye temperature is .
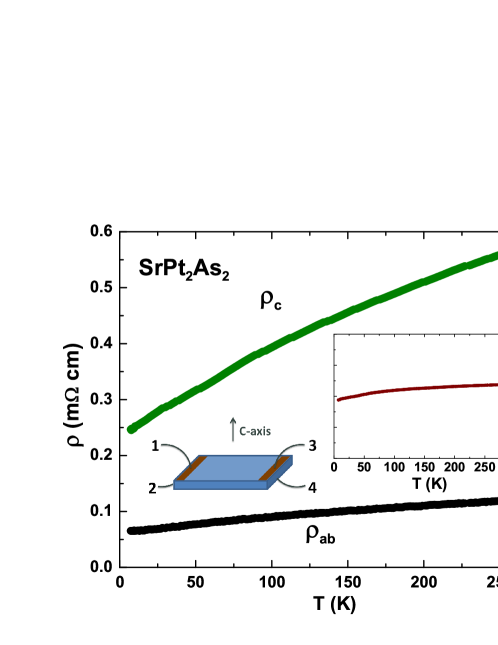
We also measured the anisotropic resistivity between ab-plane and the c-axis by a generalized Montgomery method,Montgomery as presented in Fig. 4. The contact configuration is shown in the inset. Instead of the point contact in the original Montgomery method, we extended the contacts along the edges of the sample to minimize the distortion effect of finite contact size along the c axis .wang-Resistance The resistances, R and R, with the current nominally parallel and normal to the ab plane, respectively, were measured by the four leads method. The resistivity components, (T) and (T), were then calculated from the ratio of R2/R1 in the thin sample limit of the Montgomery technique. The obtained , and are shown in the main panel and its inset, respectively. The anisotropic ratio is about 4.8 at 300 K. There is only a weak temperature dependence for the anisotropic resistivity. The anisotropic ratio is reduced to 3.8 at the lowest measurement temperature, implying a slight enhancement of three dimensionality. The values of 2.19 (300 K), 1.95 (low temperature) are quite close to the values of .BaNi2P2
III Optical conductivity
The ab-plane optical reflectance measurements were conducted on Bruker 113v and Vertex 80v spectrometers in the frequency range from 40 to 40000 cm-1 . An in situ gold and aluminum over-coating technique was used to get the reflectivity R(). The real part of conductivity was obtained by the Kramers-Kronig transformation of R(). The Hagen-Rubens relation was used for low frequency extrapolation; at high frequency side a relation was used up to 300000 cm-1 , above which was applied.
Figure 5 illustrates the reflectance curves below 20000 cm-1 for several temperatures from 10 to 500 K, while the inset displays the enlarged spectral behavior up to 5000 cm-1 . Being consistent with the dc resistivity data, the optical reflectance shows good metallic response in both frequency and temperature dependence. The overall values of R() are much higher than that of iron-pnictides, e.g. the prototype AFe2As2 (A=Ba, Sr),BaFe2As2 and are also higher than that of BaNi2As2.BaNi2As2 Furthermore, the reflectance minimum (or overdamped edge) extends to much higher frequency. Those characteristics indicate a rather high plasma frequency. An estimation will be made below.
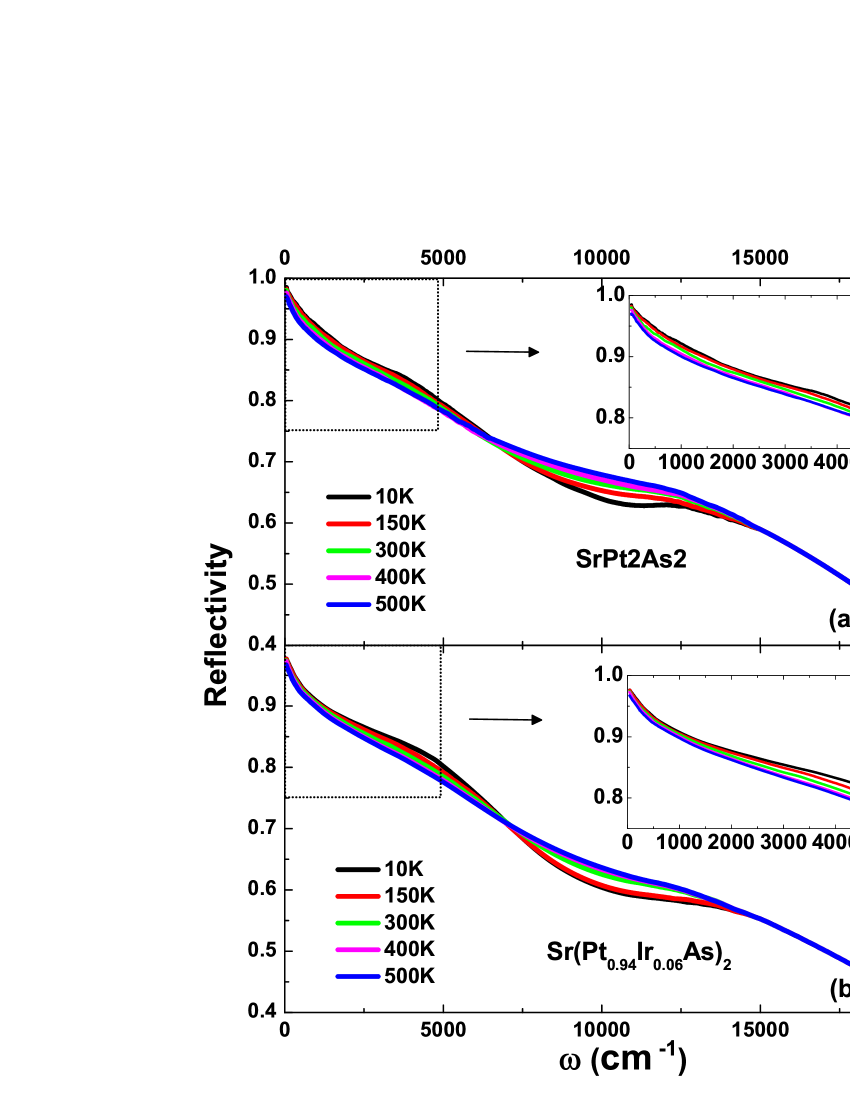
The most interesting observation in the R() is the manifestation of the two reverse S-like suppression features at the reduced temperatures. A stronger suppression structure appears at high energy near 12000 cm-1 (1.5 eV), and a less prominent suppression appears at lower energy scale near 3200 cm-1 (0.4 eV) for SrPt2As2. For Ir doped compound Sr(Pt0.94IrAs2, the latter feature shifts to lower frequency. Understanding the two features is of crucial importance for understanding the evolution of the electronic structure across the transition.
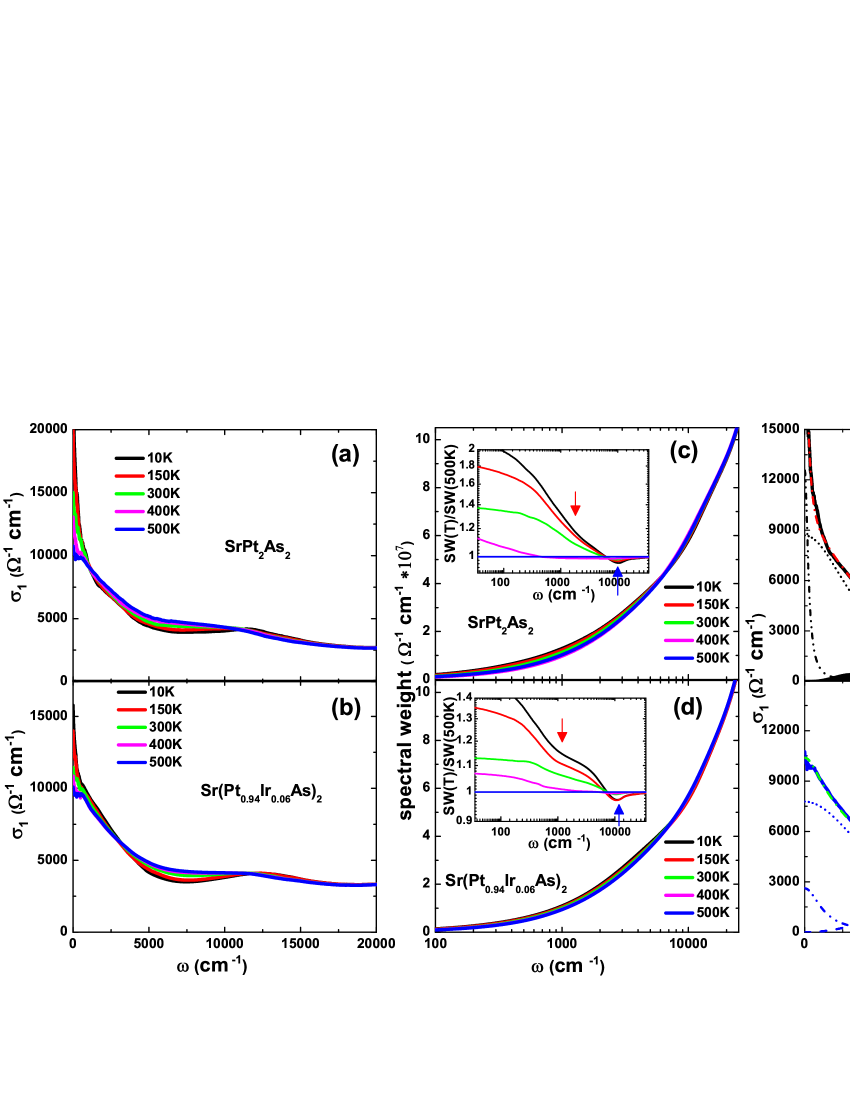
The two suppression features also manifest in the optical conductivity spectrum , as presented in Fig. 6 (a) and (b). The Drude-like conductivity can be observed for all spectra at low frequencies. Corresponding to the high energy suppression structure of R(), the conductivity spectra display a broad peak near 12000 cm-1 . The suppressed spectral weight below this energy is transferred to higher energy scales. By lowering the temperature, a weak bump related to the low frequency suppression of the reflectance could be also seen in . In order to have a better view about the evolution of the optical conductivity, we plot the integrated spectral weight distribution in Fig. (c) and (d) in a semilog scale. The insets present the normalized spectral weight SW(T)/SW(500K). Due to the metallic response the spectral weight gradually increases with decreasing the temperature in very low frequency range. However, a pronounced drop appears in the spectral weight curves near 2000 cm-1 followed by a shoulder-like feature, as indicated by the red arrow. The more prominent structure of the high energy suppression in at high energy scale leads to a dip feature in normalized spectral weight as indicated by the blue arrow.
It is well known that the interband transitions contribute dominantly to the conductivity spectrum at high energies and usually lead peaks in . However, one would not expect to see a prominent temperature dependence for an interband transition. So the temperature dependent spectral weight transfer near 1.5 eV must have a different origin. In general, the temperature-induced reverse S-like suppression in R() and corresponding peak-like feature in would represent the formation of an energy gap (or pseudogap). Nevertheless, the energy scale of the high energy gap feature near 1.5 eV is too high to be connected to the structural phase transition at 450 K or 375 K for the two compounds. A careful inspection of the spectra indicates that the characteristic peak-like lineshape is already present at 500 K. It deserves to remark that similar spectral suppression features are also present in many other correlated electronic systems, for example, the Fe-pnictide compounds though the corresponding energy scale is much lower, roughly at 0.6 eV.nlwang ; Schafgans In general, we could attribute the temperature-dependent high energy feature to the correlation effect, i.e., the quasi-particles contain not only the coherent spectral weight at low energy but also the incoherent part at high energies arising from the strong Coulomb interactions.Georges ; Rozenberg ; Qimiao For Fe-pnictides, because of the relatively narrow 3d electron bands, the Hund's coupling effect between different orbitals plays a major role.nlwang ; Schafgans For SrPt2As2 compound, the 5d orbitals are spatially much extended than 3d or 4d compounds, the Hund's rule coupling interaction is relatively weak, we speculate that the peak feature at 1.5 eV is mainly caused by the on-site Coulomb repulsion (Hubbard U) effect.Georges ; Rozenberg
SrPt2As2 10K 260 3800 150K 360 3900 300K 570 4000 400K 700 4200 500K 1250 5250
On the other hand, the spectral weight suppression feature at lower energy scale near 3200 cm-1 is likely to be caused by the removal of a small part of Fermi surface below the structural transition. It is noted that, unlike other compounds showing first order structural phase transitions, e.g. BaNi2As2 BaNi2As2 or IrTe2 Fang , where the optical conductivity spectra show sudden and dramatic changes over broad frequency across the phase transitions due to the reconstruction of the band structures, the spectral suppression feature in the present case is rather weak and evolves continuously with temperature, being more similar to some CDW materials such as 2H-TaS2 and 2H-NbSe2.NbSe2-Basov ; NbSe2-Hu ; TaS2-Hu
To quantify the spectral change, particularly the evolution of the Drude component, across the phase transition, we tried to decompose the optical conductivity spectral into different components using a Drude-Lorentz analysis. The dielectric function has the form
| (2) |
where is the real part of dielectric constant at high energy, and are the plasma frequency and scattering rate of the itinerant carriers in the th band respectively, and , and are the resonance, strength and width of the th Lorentz oscillator. The Drude components represent the contribution from conduction electrons, while the Lorentz components describe the interband transitions. We found that the optical conductivity spectrum at 500 K below 15000 cm-1 could be reasonably reproduced by two Drude and one Lorentz components. However, at low temperatures, an additional Lorentz component centered at 3200 cm-1 should be better added. Fig. 6 (e) and (f) shows the conductivity spectra at 10 K and 500 K together with the Drude-Lorentz fitting components for SrPt2As2. The parameters of Drude components at different temperatures are listed in Table I. We find that the two Drude components show ordinary narrowing with decreasing temperature due to the metallic response, while the gapping of the Fermi surfaces mainly appears in the broad Drude component. We can use the formula to estimate the overall plasma frequency, then we get 51400 cm-1 at 500 K, and 46650 cm-1 at 10 K, respectively. Those values are much higher than that of Fe-pnictide superconductors. The reduction of the overall plasma frequency could be attributed to the gapping of the Fermi surface. Roughly, we can use (17% to estimate the missing carrier density. The missing spectral weight is mainly transferred to the Lorentz part centered at 3200 cm-1 . It is worth to mention that our decomposition of conductivity spectrum into two Drude components may lead to an over-estimate of the spectral weights (particularly the broad one) or the plasma frequencies, but this effect is minor. Even if we try a single Drude component to reproduce the low-frequency spectral weight, we still obtain a plasma frequency close to 50000 cm-1 at 500 K. Nevertheless, the one Drude component could not well reproduce the conductivity spectra, in particular those at low temperatures. Another source of uncertainty in the estimation of the plasma frequency is from the Kramers-Kronig transformation of the reflectance spectra. Different high frequency extrapolations could affect the spectral weight even at low frequencies, thus resulting in somewhat different values of the plasma frequencies.
At present, it is not clear whether the compounds have nested Fermi surfaces; and if nesting exists, whether the nesting wave vector matches with the structural modulation wave vector. In other words, whether or not the nesting instability is strong enough to drive the structural distortion. Further theoretical and experimental studies on this system are needed.
IV CONCLUSIONS
We have successfully grown single crystals of SrPt2As2 using a self-melting technique and conducted careful characterizations by X-ray diffraction, transmission electron microscopy, electrical resistivity, magnetic susceptibility and specific heat measurements. SrPt2As2 single crystals are manifested to possess a bulk superconductivity and carry a superstructure with a modulation vector q=0.62a* below 5.18K and 450K, respectively. The optical spectroscopy study on the pure and Ir-doped SrPt2As2 revealed two gap-like suppression structures. The one at higher energy scale is attributed to the correlation effect, while the other one at lower energy scale is suggested to be the partial energy gap formation associated with structural phase transition. It is estimated that roughly 17% carrier density was removed accompanying with the energy gap formation.
ACKNOWLEDGMENTS
This work was supported by the National Science Foundation of China (10834013, 11074291, 11120101003) and the 973 project of the Ministry of Science and Technology of China (2011CB921701).
References
- (1) Y.Kamihara, T.Watanabe, M.Hirano, and H.Hosono, J.Am. Chem. Soc., 103, 3296(2008).
- (2) Marianne Rotter, Marcus Tegel, and Dirk Johrendt, Phys. Rev.Lett. 101, 107006 (2008).
- (3) Kalyan Sasmal, Bing Lv, Bernd Lorenz, Arnold M. Guloy, Feng Chen, Yu-Yi Xue, and Ching-Wu Chu, Phys. Rev.Lett. 101,107007 (2008).
- (4) J. J. Tu, J. Li, W. Liu, and A. Punnoose, Y. Gong, Y. H. Ren, L. J. Li, G. H. Cao, Z. A. Xu, C. C. Homes, Phys. Rev. B 82, 174509 (2010).
- (5) Kazutaka Kudo, Yoshihiro Nishikubo, and Minoru Nohara, J. Phys. Soc. Jpn. 79, 123710 (2010).
- (6) A. Imre, A. Hellmann, G. Wenski, J. Graf, D. Johrendt, and A. Mewis, Z. Anorg. Allg. Chem. 633 2037 (2007).
- (7) I. R. Shein and A. L. Ivanovskii, Phys. Rev. B 83, 104501 (2011).
- (8) N. R. Werthamer, E. Helfand, and P. C. Hohenberg ,Phys. Rev. 147, 295 (1966).
- (9) F. Hunte, J. Jaroszynski, A. Gurevich, D. C. Larbalestier, R. Jin, A. S. Sefat, M. A. McGuire, B. C. Sales, D. K. Christen and D. Mandrus, Nature (London) 453, 903(2008).
- (10) Z. S. Wang, H. Q. Luo, C. Ren, and H. H. Wen, Phys. Rev. B 78, 140501(R) (2008).
- (11) Y. Tomioka, S. Ishida, M. Nakajima, T. Ito, H. Kito, A. Iyo, H. Eisaki, and S. Uchida, Phys. Rev. B 79, 132506(R) (2009).
- (12) A. M. Clogston, Phys. Rev. Lett. 9, 266 (1962).
- (13) H. C. Montgomery, J. Appl. Phys. 42, 2971 (1971), and accompanying paper by B. F. Logan, S. O. Rice, and R. F. Wick, ibid. 42, 2975 (1971).
- (14) N. L. Wang, B. Buschinger, C. Geibel and F. Steglich, Phys. Rev. B 54, 7449 (1996).
- (15) W. Z. Hu, J. Dong, G. Li, Z. Li, P. Zheng, G. F. Chen, J. L. Luo, and N. L. Wang, Phys. Rev. Lett. 101, 257005 (2008).
- (16) Z. G. Chen, G. Xu, W. Z. Hu, X. D. Zhang, P. Zheng, G. F. Chen, J. L. Luo, Z. Fang, and N. L.Wang, Phys. Rev. B 80, 094506 (2009).
- (17) N. L. Wang, W. Z. Hu, Z. G. Chen, R. H. Yuan, G. Li, G. F. Chen, and T. Xiang, arXiv:1105.3939 (to be published in a special issue of J. Phys.: Condensed Matt.).
- (18) A. A. Schafgans, S. J. Moon, B. C. Pursley, A. D. LaForge, M. M. Qazilbash, A. S. Sefat, D. Mandrus, K. Haule, G. Kotliar, D. N. Basov, Phys. Rev. Lett. 108, 147002 (2012).
- (19) A. Georges, G. Kotliar, W. Krauth and M. J. Rozenberg, Rev. Modern. Phys. 68, 13 (1996).
- (20) M. J. Rozenberg, G. Kotliar, H. Kajueter, G. A. Thomas, D. H. Rapkine, J. M. Honig, and P. Metcalf, Phys. Rev. Lett. 75, 105 (1995).
- (21) Qimiao Si, Nature physics 5, 629 (2009).
- (22) A. F. Fang, G. Xu, T. Dong, P. Zheng, N. L. Wang, arXiv:1203.4061.
- (23) S. V. Dordevic, D. N. Basov, and R. C. Dynes, E. Bucher, Phys. Rev. B 64, 161103(R) (2001).
- (24) W. Z. Hu, G. T. Wang, Rongwei Hu, C. Petrovic, E. Morosan, R. J. Cava, Z. Fang, and N. L. Wang, Phys. Rev. B 78, 085120 (2008).
- (25) W. Z. Hu, G. Li, J. Yan, H. H. Wen, G. Wu, X. H. Chen, and N. L. Wang, Phys. Rev. B 76, 045103 (2007).