Tunneling in double barrier junctions with ’hot spots’
Abstract
We investigate electronic transport in epitaxial Fe(100)/MgO/Fe/MgO/Fe double magnetic tunnel junctions with soft barrier breakdown (hot spots). Specificity of these junctions are continious middle layer and Nitrogen doping of the MgO barriers which provides soft breakdown at biases about 0.5V. In the junctions with hot spots we observe quasi-periodic changes in the resistance as a function of bias voltage which point out formation of quantum well states in the middle Fe continuous free layer. The room-temperature oscillations have been observed in both parallel and antiparallel magnetic configurations and for both bias polarizations. A simple model of tunneling through hot spots in the double barrier magnetic junction is proposed to explain qualitatively this effect.
pacs:
PACS number: 73.21.-b; 73.63.Rt; 72.25.MkRecent theoretical predictions Butler ; Mathon followed by experimental observations of coherent tunneling in magnetic tunnel junctions (MTJs) with MgO barriers Bowen ; Faure-Vincent ; Parkin ; Yuasa ; GuerreroAPL have busted research of MTJs Moodera (here and are ferromagnetic layers and - insulating barrier), and opened new perspectives of their applications in spintronic devices. For thin enough electrodes, electron tunneling may reveal resonant features due to quantum well states (QWS). Early studies explored the simplest way to realize resonant tunneling by growing a thin nonmagnetic layer (NM) between ferromagnetic electrode and barrier in standard MTJ structures LeClair ; YuasaScience ; Greullet . However, resonant tunneling in double MTJs (DMTJs) ( is central layer) may have advantages in comparison with the standard MTJs, mainly due to their enhanced tunnelling magnetoresistance (TMR) Barnas ; Petukhov ; Kalitsov and resonant spin-torque effects VedyaevA ; Theodonis ; Watanabe . TMR in DMTJs only weakly varies at low bias voltages PeraltaRamos , which is crucial for applications. Last but not least, the current driven magnetization reversal in DMTJs occurs at relatively low current densities Watanabe .
In DMTJs the QWS can strongly influence electron transport only if the Fc layer has submonolayer roughness and its thickness exceeds 1nm minimizing Coulomb blockade (CB) effects G.Feng . On the other hand, the Fc layer should also be thin enough so that energy separation of QWS substantially exceeds the thermal energy. These conditions are hardly fulfilled in the macroscopic DMTJs Tiusan-JCM ; Coey , where resonant tunneling was not observed mainly due to the absence of the atomically flat surfaces over entire junction lateral dimensions. Evidence for a local tunneling through QWS in the central Fe layer in junctions was provided by Iovan et al. Iovan using the point contact technique. Recently, Nozaki et al. Nozaki-PRL reported on resonant tunneling effects in macroscopic DMTJs with Fe nano islands incorporated into the thick MgO barrier. Their results have been interpreted as due to combined QWS YanWang and CB effects.
This letter reports on the detailed study of electron transport in epitaxial macroscopic Fe/MgO/Fe/MgO/Fe junctions with continuous middle Fe layer and current flowing through the ’hot spots’. Oscillatory conductance and TMR with applied voltage present clear signatures of the local coherent tunneling through QWS. The oscillations have been observed in both parallel and antiparallel magnetic configurations and for both bias polarizations, contrary to Ref.Nozaki-PRL where they were seen only in the parallel configuration and for one current orientation. Moreover, we observe oscillations in the room temperature (RT) regime, while in Ref.Nozaki-PRL they were seen mainly at low temperatures. Finally, the technique we used for their observation is also different and makes use of some features of breakdown junctions, which allow to observe quantum oscillations in a continuous layer. Our results have been explained within a simple model which assumes formation of single or multiple ’hot spots‘.
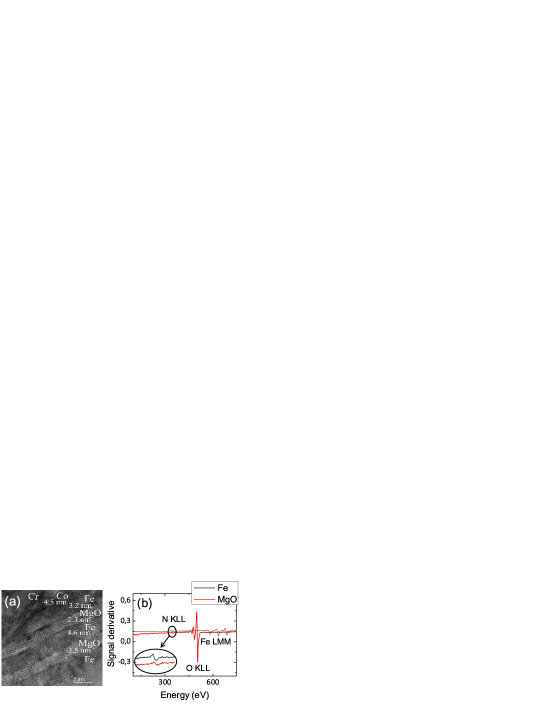
The junctions under study have the following structure: MgO//MgO10nm /V1.5nm /Cr40nm /Co5nm /Fe3nm /MgO2nm /Fe5nm /MgO2nm /Fe10nm /Co20nm /Pd10nm /Au10nm. The MTJ stacks were grown by molecular-beam epitaxy with the base pressure of 510-10 Torr in the presence of atomic Nitrogen. The MgO barrier and the Fe layers were grown at RT. The Fe was annealed to 450∘ for flattening. The high resolution cross-sectional TEM images (Fig. 1) generally corroborate the good structural quality and homogeneity of DMTJs. Since the TEM images are deduced from inverse Fourier transform of a diffraction pattern integrated across the sample thickness, the amorphous zones, if present, add a diffuse backgound to the diffraction pattern of the single crystal zones. More details of standard double barrier samples growth may be found in Tiusan-JCM . The specificity of the samples studied here is a Nitrogen doping of all the layers achieved during the growth, with a Nitrogen concentration roughly estimated to less than 2%. Although further studies are needed to determine the concentration of Nitrogen inside MgO, recent report ParkinMarch revealed that MgO barrier in MTJs may be doped up to 2.5% of Nitrogen without changes in the crystalline structure. In our samples, the structural analysis by RHEED, Auger spectroscopy and magnetometry demonstrate that, despite the Nitrogen doping (as evidenced from Auger, see Fig.1b), the structural and magnetic properties are not affected. The RHEED patterns of Fe and MgO (not presented here) are identical to those of Nitrogen-free samples. What is important for the studies presented in this paper is that, from electrical transport point of view, the barrier doping by Nitrogen is responsible for local ’soft’ dielectric breakdown Dimitrov with reduced breakdown voltage. This may be expected to keep barrier and central Fe electrode compositions nearly unchanged. After the MBE growth of the multilayer stack, the MTJ structures were patterned to 10 by UV lithography and Ar-ion etching, step-by-step controlled in situ by Auger.
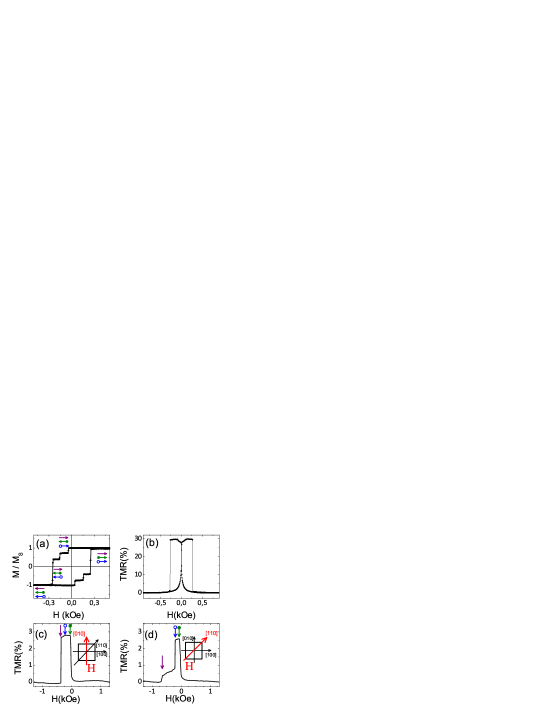
Figure 2 shows the RT magnetization measured with magnetic field along the Fe easy (100) axis (EA). One observes well defined transitions of the three distinct Fe layers. This is indirect indication of epitaxy and conservation of magnetic properties (fourfold anisotropy) for Nitrogen doped Fe. The zero bias TMR is close to 30% (Fig.2b).
Application of the bias exceeding roughly 500 mV leads to breakdown of the junctions, which in turn reduces zero-bias TMR down to about 4% (see Figs. 2. Two other observations indicate indirectly that this breakdown decreases the effective MgO barrier height most probably by transforming locally nearly crystalline MgO regions near a ’hot-spot’ into amorphous. Firstly, the coercive field of the central free Fe layer remains unchanged after breakdown (Hc=45 Oe), while coercive fields of the upper and bottom electrodes increase substantially about 50%. These changes are most probably due to hardening of the Fe/Co interfaces by high current density close to the ’hot-spot’. The second indication for the possible amorphization of the MgO barrier during the breakdown with intact middle electrode is our experimental observation of the signature of QWS in the electron transport in some of the broken DMTJs which we discuss below.
We have carried out detailed study of the RT resistance as a function of magnetic field with three different field orientations: EA, the hard (110) axis -HA, and in intermediate axis (IA) situated approximately at 10 degrees from the EA. Here we present results obtained at bias voltages up to 1.5V and with the steps of 25mV for those broken DMTJs which showed reproducible signatures of the changes in the resistance with bias (Fig.3). The zero bias TMR varies substantially along the three mentioned directions. As expected, TMR is reduced along IA in comparison with EA and HA directions, where transitions in all three magnetic layers as indicated by arrows are reflected in the TMR. We shall concentrate further on the electron transport data obtained with field along HA and IA directions, where the largest relative changes in TMR vs. bias were observed.
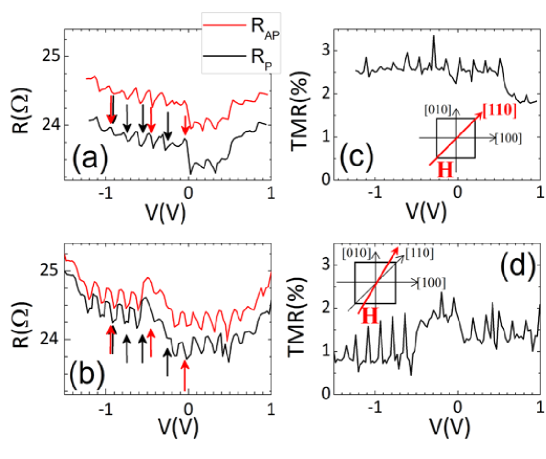
Figure 3 shows typical bias dependence of the resistance for parallel (P) and antiparallel (AP) states with magnetic field along HA. One observes oscillatory behavior of R and TMR with a period close to 150mV in both P and AP states. It is important to note that these oscillations, more clearly resolved for negative bias when current flows from the upper to bottom electrodes (Figs. 3), have period that is in reasonable agreement with the predictions by Wang et al. YanWang . Figures 3a,c mark with arrows the majority spin QWS energies calculated within about 1V above (red) and below (black) the Fermi energy YanWang .
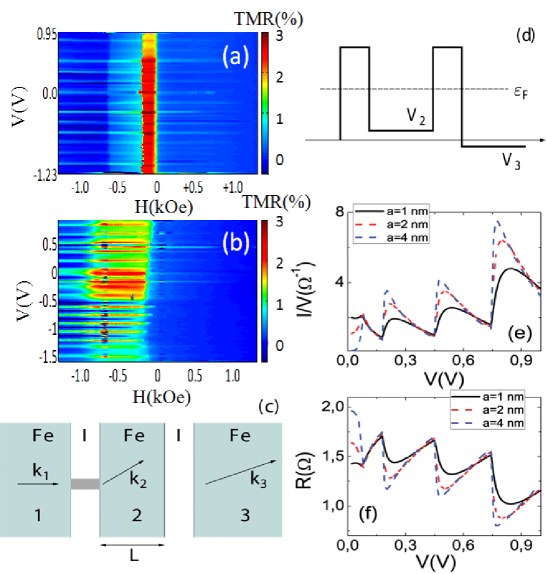
Although the absolute values of TMR measured with the field along IA are reduced in comparison with those for the fields along EA and HA, the relative changes of the TMR with bias are substantially enhanced (see Fig. 3b,)). In order to understand this effect we remind that the measurements of tunnel resistance with the field along IA are usually observed X.Liu to be most sensitive to small variations in the angle between magnetizations of the fixed and free layers in comparison with EA and HA configurations. We suggest here that the strongest relative changes in TMR(V) for the IA configuration could be a consequence of local spin-torque effects which are predicted to be enhanced with intermediate alignment of the ferromagnetic layers Theodonis . Figures 4 represent 3D plots of TMR vs magnetic field and bias with magnetic fields applied along HA and IA respectively. Dependence of TMR on bias is observed to be more asymmetric with field along IA (Figs. 4 ), which is in agreement with possible influence of local spin torque effects in the breakdown regions.
Let us now discuss physical mechanisms which could be behind the main experimental findings. Before breakdown, the current is roughly uniform across the junction area and weak interface disorder might introduce decoherence suppressing the effects due to QWS. The ’soft’ breakdown of the doped MgO may create defects and local amorphization which locally reduce the MgO barriers leading to ’hot spots’ which connect Fe and Fe/Co leads with the central Fe layer. With ’hot spots’ of sufficiently small lateral dimensions, electrons tunneling to the central layer can sample well defined structure of QWS due to lack of decoherence. The remaining part of the macroscopic DMTJ provides then some averaged featureless background signal. The feasibility of the above scenario is qualitatively supported by the good correspondence of the observed periodic variations in R vs.V and the theory taking into account QWS formed within 4.6 nm thick central Fe electrode YanWang (see Figure 3a,c).
In order to describe the observed features, we consider a DMTJ (Fig. 4c,d) with barriers including a number of ’hot spots’. The average conductance of the structure is Lifshitz where is the conductance due to a single -th spot, is the probability of realization of a certain configuration of the -th spot, and is a set of parameters characterizing this configuration. Let us assume that a particular ’hot spot’ is characterized by its lateral dimension . The current through the spot can be then calculated as
| (1) |
where are the normal and lateral wavevector components of the incoming wave (layer 1), and are the normal components of the wavevectors in layers 2 and 3, respectively. Here we assumed that the in-plane component of is conserved for tunneling from layer 2 to 3, whereas for tunneling through the spot there is no conservation of the in-plane component due to broken translational symmetry, and the scattering can be described by an angle distribution function . In our calculations we use the approximation , which means that scattering to the state with large in-plane component is effectively suppressed. Equation (1) includes transmission probabilities and for tunneling from the layer 1 to 2, and from 2 to 3, respectively. The sum over runs over discrete values satisfying the quantization condition . It should be emphasized that this condition is related only to thickness of the layer 2 and is the same for any other ’hot spot’.
Calculating the integral over we find
| (2) |
The conductance as a function of bias for a single spot is presented in Fig. 4e for different values of . We assumed nm, the barrier width nm, eV, and the barrier height eV. As we see, the oscillation peaks related to the level quantization in the layer 2 are more pronounced for wide spots, and they are effectively damped for small . This is because the small spot enables tunneling with nonconserved in-plane component of the wave vector.
Taking into account tunneling from many different spots, we obtain qualitatively the same picture corresponding to a mean value of , and proportional to the number of spots. The total conductance of the structure includes a constant non-oscillating part, , related to the tunneling without spots. In Fig. 4f we present resistance calculated as , where is the number of spots and is the mean value of . We note that the variation of barrier heights at the spot does not affect the position of peaks and does not change the shape of peaks, changing only the amplitude. Thus, averaging over randomly distributed and barrier heights gives a picture like for a single spot with some mean values of and .
The applicability of the above model requires a number of conditions. Although location of the oscillation peaks does not depend on the spot dimension (), the ’hot spot’ should not exceed average dimensions over which central electrode is atomically flat. Also, as seen from Fig.4e,f, decreasing the parameter makes oscillations less visible (damped). Therefore we expect the hot spots to be roughly of nm lateral size. Secondly, if magnetic moment of one or two layers is reversed (AP alignment,) the resistance becomes very large because the minority band will be displaced well above the Fermi energy. However realistically speaking the hot spot region of the MgO barrier may be not fully epitaxial either due to structural defects and/or Nitrogen doping. This can strongly reduce spin filtering by the band in the AP alignment, substantially suppressing TMR in real DMTJs with ’hot spots’.
In conclusion, we have presented evidence for local resonant tunneling through quantum well states in the middle continuous free layer of a double magnetic tunnel junction. The oscillations have been observed at room temperature in both parallel and antiparallel magnetic configurations and for both bias polarizations. Owing to specific features of the breakdown junctions, we were able to observe quantum well states in continuous magnetic layers. To observe similar effects in the Nitrogen free DMTJ, the junction area should be smaller than the size of terraces of the Fe central layer. Understanding of electron transport in magnetic tunnel junctions with defects and ’hot spots’ is of great importance both from fundamental and applied points of view. Recent reports link spin torque oscillations with record low bandwidth to the presence of defects and hot spots inside the MgO barrier of MTJs HoussameddinePRL .
We thank S. Parkin and J. Martinek for stimulating discussions, F.Greullet for help with experiment and E.Snoeck for taking TEM images. The work was supported by Spanish MICINN (MAT2009-10139, MAT2006-28183-E, CSD2007-0010, Integrated Action project FR2009-0010) and CAM (P2009/MAT-1726), by the FCT Grant PTDC/FIS/70843/2006 in Portugal and by Polish Ministry of Science and Higher Education as a research project in years 2007 – 2010.
References
- (1) W. Butler, et. al, Phys. Rev. B 63, 054416 (2001).
- (2) J. Mathon, et. al, Phys. Rev. B 63, 220403(R) (2001).
- (3) M. Bowen, et. al, Appl.Phys.Lett. 79, 1665 (2001).
- (4) J. Faure-Vincent, et. al, Appl.Phys.Lett. 82, 4507 (2004).
- (5) S. Parkin, et. al, Nat.Mater 3, 862 (2004).
- (6) S. Yuasa, et. al, Nat.Mater 3, 868 (2004).
- (7) R. Guerrero, et. al, Appl.Phys.Lett. 91, 132504 (2007).
- (8) J. Moodera, et. al, Phys. Rev. Lett 74, 3273 (1995).
- (9) P. LeClair, et. al, Phys. Rev. Lett 84, 2933 (2000).
- (10) S. Yuasa, et. al, Science 297, 234 (2002).
- (11) F. Greullet, et. al, Phys. Rev. Lett 99, 187202 (2007).
- (12) J. Barnas, et. al, Phys. Rev. Lett 80, 1058 (1998).
- (13) A. Petukhov, et. al, Phys. Rev. Lett 89, 107205 (2002).
- (14) A. Kalitsov, et. al, Phys. Rev. Lett 93, 046603 (2004).
- (15) A. Vedyaev, et. al., Phys. Lett. A 355, 243 (2006).
- (16) I. Theodonis, et. al, Phys.Rev.B 76, 224406 (2007).
- (17) M. Watanabe, et. al, Appl.Phys.Lett. 92, 082506 (2008).
- (18) J. Peralta-Ramos, et. al, Phys. Rev. B 78, 024430 (2008).
- (19) G. Feng, et. al, J. Appl. Phys. 105, 07C926 (2009).
- (20) C. Tiusan, et. al, J.Phys.: Cond. Mat. 19, 165201 (2007).
- (21) G. Feng, et. al, Appl.Phys.Lett. 89, 162501 (2006).
- (22) A. Iovan, et. al, NANO LETTERS 8, 805 (2008).
- (23) T. Nozaki, et. al, Phys.Rev.Lett. 96, 027208 (2006).
- (24) Y. Wang, et. al, Phys. Rev. Lett 97, 087210 (2006).
- (25) S. Parkin, APS2009 March Meeting, Z32.00001 (2009).
- (26) D. Dimitrov, et. al, Appl.Phys.Lett. 94, 123110 (2009).
- (27) X. Liu, et. al, J. Appl. Phys. 92, 8 (2002).
- (28) I. Lifshitz, et. al, Sov. Phys. JETP 50, 499 (1979).
- (29) D. Houssameddine, et.al, PRL 102, 257202 (2009).
I FIGURE CAPTIONS
.
.
.
.